Persistency of lactation can be characterised as the ability of an animal to keep milk production after reaching peak yield. The presence of genetic variations among animals for lactation persistency was reported in previous studies (Cobuci et al. Reference Cobuci, Euclydes, Costa, Lopes, Torres and Perreira2004). Lactation persistency is directly associated with economic considerations of dairy enterprise because its improvement can result in the decrease of production system costs. The crucial point in genetic improvement of lactation persistency is its measurement method (Khorshidie et al. Reference Khorshidie, Shadparvar, Ghavi Hossein-Zadeh and Joezy Shakalgurabi2012). However, there is still no general agreement on the best method for characterising persistency (Cole & VanRaden, Reference Cole and VanRaden2006; Khorshidie et al. Reference Khorshidie, Shadparvar, Ghavi Hossein-Zadeh and Joezy Shakalgurabi2012). Several different measures were proposed for estimating lactation persistency (Gengler, Reference Gengler1996). Persistency measures were classified into four groups including: measures obtained from the lactation curve parameters, those according to ratios between daily, peak, partial and total yields, measures based on the difference in test day yields and those derived from random coefficients of the random regression test day models (Swalve & Gengler, Reference Swalve and Gengler1999).
Estimates of genetic parameters for different persistency measures and their genetic correlations with milk yield rely on the method of defining persistency (Swalve & Gengler, Reference Swalve and Gengler1999; Jakobsen et al. Reference Jakobsen, Madsen, Jensen, Pedersen, Christensen and Sorensen2002; Khorshidie et al. Reference Khorshidie, Shadparvar, Ghavi Hossein-Zadeh and Joezy Shakalgurabi2012). A measure of lactation persistency should be associated with the lactation curve flatness and should be explained independently from production level (Gengler, Reference Gengler1996; Jensen, Reference Jensen2001). If independent, the heritability estimate for persistency and its genetic correlation with milk production is reduced, implying that milk yield justifies a part of the genetic variance in lactation persistency (Muir, Reference Muir2004; Cole & VanRaden, Reference Cole and VanRaden2006; Khorshidie et al. Reference Khorshidie, Shadparvar, Ghavi Hossein-Zadeh and Joezy Shakalgurabi2012). Therefore, concurrent selection for total yield and lactation persistency could reduce the stress of peak yield in high producing cows, and minimise reproductive problems and disease incidences, while keeping high lactation milk production (Elmaghreby, Reference Elmaghreby2012). In view of the economic value of persistency (Dekkers et al. Reference Dekkers, ten Hag and Weersink1998) and its appropriate association with reproductive performance (Muir, Reference Muir2004) and health traits (Jakobsen et al. Reference Jakobsen, Madsen, Jensen, Pedersen, Christensen and Sorensen2002), some researches were conducted to evaluate genetically the lactation persistency and to estimate breeding values of animals for this trait (Jakobsen et al. Reference Jakobsen, Madsen, Jensen, Pedersen, Christensen and Sorensen2002; Khorshidie et al. Reference Khorshidie, Shadparvar, Ghavi Hossein-Zadeh and Joezy Shakalgurabi2012). For these reasons various studies have indicated that selection for this trait would be advantageous.
Although several studies have been conducted to estimate genetic parameters and genetic trends for lactation milk yield (e.g. Ghavi Hossein-Zadeh, Reference Ghavi Hossein-Zadeh2011a, Reference Ghavi Hossein-Zadehb; Ghavi Hossein-Zadeh, Reference Ghavi Hossein-Zadeh2017) and milk yield persistency (Khorshidie et al. Reference Khorshidie, Shadparvar, Ghavi Hossein-Zadeh and Joezy Shakalgurabi2012; Canaza-Cayo et al. Reference Canaza-Cayo, Sávio Lopes, da Silva, de Almeida Torres, Fonseca Martins, Arbex and Cobuci2015) in dairy cows, genetic parameters and genetic trends of lactation persistency for milk yield of buffaloes are rare in the literature. Therefore, the objective of this study was to estimate the genetic parameters for different measures of persistency for milk yield using a random regression test day model. The other objective of current study was to estimate the genetic trends for different measures of lactation persistency in Iranian buffaloes.
Materials and methods
Data
Test day production records of the first three lactations of buffaloes within 715 herds comprising 43 014, 38 941 and 33 937 records, respectively, were obtained from the Animal Breeding Center of Iran during 1992 to 2012. General description and management of buffaloes in Iran, along with the analysis of their population structure were reported in previous studies (Borghese, Reference Borghese2005; Ghavi Hossein-Zadeh, Reference Ghavi Hossein-Zadeh2015a, Reference Ghavi Hossein-Zadehb). Outliers and out of range records were deleted from the analyses. Observations which were not within three sd of the average milk yield were considered as outliers. Records from days in milk (DIM) <5 and >270 were eliminated. Analyses were applied to only the first three lactations and, therefore, data from later lactations were also discarded. Ages at calving were required to be between 24 and 60, 39 and 76, and 54 and 100 months in lactations one, two, and three, respectively. Number of test day records per animal were required to be within the range from 4 to 9. Also, individual daily milk production was required to be between 1 and 20 kg. The number of animals, sires and dams in the pedigree of Iranian buffaloes were 42 285, 549 and 6376, respectively.
Statistical and genetic analysis
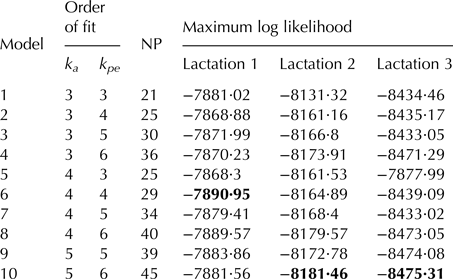
Legendre polynomial functions were chosen to fit the lactation curves in the framework of a random regression test day model for estimating (co)variance components. Model specification and the choice of fixed effects to be included in the model were based on the backward elimination method and variables which were significant at P < 0·05 were considered in the model. In order to obtain the appropriate random regression test day model for the genetic analysis of test day milk yield with the minimum number of parameters, different orders of fit for random regression coefficients of additive genetic and permanent environmental effects were evaluated. Also, the optimum set of polynomials was selected according to the logarithm of the likelihood function at the point of conversion and total number of parameters to be estimated. Different orders of fit for various random regression test day models which were examined in the present study are presented in Table 1. The difference of these models was based on the Legendre polynomials applied to fit the covariance functions for additive genetic and permanent environmental effects. Maximum logarithm likelihood of the models was compared and models with the lowest values of this criterion were selected for further analysis. Test day production records were analysed using the following random regression model:
 $$\eqalign{ Y_{{\rm imnptv}} &= {\rm Y}{\rm S}_i + {\rm HT}{\rm D}_m + \mathop \sum \limits_{\,f = 0}^2 c_f\,({\rm ag}{\rm e}_n)^f + \mathop \sum \limits_{r = 0}^k {\rm \beta} _r\emptyset _r(\dim _t) \cr & \quad + \mathop \sum \limits_{r = 0}^{k_{a - 1}} {\rm \alpha} _{\,pr}\emptyset _r\left( {{\dim} _t} \right) + \mathop \sum \limits_{r = 0}^{k_{\,p - 1}} {\rm \gamma} _{\,pr}\emptyset _r\left( {{\dim} _t} \right) + e_{{\rm imnptv}}} $$
where, Y
imnptv: test day record i obtained at DIM t of cow p calved at the nth age in herd-test date m, HTD
m
: fixed effect of mth herd-test date, YS
i
: fixed effect of ith calving year-season, c
f
: the fth fixed regression coefficient for calving age, age
n
: the nth calving age, k: the order of fit for fixed regression coefficients (k = 2), β
r
: the rth fixed regression coefficient, k
a
: the order of fit for additive genetic random regression coefficients, k
p
: the order of fit for permanent environmental random regression coefficients, α
pr
: the rth random regression coefficient of additive genetic value for pth cow, γ
pr
: the rth random regression coefficient of permanent environmental effect for pth cow,
 $\emptyset _r(\dim _t)$
: the rth coefficient of Legendre polynomials evaluated at days in milk t, e
imnptv: the random residual error.
Different orders of fit for various random regression test day models which were examined in the present study (the best models are indicated in bold face)
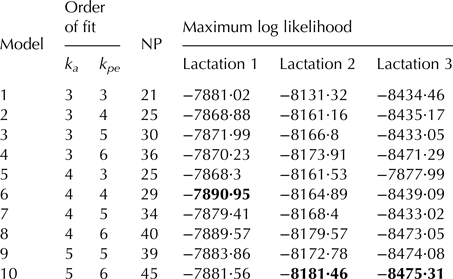
k a and k pe : orders of fit for additive genetic and permanent environmental effects, respectively; NP, number of parameter for estimated variance function.
All random regression analyses were conducted using the Average Information Restricted Maximum Likelihood (AIREML) algorithm of the WOMBAT program (Meyer, Reference Meyer2006).
Lactation persistency measures
The following measures were used to describe lactation persistency in this study. These measures were modified based on the lactation curve conditions of buffaloes and adapted for 270 d milk production within lactation:
-
1. The average of estimated breeding values (EBVs) for test day milk yields from day 226 to day 270 as a deviation from the average of EBVs from day 44 to day 62 (adapted from Kistemaker, Reference Kistemaker2003):
 $${\rm P}{\rm M}_1 = \displaystyle{1 \over {44}}\mathop \sum \limits_{i = 226}^{270} {\rm EB}{\rm V}_i - \displaystyle{1 \over {21}}\mathop \sum \limits_{i = 44}^{62} {\rm EB}{\rm V}_i$$
-
2. A summation of contribution for each day from day 53 to day 247 as a deviation from day 248 (adapted from Jakobsen et al. Reference Jakobsen, Madsen, Jensen, Pedersen, Christensen and Sorensen2002; Cobuci et al. Reference Cobuci, Euclydes, Costa, Torres, Lopes and Perreira2007):
$${\rm P}{\rm M}_2 = \mathop \sum \limits_{i = 53}^{247} ({\rm EB}{\rm V}_i - {\rm EB}{\rm V}_{248})$$
-
3. The difference between EBVs for day 257 and day 80 (adapted from Cobuci et al. Reference Cobuci, Euclydes, Costa, Lopes, Torres and Perreira2004, Reference Cobuci, Euclydes, Costa, Torres, Lopes and Perreira2007):
$${\rm P}{\rm M}_3 = \left( {{\rm EB}{\rm V}_{257} - {\rm EB}{\rm V}_{80}} \right)$$


Small absolute values of abovementioned measures indicate a high lactation persistency. If
 $ \hat {\rm\alpha} _i$
was a (k
a
× 1) vector of the estimates of additive genetic random regression coefficients specific to the animal i, and Z
t
was a (k
a
× 1) vector of Legendre polynomial coefficients evaluated at day t, the EBV of animal i for day t was calculated as follows:
 $$\eqalign{ {\rm EB}{\rm V}_a &= \; \mathop \sum \limits_{i = 0}^{ka - 1} a_{ij}\; \emptyset _j\; \left( {{\dim} _t} \right) \cr & = {\hat a}_{0i}\emptyset _{0t} + {\hat a}_{1i}\emptyset _{1t} + {\hat a}_{2i}\emptyset _{2t} + \; {\hat a}_{3i}\emptyset _{3t}} $$
Therefore, the EBV of animal i for 270 d production was obtained by summing the EBVs from day 5 to day 270:
 $$\eqalign{{\rm EBV}{\rm T}_t = & \sum\limits_5^{270} {({\hat a}_{0i}\emptyset _{0i} + {\hat a}_{1i}\emptyset _{1i} + {\hat a}_{2i}\emptyset _{2i} + {\hat a}_{3i}\emptyset _{3i})} \cr = & \left( {\sum\limits_5^{270} {\emptyset _{0t}} \sum\limits_5^{270} {\emptyset _{0t}} \sum\limits_5^{270} {\emptyset _{0t}} \sum\limits_5^{270} {\emptyset _{0t}}} \right){\hat a}_i = Z_{c270}{\hat a}_i} $$
Where, Z c270 is a vector of the summations of Legendre polynomials corresponding to total lactation production. In addition to 270 d production, we could estimate a Z c corresponding to each persistency measures used in the current study as follows:
For the first lactation milk yield:
 $$\matrix{ {Z_{c270} = (0 \cdot 7071} \hfill & {1 \cdot 42 \times {10}^{-17}} \hfill & {0 \cdot 0059} \hfill & { - 6 \cdot 7 \times {10}^ {-18} )} \hfill \cr {Z_{c{\rm P1g}} = (0} \hfill & {0 \cdot 7839} \hfill & {0 \cdot 8491} \hfill & { - 0 \cdot 0664)} \hfill \cr {Z_{c{\rm P2g}} = (0} \hfill & {1 \cdot 6361} \hfill & {1 \cdot 4825} \hfill & {0 \cdot 0645)} \hfill \cr {Z_{c{\rm P3g}} = (0} \hfill & { - 0 \cdot 9058} \hfill & { - 1 \cdot 2003} \hfill & { - 0 \cdot 3943)} \hfill \cr} $$
For second lactation milk yield:
 $$\matrix{ {Z_{c270} = (0 \cdot 7071} \hfill & {1 \cdot 42 \times {10}^ {-17}} \hfill & {0 \cdot 0059} \hfill & { - 6 \cdot 7 \times {10}^ {-18}} \hfill & {0 \cdot 0081)} \hfill \cr {Z_{c{\rm P1g}} = (0} \hfill & {1 \cdot 7839} \hfill & {0 \cdot 8491} \hfill & { - 0 \cdot 0664} \hfill & {0 \cdot 9964)} \hfill \cr {Z_{c{\rm P2g}} = (0} \hfill & {1 \cdot 6361} \hfill & {1 \cdot 4825} \hfill & {0 \cdot 0645} \hfill & {0 \cdot 8387)} \hfill \cr {Z_{c{\rm P3g}} = (0} \hfill & { - 0 \cdot 9058} \hfill & { - 1 \cdot 2003} \hfill & { - 0 \cdot 3943} \hfill & {0 \cdot 1712)} \hfill \cr} $$
For third lactation milk yield:
 $$\matrix{ {Z_{c270} = (0 \cdot 7071} \hfill & {1 \cdot 42 \times {10}^{-17}} \hfill & {0 \cdot 0059} \hfill & { - 6 \cdot 7 \times {10}^{-18}} \hfill & {0 \cdot 0081)} \hfill \cr {Z_{c{\rm P}1{\rm g}} = (0} \hfill & {0 \cdot 8024} \hfill & {0 \cdot 7036} \hfill & { - 0 \cdot 0763} \hfill & {0 \cdot 9288)} \hfill \cr {Z_{c{\rm P2g}} = (0} \hfill & {1 \cdot 6360} \hfill & {1 \cdot 4825} \hfill & {0 \cdot 0645} \hfill & {0 \cdot 8387)} \hfill \cr {Z_{c{\rm P3g}} = (0} \hfill & { - 0 \cdot 9058} \hfill & { - 1 \cdot 2003} \hfill & { - 0 \cdot 3943} \hfill & {0 \cdot 1712)} \hfill \cr} $$
Estimation of genetic parameters and genetic trends
The following formulas were applied to estimate additive genetic, permanent environmental and residual variances and heritabilities for different measures of persistency and 270 d milk yield:
 $$\eqalign{&{\rm \sigma} _{a_{(\,pi,{\rm EBV}_{270\,{\rm MY}})}} = Z_{c_{\,p_{ig}}} K_{a}Z_{c_{270\,{\rm MYg}}}^{\prime} \cr &{\rm \sigma}_{\,pe_{\,p_{i}}}^2 = Z_{c_{\,p_{{ipe}}}} K_{\,pe}Z_{c_{\,p_{{ipe}}}} ^{\prime} \cr &h_{\,p_i}^2 = \displaystyle{{{\rm \sigma}_{a_{\,p_{i}}} ^2} \over {{\rm \sigma} _{\,ph_{\,p_{i}}} ^2}} \cr &{\rm \sigma} _{a_{270\,{\rm MY}}}^2 = Z_{c_{270\,{\rm MYg}}}K_aZ_{c_{270\,{\rm MYg}}}^{\prime} \cr &{\rm \sigma} _{\,pe_{270\,{\rm MY}}}^2 = Z_{c_{270\,{\rm MYpe}}}K_aZ_{c_{270\,{\rm MYpe}}}^{\prime}} $$
 $$\eqalign{&e = \,8.85\,{\rm K}{\rm g}^2 \cr &{\rm \sigma} _{e_{\,p_{1}}} ^2 = \left( {\displaystyle{1 \over {44}} + \displaystyle{1 \over {18}}} \right){\rm \sigma} _e^2 \cr &{\rm \sigma} _{e_{\,p_{2}}}^2 = 48620{\rm \sigma} _e^2 \cr &{\rm \sigma} _{e_{\,p_{3}}} ^2 = 2{\rm \sigma} _e^2 \cr &{\rm \sigma} _{e_{270\,{\rm MY}}}^2 = 266{\rm \sigma} _e^2} $$
Where, K
a
and K
pe
are matrices of direct additive genetic and permanent environmental (co)variances of random regression coefficients,
 ${\rm \sigma} _{a_{p_{i}}} ^2 $
,
 ${\rm \sigma} _{pe_{p_{i}}} ^2 $
,
 ${\rm \sigma} _{ph_{p_{i}}} ^2 $
and
 $h_{p_i}^2 $
are the additive genetic, permanent environmental, phenotypic variances and heritability estimate for ith persistency measure and
 ${\rm \sigma} _{a_{270\,{\rm MY}}}^2 $
,
 ${\rm \sigma} _{pe_{270\,{\rm MY}}}^2 $
,
 ${\rm \sigma} _{ph_{270\,{\rm MY}}}^2 $
and
 $h_{270\,{\rm MY}}^2 $
are the additive genetic, permanent environmental, phenotypic variances and heritability estimate for 270 d milk yield, respectively.
 ${\rm \sigma} _e^2 $
is a constant residual variance estimated for each day of lactation and
 ${\rm \sigma} _{e_{p_{1}}} ^2 $
,
 ${\rm \sigma} _{e_{p_{2}}} ^2 $
,
 ${\rm \sigma} _{e_{p_{3}}} ^2 $
and
 ${\rm \sigma} _{e_{270\,{\rm MY}}}^2 $
are residual variances for persistency measures PM1, PM2, PM3 and 270 d milk yield, respectively. Also, phenotypic variances were obtained by summing the genetic, permanent environmental and residual variances for different persistency measures and milk yield. Estimates of genetic correlations among persistency measures and with 270 d milk yield were obtained as follows:
 $${\rm \sigma} _{a_{(\,p_i,p_j)}} = Z_{c_{\,p_{{ig}}}} K_aZ_{c_{\,p_{{\,jg}}}} ^{\prime} $$
 $${\rm \sigma} _{a_{(\,p_i,{\rm EB}{\rm V}_{270\,{\rm MY}})}} = Z_{c_{\,p_{{ig}}}} K_aZ_{c_{270\,{\rm MYg}}}^{\prime} $$
 $$R_{a_{(\,p_i,p_j)}} = \displaystyle{{{\rm \sigma} _{a_{(\,p_i,p_j)}}} \over {\sqrt {({\rm \sigma} _{a_{\,p_i}}^2 )({\rm \sigma} _{a_{\,p_j}}^2 )}}} $$
 $$R_{a_{(\,p_i,{\rm EB}{\rm V}_{270\,{\rm MY}})}} = \displaystyle{{{\rm \sigma} _{a_{(\,p_i,{\rm EB}{\rm V}_{270\,{\rm MY}})}}} \over {\sqrt {({\rm \sigma} _{a_{\,p_i}}^2 )({\rm \sigma} _{a_{270{\kern 1pt} \,{\rm MY}}}^2 )}}} $$
Where,
 ${\rm \sigma} _{a_{(p_i,p_j)}}$
,
 ${\rm \sigma} _{a_{(p_i,{\rm EB}{\rm V}_{270\,{\rm MY}})}}$
,
 $R_{a_{(p_i,p_j)}}$
and
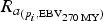 $R_{a_{(p_i,{\rm EB}{\rm V}_{270\,{\rm MY}})}}$
are genetic covariances and correlations between persistency measures and 270 d milk yield, respectively. Estimates of genetic trends for persistency measures were obtained by regressing the average estimated breeding values on birth year of animals.
Results
As indicated in Table 1, maximum log likelihood of the models 6, 10 and 10 had significant differences with other models for test-day milk yield in lactations one, two and three, respectively (P < 0·05). Therefore, model 6 was selected for fitting the additive genetic and permanent environmental effects for the analysis of first lactation milk yield, but model 10 was selected for second- and third lactation milk yield.
Heritability estimates for different milk yield persistency measures in the first three lactations of Iranian buffaloes are shown in Table 2. The highest heritability estimates were observed for PM2 over the first three lactations (0·29, 0·80 and 0·42, respectively). The lowest heritability estimate was for PM1 in the first lactation (0·09), but PM3 had the lowest heritability in second- and third lactations (0·23 and 0·17, respectively).
Heritability estimates for different milk yield persistency measures in the first three lactations of Iranian buffaloes

PM1 = The average EBVs for test day milk yields from day 226 to day 270 as a deviation from the average of EBVs from day 44 to day 62; PM2 = A summation of contribution for each day from day 53 to day 247 as a deviation from day 248; PM3 = The difference between EBVs for day 257 and day 80.
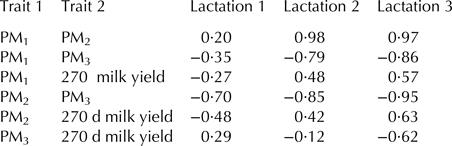
Genetic correlation estimates among different measures of persistency and between persistency measures and 270 d milk yield are depicted in Table 3. Estimates of genetic correlations between p3 and other persistency measures were generally high and negative and ranged from −0·95 between PM2–PM3 in the third lactation to −0·35 between PM1–PM3 in the first lactation. Genetic correlation estimates between PM1 and PM2 were positive and varied from 0·20 in the first lactation to 0·98 in the second lactation.
Estimated genetic correlations among different milk yield persistency measures and 270 d milk yield
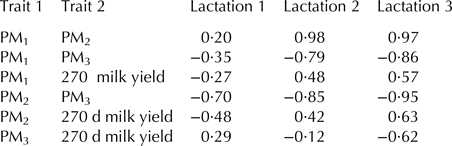
PM1 = The average EBVs for test day milk yields from day 226 to day 270 as a deviation from the average of EBVs from day 44 to day 62; PM2 = A summation of contribution for each day from day 53 to day 247 as a deviation from day 248; PM3 = The difference between EBVs for day 257 and day 80.
Estimation of genetic correlation between PM1 and first lactation milk yield was medium and negative (−0·27), but this correlation was positive and high for second- and third lactations (0·48 and 0·57, respectively). Also, genetic correlation estimate between PM2 and first lactation milk yield was negative and high (−0·48), but this correlation was positive and high for second- and third lactations (0·42 and 0·63, respectively). On the other hand, estimation of genetic correlation between PM3 and first lactation milk yield was medium and positive (0·29), but this correlation was negative for second- and third lactations (−0·12 and −0·62, respectively).
Estimates of genetic trends for different milk yield persistency measures are shown in Table 4. All estimates, except for genetic trend of PM2 in the first lactation, were not significant. Estimate of genetic trend for first lactation PM2 was negative and equal to −0·0088 ± 0·0043 (P < 0·05).
Genetic trends for different milk yield persistency measures in Iranian buffaloes

*Significant at P < 0·05; PM1 = The average EBVs for test day milk yields from day 226 to day 270 as a deviation from the average of EBVs from day 44 to day 62; PM2 = A summation of contribution for each day from day 53 to day 247 as a deviation from day 248; PM3 = The difference between EBVs for day 257 and day 80.
Discussion
Despite the easier calculation of PM3 compared to the other persistency measures, its heritability estimate was between the heritabilities estimated for two other persistency measures in the first lactation and had the lowest heritabilities in other lactations. A persistency measure with higher heritability is more appropriate to be considered in the goal of selection. Therefore, PM2 would be considered as the selection criterion in the first three lactations of Iranian buffaloes due to greater heritabilities compared with two other persistency measures. Estimates of genetic parameters for milk yield persistency measures of buffaloes were very scarce in the literature. Generally consistent with the current results, Pareek & Narang (Reference Pareek and Narang2014) reported the heritability estimate of persistency was 0·19 in the first lactation graded Murrah buffaloes of India. Pereira et al. (Reference Pereira, Verneque, Lopes, Santana, Lagrotta, Torres, Vercesi Filho and Machado2012) obtained low heritability estimate (0·08) for a persistency measure in Gyr cattle. Khorshidie et al. (Reference Khorshidie, Shadparvar, Ghavi Hossein-Zadeh and Joezy Shakalgurabi2012) reported the heritability estimates for persistency measures of PM1, PM2 and PM3 were 0·22, 0·09 and 0·11 in the first lactation Holstein cows, respectively.
The PM1 and PM3 measures of persistency evaluate the difference of milk production of two distinct parts of the lactation. The high and negative genetic correlation between PM2 and PM3 referred to the method of defining these persistency measures. The PM2 measure in comparison with PM1 and PM3 showed an area under the lactation curve at a specific time period which has been corrected for milk production at the finishing part of that time interval (Khorshidie et al. Reference Khorshidie, Shadparvar, Ghavi Hossein-Zadeh and Joezy Shakalgurabi2012). High positive genetic correlation between PM2 persistency measures with milk yield showed that high lactation persistency would result in greater milk production and vice versa. Persistency measures which had low genetic correlations with milk yield were considered to be the most appropriate measures in selection processes (Dekkers et al. Reference Dekkers, ten Hag and Weersink1998). If the genetic association between milk yield and persistency measure is negatively high, the selection for measure of persistency would negatively influence on the genetic progress for milk production. Based on this explanation, although genetic correlation of considered persistency measures with milk yield were generally medium to high, but PM1 had the lowest genetic correlation with 270 d milk yield in the first and third lactations and PM3 had the lowest one in second lactation buffaloes. Low genetic correlation estimates between measures of persistency with milk yield indicated that animals with the same level of milk yield would have different persistency level over the lactation (Jamrozik et al. Reference Jamrozik, Jansen, Schaeffer and Liu1998; Cobuci et al. Reference Cobuci, Euclydes, Costa, Torres, Lopes and Perreira2007). The advantage of genetic association between milk yield and a given measure of persistency relies on whether the average of this measure in the population is negative or positive (Khorshidie et al. Reference Khorshidie, Shadparvar, Ghavi Hossein-Zadeh and Joezy Shakalgurabi2012). Geetha et al. (Reference Geetha, Chakravarty and Vinaya Kumar2006) obtained positive genetic correlation between persistency measures and milk yield over the first lactation in Murrah buffaloes. Pareek & Narang (Reference Pareek and Narang2014) reported high positive genetic correlation (0·41) between persistency and milk production in graded Murrah buffaloes. Khorshidie et al. (Reference Khorshidie, Shadparvar, Ghavi Hossein-Zadeh and Joezy Shakalgurabi2012) estimated low genetic correlations between persistency measures and milk yield in Holstein cows. Pereira et al. (Reference Pereira, Verneque, Lopes, Santana, Lagrotta, Torres, Vercesi Filho and Machado2012) reported the genetic correlations between different persistency measures and milk yield in the range from −0·52 to 0·03 in Gyr cattle. Strapáková et al. (Reference Strapáková, Candrák and Strapák2016) estimated high negative genetic correlation between milk yield persistency with milk yield in Slovak Holstein cattle. Consistent with the results of this study, Khorshidie et al. (Reference Khorshidie, Shadparvar, Ghavi Hossein-Zadeh and Joezy Shakalgurabi2012) and Cobuci et al. (Reference Cobuci, Euclydes, Costa, Torres, Lopes and Perreira2007) obtained high negative genetic correlation between PM2 and PM3 in Holstein cows. Similar to the current results, Seyed Sharifi et al. (Reference Seyed Sharifi, Eskandari Nasab, Amanloo and Fathi Achachloie2006) obtained positive genetic correlation between PM1 and PM2 in Holstein cows, but Khorshidie et al. (Reference Khorshidie, Shadparvar, Ghavi Hossein-Zadeh and Joezy Shakalgurabi2012) reported negative genetic correlation between PM1 and PM2. Also, Geetha et al. (Reference Geetha, Chakravarty and Vinaya Kumar2006) considered two genetic persistency measures for first lactation Indian Murrah buffaloes and obtained high positive genetic correlation between them. The positive genetic correlations between PM1 and PM2 measures are evidence for similar physiological and genetic mechanisms controlling these measures and would result in similar ranking of animals based on these measures in selection programs. On the other hand, generally high negative genetic correlations between PM3 with two other measures indicated the presence of different mechanisms to control them.
Non-significant genetic trends obtained for nearly all measures of persistency in this study indicated the lack of any definite breeding plan for improving milk yield persistency in Iranian buffaloes until now. The results of our previous study indicated the positive phenotypic means of 270 d milk yield over the years and significantly negative genetic trend for this trait in Iranian buffaloes (Ghavi Hossein-Zadeh, Reference Ghavi Hossein-Zadeh2017). On the other hand, genetic correlation of PM2 and 270 d milk yield was estimated to be negative in first lactation buffaloes. This negative correlation along with negative genetic trend for milk yield indicated that decrease in milk yield over the years would increase persistency measure. If the value of PM2 measure was positive, selection for increased 270 d milk yield would decrease PM2 measure toward zero because of the negative genetic correlation between milk yield and PM2. Therefore, this negative genetic correlation would be suitable. On the other hand, if the value of PM2 measure was negative, selection for increased 270 d milk yield would depart p2 measure from zero and this change would be inappropriate. Khorshidie et al. (Reference Khorshidie, Shadparvar, Ghavi Hossein-Zadeh and Joezy Shakalgurabi2012) reported positive and significant genetic trend for PM1 and PM3 measures of persistency in Iranian Holsteins, but the genetic trend was not significant for PM2. Similar to the results of this study, Pereira et al. (Reference Pereira, Verneque, Lopes, Santana, Lagrotta, Torres, Vercesi Filho and Machado2012) observed no genetic gain in the selected measure of milk yield persistency of Gyr cattle.
Although persistency measures considered in this study had medium to high genetic correlation with milk yield, but PM1 had the lowest genetic correlation with 270 d milk yield in the first and third lactations and PM3 had the lowest correlation with milk yield in second lactation buffaloes. PM2 had the highest heritability estimate over the first three lactations. Therefore, PM2 measure would be considered as a selection criterion in Iranian buffaloes. Because genetic correlation between milk yield and PM2 was negative, selection for increased 270 d milk yield would decrease PM2 measure toward zero in Iranian buffaloes. Therefore, this negative genetic correlation would be suitable. It is essential to include milk yield persistency in the breeding goal of Iranian buffaloes along with other important traits such as milk yield or reproductive traits.
The authors acknowledge the Animal Breeding Centre of Iran for providing the data used in this study.