I. INTRODUCTION
Zinc coatings that are manufactured by batch or continuous galvanizing are used mainly to prevent the aqueous corrosion of steels by their good barrier and galvanic protection. Reference Park, Park, Paik, Huh and Hong1,Reference Marder2 The increasing demand for zinc-coated steels highlights that the quality and manufacturing efficiency of galvanized products are required constantly. Reference Xu, Bright, Liu and Barbero3 In galvanizing lines, liquid zinc corrosion of materials used as submerged pot rolls and other hardware is a significant problem. Reference Brunnock, Jones, Jenkins and Llewellyn4,Reference Liu, Barbero, Xu, Burris, Chang and Sikka5 Therefore, many studies have focused on obtaining improved hardware materials for galvanizing and prolonging the service life of these parts. Reference Brunnock, Jones, Jenkins and Llewellyn6–Reference Brunnock, Jones, Jenkins and Llewellyn9 Numerous materials have been investigated to evaluate their corrosion resistance in static liquid zinc, such as intermetallic alloys, spraying materials, and other composite materials. Reference Wang, Lin, Wang and Chen10,Reference Dong, Yan, He, Zhang and Li11 However, the properties estimated in static corrosion tests using liquid zinc may considerably differ from the real flowing liquid zinc environment. In this work, we focus on the dynamic corrosion characteristics and erosion–corrosion rate, and especially on differences between static and dynamic corrosion conditions in liquid zinc, to understand the damage mechanism of materials. This information is important for selecting and designing materials for galvanizing equipment under real production conditions.
Fe2B and FeB possess excellent corrosion resistance to liquid zinc because they are not wetted by liquid zinc. They can, therefore, be used as defensive surface boronizing coatings for hot dip galvanizing parts. Reference Tsipas and Perez-Perez12–Reference Tsipas, Triantafyllidis, Kiplagat and Psillaki18 However, a boronizing layer is always prone to spalling, which may limit its applications in galvanizing. Reference Ma, Xing, Fu, Yi, Zhi and Li19
Fe–B alloys that contain Fe2B corrosion-resistant phase and α-Fe ductile matrix exhibit good structural corrosion resistance to liquid zinc. Therefore, much research has been carried out on the corrosion resistance of these materials to estimate their performance under static liquid zinc conditions. Reference Tsipas, Triantafyllidis, Kiplagat and Psillaki18,Reference Cao, Ma, Wu, Wen, Fan and Du20 Nevertheless, the erosion of Fe–B alloys in flowing liquid zinc and its characteristics have seldom been reported on, which may reflect the real applied conditions for galvanizing parts. Therefore, it is necessary to investigate the erosion resistance of the Fe–B alloy in flowing liquid zinc. We investigate the erosion resistance and interfacial morphology of the Fe–B alloy in flowing liquid zinc at 460 °C, and also discuss the erosion mechanism of flowing liquid zinc to clarify the material damage under real galvanizing conditions. The failure of the Fe2B corrosion-resistant skeleton during flowing liquid zinc erosion is also analyzed.
II. EXPERIMENTAL PROCEDURES
A. Materials
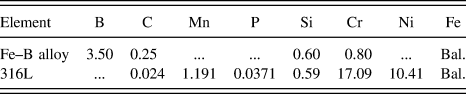
Fe–B alloy containing 3.5 wt% B was prepared in a 10 kg medium-frequency induction furnace to obtain Y-block ingots. To compare the erosion performance of Fe–B alloy in flowing liquid zinc, 316L stainless steel was selected as a standard sample. The chemical compositions of the Fe–B alloy and 316L stainless steel are listed in Table I.
Chemical compositions of the Fe–B alloy and 316L stainless steel (wt%).

Test specimens were cut using a wire electric discharge machine (120 mm × 15 mm × 5 mm) and were dipped into liquid zinc to a 40 mm depth. Before the corrosion tests, all specimens were polished using carborundum paper (2000 grade) and cleaned ultrasonically in pure alcohol. The initial thickness between the two side faces of the specimen was obtained from the average value measured 12 times at multiple locations using a micrometer. Reference Wang, Lin, Wang and Chen21
B. Erosion and corrosion tests
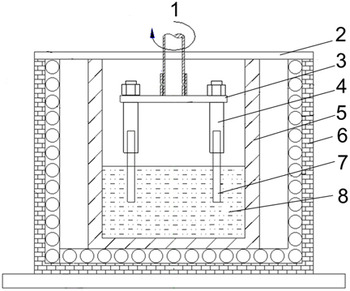
Liquid zinc erosion tests were carried out using the rotating-disk technique with the test device shown schematically in Fig. 1. Static immersion tests were carried out to clarify the differences between dynamic erosion and static corrosion of the Fe–B alloy in liquid zinc. In each immersion test, 30 kg fresh pure zinc was melted and kept at 460 °C in the furnace. The ceramic crucible for melting the zinc (230 mm in diameter and 300 mm in length) was made from 33 wt% SiN, 66 wt% SiC, and ∼1 wt% Si. A K-type thermocouple was immersed into liquid zinc to monitor the temperature. The furnace was sealed using an adhesive tape of aluminum foil and an Ar atmosphere was used to avoid liquid zinc oxidation. To ensure that iron in liquid zinc was unsaturated, the Fe concentration in liquid zinc during the test was estimated by calculating the total consumption of corroded solid sample dissolved into liquid zinc in the crucible (assuming that the corroded solid sample was pure Fe dissolved into 30 kg pure zinc as followed by Tang et al.). Reference Tang, Li, Kurosu, Koizumi, Matsumoto and Chiba22 The estimated result shows that the Fe concentration was maintained in the unsaturated state after erosion for 7 h. We later measured the corroded liquid zinc (near the sample surface) taken from the crucible during the subsequent 7 h erosion test by compositional analysis of inductively coupled plasma mass spectrometry (ICP-MS) data and added pure zinc ingot into the crucible periodically to ensure that liquid zinc was unsaturated.
Schematic drawing of the erosion–corrosion test device: 1 – rotating shaft, 2 – furnace cover, 3 – erosion angle control unit, 4 – sample holder, 5 – crucible, 6 – furnace, 7 – sample, 8 – flowing liquid zinc.

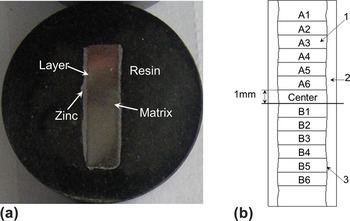
To ensure the accuracy of the experimental data, the eroded samples were cut perpendicular to their largest surface (original erosion surface) after the tests and the cut sample was embedded in resin. The perpendicular relationship was maintained during sample preparation for microscopic observation to determine the loss in thickness. Reference Tang, Li, Kurosu, Koizumi, Matsumoto and Chiba22 Figure 2 shows the schematic cross-section, location, and designation of the specimen thickness. The thickness of each corroded sample was measured microscopically following the previous methods. Reference Liu, Barbero, Xu, Burris, Chang and Sikka5,Reference Tang, Li, Kurosu, Koizumi, Matsumoto and Chiba22 The corroded sample taken from liquid zinc was implanted in the resin to show the transverse section [see Fig. 2(a)]. The thickness of each corroded sample was measured microscopically at 1 mm intervals across the cross-sections. Figure 2(b) shows the location and designation of thickness measurement for tested samples. The measurement was not performed to the end of the sample but was made up to 6 mm from either side of the sample center to eliminate erroneous data from sample tapering by accelerated corrosion in these areas. The average thickness loss was used to calculate the corrosion and erosion rates of the tested alloys as follows [Eq. (1)] Reference Liu, Barbero, Xu, Burris, Chang and Sikka5,Reference Ma, Xing, Fu, Yi, Zhi and Li19,Reference Tang, Li, Kurosu, Koizumi, Matsumoto and Chiba22,Reference Ma, Xing, Yi, Fu and Liu23 :
 $$R = {{a - b} \over {2t}}\quad {\rm{,}}$$
where R is the corrosion or erosion rate (μm/h), a is the average original thickness (μm), b is the average final thickness (μm), and t is the corrosion or erosion time (h). A factor of 1/2 was used in the equation to reflect the fact that the average thickness change of the sample is caused by corrosion of both sample faces.
Cross-section, location, and designation of the specimen thickness: (a) the cross section of the sample after erosion–corrosion test, (b) the location and designation of thickness measurement for tested samples: 1 – sample, 2 – zinc, 3 – corrosion interface.

C. Characterization
To analyze the effect of grain and phase boundary on the erosion–corrosion behavior of the Fe–B alloy, electron backscattered diffraction (EBSD) analysis was carried out on the as-cast and corroded samples. The observation and analysis of metallographic microstructures were performed using a Leica DMI 5000M optical microscope (OM), a backscattered electron image (BSE), and an energy dispersive spectrum (EDS). For the metallographic observations, all samples were etched in a 4 vol% nital solution. Phase analysis of the samples was undertaken by XRD in a MXP21VAHF diffractometer using Cu Kα radiation coupling continuous scanning for a 2θ angle from 20° to 100° at 200 mA and 40 kV, a scanning speed of 2°/min and a step space of 0.02°.
III. RESULTS AND DISCUSSION
A. Microstructural characteristics of initial material
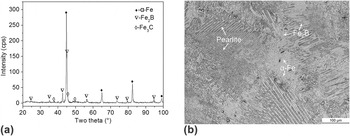
Figure 3 shows the XRD pattern and microstructure of the as-cast Fe–B alloy. The XRD results show that the as-cast Fe–B alloy is mainly composed of α-Fe, Fe2B, and some Fe3C [shown in Fig. 3(a)]. The OM micrograph of the as-cast alloy is shown in Fig. 3(b). Eutectic Fe2B is distributed over the metallic matrix as a continuous network and fish-bone structure and some pearlite exists at the iron matrix grain boundaries.
XRD pattern and microstructure of the as-cast Fe–B alloy: (a) XRD pattern, (b) OM image.

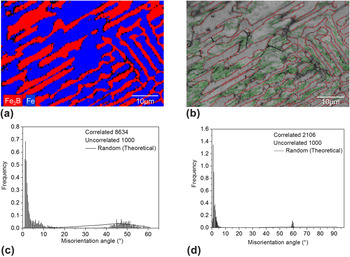
The grain misorientation analysis of the as-cast Fe–B alloy by EBSD is shown in Fig. 4. Figure 4(a) shows the distribution map of the α-Fe and Fe2B phases. Figure 4(b) shows the grain boundary distribution map. The α-Fe and Fe2B phases have many low-angle grain boundaries, as shown in Figs. 4(c) and 4(d). Figure 4(c) indicates that major misorientation angles of the α-Fe phase are less than 10° and others range from 40° to 55°. The types of grain misorientations of the Fe2B phase are shown in Fig. 4(d), and most of the misorientation angles are less than 10°.
EBSD analysis of the as-cast Fe–B alloy: (a) phase distribution; (b) grain boundary distribution: black lines indicate grain boundaries with a misorientation larger than or equal to 10°, green lines indicate grain boundaries with smaller misorientations than 10°, and red lines indicate phase boundaries; (c) misorientation distribution of Fe; (d) misorientation distribution of Fe2B.

B. Corrosion and erosion properties in liquid zinc
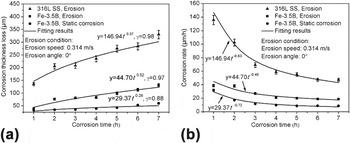
Figure 5 shows the average thickness loss and corrosion rate as a function of corrosion time. From Fig. 5(a), it can be seen that the erosion thickness loss of 316L stainless steel is larger than that of the Fe–B alloy in the same erosion time, and differences in average thickness loss between the Fe–B alloy and 316L stainless steel increase with increasing erosion time over the experimental time. These results indicate that the Fe–B alloy shows a better erosion resistance to flowing liquid zinc. From Fig. 5(b), we can infer that the Fe–B alloy has a high erosion rate in the initial stage, and its erosion rate declines gradually and tends to stability with increasing erosion time, which is much lower than that of 316L stainless steel. The erosion and corrosion processes are given by the following model [Eq. (2)] Reference Short, Ballinger and Hänninen24,Reference Gulsoy, Was, Pawel and Busby25 :
 $$Y = k{t^n}\quad {\rm{,}}$$
where Y is the loss in thickness (μm), t is the time (h), n is the index, and k is a constant related to the diffusion coefficient.
Corrosion thickness loss and corrosion rate as a function of corrosion time: (a) corrosion thickness loss versus corrosion time, (b) corrosion rate versus corrosion time.

An analysis of the fitting curves with higher correlation coefficients for the alloys tested shows that erosion and corrosion in liquid zinc may follow typical parabolic or power function relationships (i.e., different index, n), and the correlation coefficients (i.e., γ) of the fitting curves for 316L in dynamic corrosion and the Fe–B alloy under dynamic and static corrosion are 0.98, 0.97 and 0.88, respectively. From the different fitting coefficients and indexes (namely diffusion coefficient and corrosion reaction rate), the fitting results also indicate that a synergetic effect is likely to occur between the erosion and corrosion by flowing liquid zinc. This effect may be correlated to the controlling intensity of the flowing erosion and corrosion reaction and also the microstructures of the tested materials (such as reaction diffusion barriers by the corrosion-resistant phase).
The thickness loss caused by erosion in the flowing liquid zinc is significantly greater than that in the static liquid zinc, and the rate difference increases with increasing test time. The flowing effect of liquid zinc accelerates zinc diffusion and the damage of corrosion-resistant Fe2B.
C. Microstructural characteristics of erosion–corrosion sample
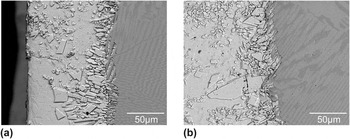
Figure 6 shows the corrosion morphologies of the Fe–B alloy after 1 and 5 h in static liquid zinc. Many corrosion compounds exist at the corrosion layers. Because of corrosion of the iron matrix, part of the Fe2B phase protrudes from the matrix and remains at the corrosion layers, but the residual length of Fe2B surrounded by loose corrosion compounds is short, which indicates that spalling of the Fe2B occurs gradually while accompanying iron matrix corrosion, probably because of the lost supporting effect of the iron matrix. Reference Ma, Xing, Fu, Yi, Zhi and Li19
Interfacial morphologies of static corrosion of the Fe–B alloy: (a) 1 h, (b) 5 h.

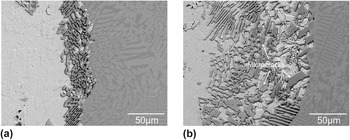
The interfacial morphologies of the Fe–B alloy in flowing liquid zinc are different from that in static liquid zinc. Figure 7 shows the erosion interface morphologies of the Fe–B alloy in the flowing liquid zinc with an erosion angle of 0° and flowing liquid zinc velocity of 0.314 m/s (the diameter of a sample moving trajectory is 100 mm and the rotation speed of the setup is 60 r/min). As shown in Fig. 7(a), few erosion compounds exist at the erosion layers after 1 h of erosion owing to the flowing effect of liquid zinc under erosion conditions. The residual length of Fe2B formed at the erosion layers under erosion conditions is longer than that of Fe2B under static corrosion conditions, and it increases remarkably as the corrosion time is extended. This indicates that the flowing effect of liquid zinc accelerates matrix corrosion compared with static corrosion. A few erosion compounds exist at the erosion layers [as shown in Fig. 7(b)]. Long residual Fe2B skeleton can effectively buffer and resist the flowing of liquid zinc, and the erosion of flowing liquid zinc is weakened. However, residual Fe2B generates distinct fragmentation and spallation at the erosion layers because of the lost supporting effect of the iron matrix that is corroded rapidly by liquid zinc and the formation and spread of microcracks when erosion continues after 5 h [as shown in Fig. 7(b)]. The new residual Fe2B skeleton may protrude from the matrix and continue to buffer and weaken the erosion of flowing liquid zinc, as shown in Fig. 7(b).
Erosion morphologies of the Fe–B alloy in flowing liquid zinc with erosion angle of 0° and the velocity of the flowing liquid metal is 0.314 m/s (rotation speed of 60 r/min): (a) 1 h, (b) 5 h.

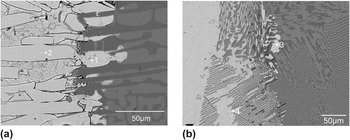
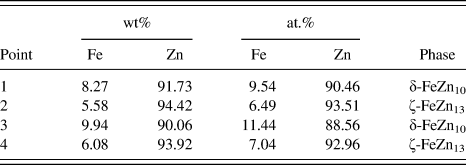
Figure 8 shows the EDS analysis of compounds at corrosion layers after tests for 5 h. The phase composition measured by EDS analysis in Fig. 8 is given in Table II. According to previous research, Reference Marder2,Reference Verma and van Ooij26,Reference Verma and van Ooij27 the static corrosion compounds are small δ-FeZn10 close to the matrix [point 1 in Fig. 8(a)] and loose masses of ζ-FeZn13 phase near liquid zinc [point 2 in Fig. 8(a)]. Figure 8(b) and Table II show that some columnar δ-FeZn10 phase [point 3 in Fig. 8(b)] and ζ-FeZn13 phase [point 4 in Fig. 8(b)] exist among the Fe2B at the erosion layers. Significant differences between corrosion and erosion exist in terms of the amount of compounds and residual Fe2B at the erosion–corrosion layers.
EDS analysis of corrosion layer of the Fe–B alloy: (a) static corrosion, (b) erosion.

Compositional results of corrosion products measured by EDS analysis.

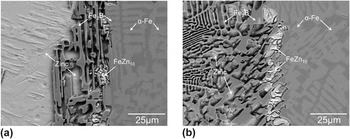
Further analysis of the erosion interface morphology is shown in Fig. 9. The erosion compounds increase gradually near the matrix as the erosion time is prolonged because the erosion effect of flowing liquid zinc is weakened by residual Fe2B, which also increases the diffusion distance between the iron matrix and liquid zinc. Some adhesive FeZn10 phase forms at the inner interface near the iron matrix. The isolation of iron and zinc is caused by residual Fe2B (i.e., increasing diffusion distance), and the difficult zinc diffusion through the FeZn10 compound makes subsequent erosion and corrosion weak. Hence, the erosion rate decreases and tends to be constant after approximately 5 h of erosion. Variations of liquid zinc erosion performance for the Fe–B alloy are affected significantly by spalling of the Fe2B phase because of the lost supporting effect of the iron matrix corroded by liquid zinc. The flowing of liquid zinc in the erosion process accelerates atomic zinc diffusion, which causes rapid matrix corrosion. The rapid zinc diffusion accelerates the iron matrix corrosion, and then causes the Fe2B spalling owing to the absence of matrix supporting effect, which leads to the lost buffer effect of residual Fe2B for flowing liquid zinc during erosion and corrosion. The flowing liquid zinc also constantly removes erosion compounds through its erosion effect, and leads to significant erosion damage.
High magnification erosion interface morphologies of the Fe–B alloy by BSE: (a) 1 h, (b) 5 h.

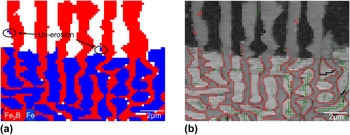
In general, the existence of low-angle grain boundaries in alloys may improve material anticorrosion because of the low grain boundary energy. Reference Arafin and Szpunar28–Reference Tsurekawa, Nakamichi and Watanabe31 The effect of grain and phase boundary on corrosion of many alloys in different media and hydrogen corrosion of uranium metal has been investigated. Reference Arafin and Szpunar28,Reference Guérin, Andrieu, Odemer, Alexis and Blanc32–Reference Jones, Scott, Petherbridge and Glascott34 The results above indicate that grain and phase boundaries can affect the corrosion resistance of materials because of different mechanisms caused by grain and phase boundaries, such as grain boundary energies and intergranular corrosion, etc. According to previous examinations, the main type of grain boundary of Fe2B and iron matrix in the Fe–B alloy is a low-angle grain boundary, which may also be beneficial to improve the corrosion resistance of the Fe–B alloy in liquid zinc. Reference Ma, Xing, Fu, Yi, Zhi and Li19,Reference Wang, Lin, Wang and Chen21,Reference Campos, Palomar, Amador, Ganem and Martinez35 EBSD analysis was carried out on corroded samples, as shown in Fig. 10. Corrosion and erosion of the iron matrix is rapid, and its corrosion is uniform dissolution in the stable stage. The corrosion resistant Fe2B shows no wetting with liquid zinc at low- and high-angle boundaries. Intergranular corrosion between iron and Fe2B by liquid zinc is not obvious. Therefore, liquid zinc corrosion may not be influenced by the grain boundary structure of the Fe–B alloy, which shows a typical physical–chemical corrosion and dissolution. Figures 10(a) and 10(b) show that little uncorroded α-Fe phase exists on the residual Fe2B skeleton, which indicates that the corrosion of phase boundaries between Fe2B and the matrix in flowing liquid zinc is not obvious. So the phase and grain boundaries of the Fe–B alloy do not exhibit corrosion sensitivity in liquid zinc.
EBSD analysis of the erosion interface: (a) phase distribution; (b) grain boundary distribution: black lines indicate grain boundaries with a misorientation larger than or equal to 10°, green lines indicate grain boundaries with smaller misorientations than 10°, and red lines indicate phase boundaries.

D. Erosion of the Fe–B alloy
When solid metal erosion–corrosion occurs by liquid metals, the dissolution rate constant k d and the mass transfer coefficient k m must be discussed. In the initial stage, the dissolution rate constant k d is described by Eqs. (3) and (4) (Refs. Reference Giorgl, Durighello and Nicolle36 and Reference Dybkov37):
 $${k_{\rm{d}}} = 0.62{D^{{2 \over 3}}}{\nu ^{-{1 \over 6}}}{\omega ^{{1 \over 2}}}\quad {\rm{for}}\quad Sc > 1000\quad {\rm{,}}$$
 $${k_{\rm{d}}} = 0.554{I^{ - 1}}{D^{{2 \over 3}}}{\nu ^{-{1 \over 6}}}{\omega ^{{1 \over 2}}}\quad {\rm{for}}\quad 4\; \lt\; Sc \;\lt\; 1000\quad {\rm{,}}$$
where D is the diffusion coefficient of dissolved metal in the liquid metal (m2/s), ν is the kinematic viscosity of the bath (m2/s), ω is the angular velocity (s−1), and I is a function of the Schmidt number (Sc). At 465 °C, which is very close to the conditions of this test, the D value of Fe is 9.8 × 10⁻¹⁰ m2/s and ν is 5 × 10⁻⁷ m2/s. Reference Giorgl, Durighello and Nicolle36,Reference Assael, Armyra, Brillo, Stankus, Wu and Wakeham38 Sc is given by Eq. (5) according to the present conditions Reference Giorgl, Durighello and Nicolle36 :
 $$Sc = {\nu \over D}\quad {\rm{,}}$$
where Sc is equal to 500. Therefore, Eq. (4) is valid for calculating k d and I is 0.9286. Reference Dybkov37 By calculation, k d is equal to 2.07 × 10⁻⁵ m/s. Several experimental studies have demonstrated the validity of Eqs. (3) and (4) for initial pure liquid Al baths and under these conditions, the intermetallic compounds that are formed are unstable and enhance the rate of metal dissolution into the liquid bath. Reference Giorgl, Durighello and Nicolle36
The effect of boundary layer of the solid–liquid interface on erosion in flowing liquid metal has been studied by many researchers. Reference Celerier and Barbier39,Reference Niinomi, Ueda and Sano40 The influence of hydrodynamic parameters on the erosion of alloys in flowing liquid metal has been analyzed and the mass transfer coefficient calculated by boundary layer theory. According to the Nernst boundary layer theory, a liquid thin layer exists between the interfaces of the two phases.
The Reynolds number (Re) is used to describe the dynamic regime of the boundary layer and can be calculated from Eq. (6) Refs. Reference Giorgl, Durighello and Nicolle36 and Reference Dybkov37:
 $$Re = {{\omega {r^2}} \over \nu }\quad {\rm{,}}$$
where r is the radius of sample rotation. Re is found to be 31,400, and it is also described by Eq. (7) (Ref. Reference Cussler41):
 $$Re = {{\rho Vx} \over u}\quad {\rm{,}}$$
where ρ is the molten metal density (kg/m), V is the molten metal linear velocity (m/s), u is the dynamic viscosity (kg/(m s)), and x is the distance at which the laminar boundary layer ends. The density of molten zinc is 6508 kg/m3 and u is 3.245 × 10⁻³ kg/(m s) at 476.85 °C. Reference Assael, Armyra, Brillo, Stankus, Wu and Wakeham38 The flowing velocity of liquid zinc is 0.314 m/s. The estimated value of x is 50 mm, which is greater than the length of liquid zinc flowing through the sample surface (15 mm). The conditions of the boundary layer flow are laminar, so the mass transfer coefficient k m is described by Eq. (8) (Ref. Reference Cussler41):
 $${{{k_{\rm{m}}}L} \over D} = 0.646{\left( {{{LV\rho } \over u}} \right)^{{1 \over 2}}}{\left( {{u \over {\rho D}}} \right)^{{1 \over 3}}}\quad {\rm{,}}$$
where L is the length of liquid zinc flowing through the sample surface (m). By calculation, k m is 32.73 × 10⁻⁵ m/s.
The dissolution rate constant k d is less than the mass transfer coefficient k m, hence, erosion is strongly controlled by interfacial reaction during the initial erosion. The erosion compounds at the erosion interface are loose and a strong washing effect of flowing liquid zinc on the erosion layers can result in a rapid removal of loose FeZn13 formed at the interface. Fresh liquid zinc can, therefore, infiltrate the compounds and make contact with the matrix, which can accelerate further corrosion of the iron matrix. Thus, more residual Fe2B exists at the interface as discussed above.
As the erosion continues, the existence of a net-like Fe2B phase and erosion compounds decreases the erosion rate of the Fe–B alloy in flowing liquid zinc significantly, so the Fe–B alloy shows an improved erosion-resistant performance to flowing liquid zinc erosion. Liquid zinc in contact with the matrix is hindered by net-like Fe2B phase and erosion compounds, which delays the occurrence of the interfacial reaction. Thus, the controlling erosion step can change from interfacial reaction to zinc diffusion through erosion compounds. The Fe2B phase may be supported by the matrix and play a role in the erosion resistance to liquid zinc. The matrix and Fe2B can resist flowing liquid zinc erosion and corrosion because of the barrier effect of Fe2B on liquid zinc and the supporting effect of the iron matrix on the Fe2B phase, which may be used to design a resistant erosion–corrosion material in liquid zinc.
IV. CONCLUSIONS
-
(1) The Fe–B alloy exhibits a low and steady erosion rate in flowing liquid zinc compared with 316L stainless steel.
-
(2) The flowing effect of liquid zinc can accelerate iron and zinc mass transfer to form Fe–Zn compounds and promote the removal of loose and blocky FeZn13. This leads to a large erosion rate compared with the corrosion of static liquid zinc.
-
(3) Much residual Fe2B skeleton and some erosion products coexist at the erosion layers because of chemical and micromechanical effects created by flowing liquid zinc erosion, which shows a synergetic erosion–corrosion effect.
-
(4) The failure of Fe2B in flowing liquid zinc depends strongly on the lost supporting effect of the iron matrix that is corroded rapidly by liquid zinc and also on the formation and spread of microcracks during liquid zinc erosion.
ACKNOWLEDGMENTS
The authors thank the financial support for this work from the Natural Science Foundation of China under Grant Nos. 51301128, 51271142, and 51274016, the Specialized Research Fund for the Doctoral Program of Higher Education of China under Grant Nos. 20110201130008 and 20120201120005, the National Science Foundation for Post-doctoral Scientists of China under Grant Nos. 2012M521767 and 2013T60875, Shaanxi provincial postdoctoral research project, and the Fundamental Research Funds of Xi'an Jiaotong University under Grant Nos. xjj2013038 and xjj2014167.