Introduction
The Consortium to Establish a Registry for Alzheimer's Disease Neuropsychological assessment battery (CERAD-NP) is a widely used cognitive test battery for the evaluation of multiple cognitive domains such as episodic memory, language, and visuospatial ability in patients with Alzheimer's disease (AD) and other dementias (Morris et al., Reference Morris1989; Lee et al., Reference Lee2002; Lee et al., Reference Lee2004). Although the information for the overall level of cognitive state is very useful in both clinical and research settings, CERAD-NP originally provided only individual test scores. However, Chandler et al. (Reference Chandler2005) proposed a total score for CERAD-NP, which was calculated by summing the scores of six tests in CERAD-NP except the Mini-Mental State Examination (MMSE) and the Constructional Praxis Recall (CR) subtests. Chandler et al. (Reference Chandler2005) reported that the total score showed good reliability and validity for AD and amnestic mild cognitive impairment (aMCI) patients.
Since Chandler et al. (Reference Chandler2005) developed the method, a series of studies have applied the CERAD total score and consistently supported its validity and usefulness (Ehrensperger et al., Reference Ehrensperger, Berres, Taylor and Monsch2010; Paajanen et al., Reference Paajanen2010; Rossetti et al., Reference Rossetti, Munro Cullum, Hynan and Lacritz2010; Seo et al., Reference Seo2010; Hallikainen et al., Reference Hallikainen2013). For example, one validation study demonstrated that the total score is very useful in screening non-AD dementia with diverse etiologies, as well as AD dementia (Seo et al., Reference Seo2010). More importantly, the total score showed superior discriminability to MMSE on normal aging versus MCI or normal aging versus very early stage of dementia (Ehrensperger et al., Reference Ehrensperger, Berres, Taylor and Monsch2010; Paajanen et al., Reference Paajanen2010; Seo et al., Reference Seo2010). It also provided sensitive measurement of monitoring the progression of AD (Rossetti et al., Reference Rossetti, Munro Cullum, Hynan and Lacritz2010; Seo et al., Reference Seo2010; Hallikainen et al., Reference Hallikainen2013). In addition, a modified method to calculate the total score of CERAD-NP, which adds the CR score to the original total score (TS-I), was proposed (Seo et al., Reference Seo2010); the modified total score (TS-II) showed equivalent reliability and validity in MCI and dementia patients with diverse etiologies.
In general, cognitive performance is influenced by demographic factors. A proper understanding of the effects of demographic variables is important in order to give an accurate interpretation of cognitive test scores. Numerous studies have documented demographic influences on individual subtests in CERAD-NP and developed normative data in diverse populations (Unverzagt et al., Reference Unverzagt1996; Elias et al., Reference Elias, Elias, D’Agostino, Silbershatz and Wolf1997; Karrasch and Laine, Reference Karrasch and Laine2003; Lee et al., Reference Lee2004; Parsons et al., Reference Parsons, Rizzo, Zaag, McGee and Buckwalter2005; Beeri et al., Reference Beeri2006; Fillenbaum et al., Reference Fillenbaum, Burchett, Unverzagt, Rexroth and Welsh-Bohmer2011; Liu et al., Reference Liu2011; Murphy, Reference Murphy2012). In spite of the usefulness of the CERAD-NP total scores, limited normative information is available on total scores. Only one study provided a regression formula for demographic correction and normative data in the form of total scores (Chandler et al., Reference Chandler2005). The participants included in the normative analysis, however, were elderly people with high educational background (mean years of education [SD] = 13.9 [3.0]). A considerable number of elderly adults from non-western countries are poorly educated and are not normally exposed to neuropsychological tests. The more the individuals in a population are exposed to similar cognitive tests, the better the performance of a cognitive test (Flynn, Reference Flynn1987). Furthermore, previous normative studies on the CERAD-NP individual tests also showed that educational level explains much larger proportion of variance in test scores in an elderly population with poorly educated as well as highly educated individuals than in a population with only highly educated ones (Morris et al., Reference Morris1989; Lee et al., Reference Lee2004). Therefore, it is not advisable to extrapolate normative information from highly educated participants to populations with different educational backgrounds (Lee et al., Reference Lee2004). Therefore, further normative information of total scores based on elderly population with a wide range of educational levels is still needed.
In this study, we aimed to investigate the influence of age, education, and gender on the CERAD-NP total scores (TS-I and TS-II) and to provide normative information based on the analysis of a large number of elderly people with a wide range of educational levels.
Methods
Study population
One thousand nine hundred and eighty-seven healthy participants (620 males and 1,367 females; 50–90 years of age; and zero to 25 years of education) were included in this study. Nine centers located in various regions in South Korea (two public health centers, six dementia or memory clinics, and one senior citizens welfare center) had been conducting a community-based memory screening program for the early detection of dementia. An announcement for this program was made through local newspapers and posters placed on a bulletin board at each center. The study participants were recruited from the pool of elderly individuals registered in this program from January 1997 to February 2010. All participants lived independently in the community. The Institutional Review Board of the Seoul National University Hospital, South Korea, approved the study, and informed consent was obtained from each participant as prescribed by the institutional review board.
Each participant was examined by a psychiatrist with advanced training in neuropsychiatry and dementia research according to the protocol of the Korean version of CERAD clinical assessment battery (Lee et al., Reference Lee2002). In addition, we interviewed reliable informants to acquire accurate information regarding cognitive and functional changes in addition to their medical history. A panel comprising four psychiatrists with expertise in dementia research made clinical decisions, including dementia diagnosis. This panel reviewed all available raw data resulting from clinical evaluations.
All participants satisfied strict entry criteria excluding dementia and other serious medical, psychiatric, and neurological disorders that could affect mental function. Psychiatrists diagnosed dementia using the criteria detailed in Diagnostic and Statistical Manual of Mental Disorders, 4th Edition (DSM-IV; American Psychiatric Association, 1994). We excluded candidates with evidence of focal brain lesions on magnetic resonance image; the presence of severe behavioral or communication problems that would make a clinical examination difficult; absence of a reliable informant; and inability to read Korean (i.e. inability to read ten words in the Word List Memory (WLM) subtest from CERAD-NP). All participants possessed adequate vision and hearing, although many wore glasses and some required hearing aids. Individuals with minor physical abnormalities (e.g. diabetes with no serious complications, essential hypertension, mild hearing loss, etc) were included in the study.
We initially evaluated 2,086 individuals and excluded 99 (5.0%: 99/2,086) according to the exclusion criteria. The rates of exclusion were calculated for each category of recruitment sites: 4.7% (65/1,453) for public health centers, 5.8% (8/148) for senior citizen welfare center, and 5.6% (26/461) for clinics.
Measurement
The eight subtests of the CERAD-NP battery were administered by experienced clinical neuropsychologists or nurses. These subtests comprised the Verbal Fluency (VF), the Boston Naming Test (BNT), MMSE, WLM, the Constructional Praxis (CP), the Word List Recall (WLR), the Word List Recognition (WLRc), and CR. Administration procedures were previously described in detail (Lee et al., Reference Lee2004). Two total scores were derived from these tests according to the method previously proposed (Chandler et al., Reference Chandler2005; Seo et al., Reference Seo2010). The TS-I was the summation of VF (maximum score = 24), BNT (15), WLM (30), CP (11), WLR (10), and WLRc (10). The TS-II was calculated by adding praxis recall (11) to TS-I and the maximum scores of TS-I and TS-II were 100 and 111 respectively.
Statistical analysis
Statistical analyses were performed using SPSS version 12.0 for Windows. Stepwise multiple linear regression analysis was performed to assess the relative contribution of age, gender, and education on TS-I and TS-II. Age and education were continuous variables and gender was coded as either 0 or 1. In order to determine any main effects and interactions of age (i.e. 50–59, 60–69, 70–79, and 80–90 years), education (i.e. 0–3, 4–6, 7–9, 10–12, and ≥13 years), and gender (i.e. female and male) on the total scores, a series of 4 × 5 × 2 analyses of variance (ANOVA) were applied. Post hoc analysis with Tukey's method was conducted when any main effects were significant by ANOVA at p < 0.05 levels.
Results
Demographic characteristics
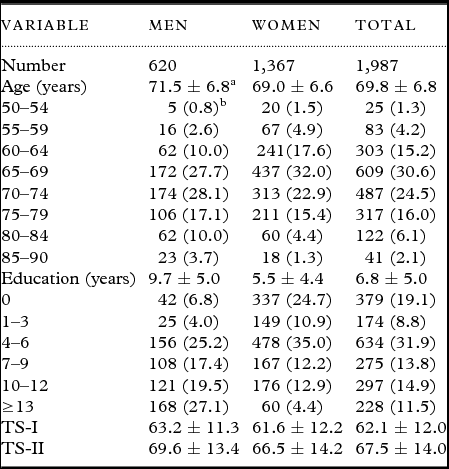
The demographic characteristics and mean values of TS-I and TS-II of 1,987 participants are presented in Table 1. The mean age of the participants was 69.8 years (SD = 6.8, range = 50~90) and the mean number of years spent in full-time education was 6.8 years (SD = 5.0, range = 0~25). Women comprised 68.8% of the participants. Men were older and had received more education than women (t(1985) = −7.75, p < 0.001 for age; and t(1985) = −18.04, p < 0.001 for education). For both TS-I and TS-II men outperformed women (t(1985) = –2.65, p < 0.01 for TS-I; and t(1985) = –4.54, p < 0.001 for TS-II).
Demographic characteristics of participants

Note: aMean value ± SD; bNumber (percentage); TS-I = CERAD total score I; TS-II = CERAD total score II.
Effects of age, gender, and education on the CERAD-NP total scores
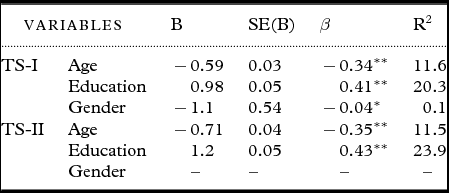
Both TS-I and TS-II were significantly influenced by demographic variables (Table 2). Of the demographic variables examined, education accounted for the greatest proportion of score variance (i.e. 20.3% for TS-I, and 23.9% for TS-II). Age effects were also significant accounting 11.6% for TS-I and 11.5% for TS-II. On the contrary, gender effect was the least significant (i.e. 0.1% of variance for TS-I and not significant for TS-II).
Stepwise multiple linear regression of age, education, and gender on the CERAD TS-I and TS-II
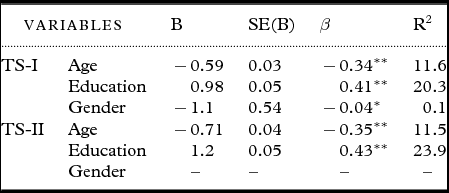
Notes: TS-I = CERAD total score I; TS-II = CERAD total score II; B = regression coefficient; SE(B) = standard error of B; β = standardized regression coefficient; R2 = percentage variance explained by each variable.
Age and education were entered as a continuous variable, and gender was coded as 0 and 1 for female and male respectively.
*p < 0.05; **p < 0.001 by stepwise multiple linear regression analysis.
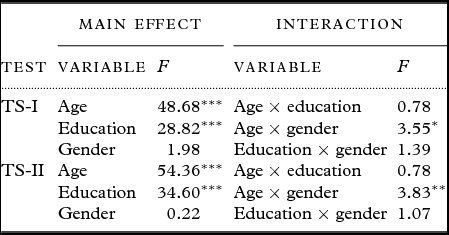
As shown in Table 3, ANOVA revealed the significant main effects of age (TS-I: F (3, 1959) = 48.68, p < 0.001; TS-II: F (3, 1959) = 54.36, p < 0.001), education (TS-I: F (4, 1959) = 28.82, p < 0.001; TS-II: F (4, 1959) = 34.60, p < 0.001), and interactions between age and gender (TS-I: F (3, 1959) = 3.55, p < 0.05; TS-II: F (3, 1959) = 3.83, p < 0.01) for both TS-I and TS-II. Post hoc contrasts revealed significant differences between any two pairs of the age groups among 50–59, 60–69, 70–79, and 80–90 years and the education groups (i.e. 0–3, 4–6, 7–9, 10–12, and ≥13 years). As expected, both TS-I and TS-II were better in younger and higher-educated individuals than in older and lower-educated ones. In order to provide more efficient normative tables, post hoc analyses for education were conducted in each age group. In the 50–59 age group, significant differences were found between ≥13 years and at or below 9 years of education (i.e. 0–3, 4–6, and 7–9 years) whereas no significant difference was observed between any of the two education groups among 0–3, 4–6, and 7–9 years, and between 10–12 and ≥13 years in both TS-I and TS-II. In the age groups of 60–69 and 70–79 years, significant difference was observed between the 0–3 and all higher education groups (i.e. 4–6, 7–9, 10–12, and ≥13 years) whereas no difference was found between the 4–6- and 7–9-year groups. In the age group of 80–90 years, significant difference was found in only between the 0–3 and >13 years education groups.
Analysis of variance for main effects and interactions between age, education, and gender on the CERAD TS-I and TS-II

Notes: TS-I = CERAD total score I; TS-II = CERAD total score II.
Age is categorized as 50–59, 60–69, 70–79, and 80–90 years.
Education is categorized as 0–3, 4–6, 7–9, 10–12, and ≥13 years.
Gender is categorized as female and male.
*p < 0.05; **p < 0.01; ***p < 0.001 by 4 × 5 × 2 analyses of variance (ANOVA).
In terms of the interaction effects, the interaction between age and gender was significant in both TS-I and TS-II. Post hoc subgroup analyses for each age stratum revealed that women outperformed men in relatively younger age groups (i.e. 50–59 years and 60–69 years). In contrast, no significant difference was observed for TS-I in 70–79 and 80–90 years age groups, and men outperformed women in 80–90 years age group for TS-II. The results from post hoc subgroup analyses were quite similar even when controlling educational level as a covariate. There were no significant interactions between age and education or between education and gender.
Normative data
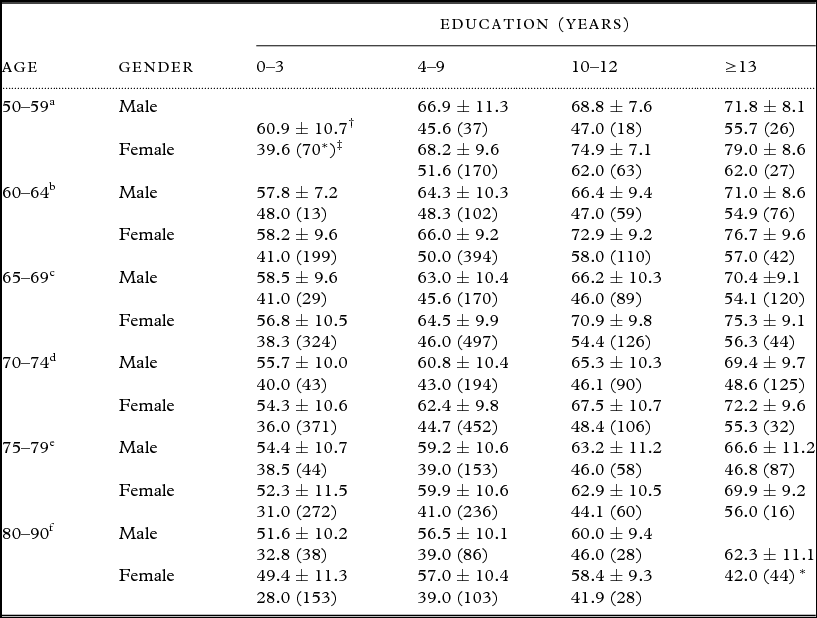
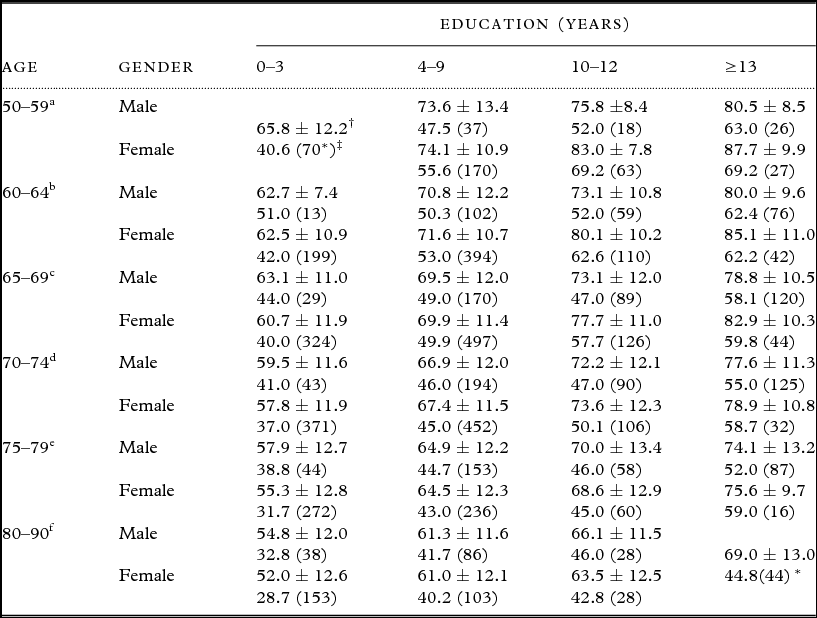
Based on the results from our analyses on demographic effects, both TS-I and TS-II scores were stratified by age, education, and gender (Tables 4 and 5). Educational levels were divided into four strata (i.e. 0–3, 4–9, 10–12, ≥13 years). Since no significant difference between the 4–6 and 7–9 years of education was found in most age strata, the two education subgroups were combined. Age subgroups were defined using overlapping stratifications as described by Lee et al. (Reference Lee2004). Overlapping strata have been originally suggested to maximize the clinical usefulness of normative test data (Pauker, Reference Pauker1988). Six overlapping age strata were developed with midpoint ages occurring at every five-year intervals from 57 through 82 years of age. Consequently, normative data from age groups 50–64, 55–69, 60–74, 65–79, 70–84, and 75–90 years were used for persons whose age ranged from 50–59, 60–64, 65–69, 70–74, 75–79, and 80–90 years respectively. TS-I and the TS-II are presented in the form of a mean value, standard deviation, and fifth percentile (Tables 4 and 5). However, sample numbers of women with the oldest age group with highest educational level (i.e. five in the 80–90 age group with ≥13 years of full-time education in Tables 4 to 5) and sample numbers of men with the youngest age group with the lowest educational level (e.g. two in the 50–59 age group with 0–3 years of full-time education in Tables 4 to 5) were limited in size. Since there were no significant gender effects within those cells, we combined data of men and women to provide more stable data.
Normative data of the CERAD TS-I

Notes: Maximum score of TS-I is 100; Normative TS-I was estimated from ages a50–64, b55–69, c60–74, d65–79, e70–84, and f75–90.
*Data from men and women were combined because gender effect was not found.
†Mean ± SD; ‡5th percentile (sample size).
Normative data of the CERAD TS-II

Notes: Maximum score of TS-Il is 111; normative TS-I was estimated from the ages a50–64, b55–69, c60–74, d65–79, e70–84, and f75–90.
*Data from men and women were combined because gender effect was not found.
†Mean ± SD; ‡5th percentile (sample size).
Discussion
The present study investigated the effects of demographic variables on the CERAD-NP total scores and provided normative information derived from a large elderly population with a wide range of educational levels. The findings demonstrated that both TS-I and TS-II were influenced by demographic factors, education, and age, in particular indicating that global cognitive function declines with age and the decline is slow in those with a higher educational level. Education was found to have greater influence on total scores than age and gender. These results are largely consistent with previous reports on the CERAD-NP total scores (Chandler et al., Reference Chandler2005; Paajanen et al., Reference Paajanen2010).
Unlike Lee et al's (Reference Lee2004) study, no main effect of gender was found. Different population characteristics may explain the difference between two studies. The population of the current study included more young (even 50~59 years) and more highly educated individuals compared with that of previous study. In general, gender effect on cognitive score is relatively smaller in young and highly educated group. In terms of interactions, significant interaction between gender and age was observed. Women performed better than men before seventies. However, such trend diminished with increasing age for TS-I, or became reversed pattern in the oldest age groups for TS-II. This finding suggests that women tend to have a sharper decline in global cognition with increasing age compared with men. In general, two major gender differences in cognitive function (i.e. female advantages for verbal function and male advantages for visuospatial function) have been reported. However, these gender-related differences in cognitive function do not seem to recur with increasing age. Although there are controversies, some studies reported that typical gender differences in cognitive performance disappeared in older age (Buckwalter et al., Reference Buckwalter, Rizzo, McCleary, Shankle, Dick and Henderson1996; Corey-Bloom et al., Reference Corey-Bloom, Wiederholt, Edelstein, Salmon, Cahn and Barrett-Connor1996), or even higher verbal task performance in favor of men in older age was observed (Wiederholt et al., Reference Wiederholt, Cahn, Butters, Salmon, Kritz-Silverstein and Barrett-Connor1993; Elias et al., Reference Elias, Elias, D’Agostino, Silbershatz and Wolf1997). More interestingly, Parsons et al. (Reference Parsons, Rizzo, Zaag, McGee and Buckwalter2005) demonstrated that men's visuospatial superiority was maintained into older age groups whereas women's verbal superiority diminished with aging. These reports are largely in agreement with our result of men's superiority of TS-II in the oldest age group because TS-II was calculated by adding praxis recall, demanding visuospatial ability, to TS-I. Stable visuospatial ability in men through lifetime and decline in verbal ability in women may explain our finding of gender-by-age interaction in global cognition. We should, however, be cautious in applying the concept of aging-related decline to this issue because the current study is cross-sectional and the cohort effect of each age-stratum rather than aging-related decline may explain in part the age × gender interaction for the CERAD total scores or global cognition. In a relatively older elderly group, for example, males had more chances of informal intellectual stimulation during their occupational activities, while females had fewer such opportunities. In contrast, the gender differences in intellectual stimulation due to respective social roles appear to be less prominent in relatively younger group.
Based on the results of demographic influences, our normative data were presented as six age strata (i.e. 50–59, 60–64, 65–69, 70–74, 75–79, 80–90 years) and four education strata (i.e. 0–3, 4–9, 10–12, ≥13 years) separately for men and women. For age strata, we adopted the overlapping method (Pauker, Reference Pauker1988), and thus were able to present more stratified and accurate normative information with adequate numbers of participants for most normative subgroups. In contrast to the previous normative study on the CERAD-NP total score (Chandler et al., Reference Chandler2005), which reported norms only for TS-I, we provided normative information on TS-II as well as TS-I. TS-II additionally includes the visual memory (i.e. CR) performance. The later version of CERAD-NP includes CR as a unique visuospatial memory measure which showed strong validity (Spangenberg et al., Reference Spangenberg, Henderson and Wagner1997). It may be reasonable to encompass the CR score to generate more comprehensive total score, and it was recommended that clinicians consider both TS-I and TS-II to make a better clinical decision if CR is administered with other CERAD subtests (Seo et al., Reference Seo2010). Therefore, the normative data for TS-II are likely to be very helpful to maximize clinical information obtained from the administration of CERAD-NP.
There were some limitations that should be mentioned about the current study. The participants were not randomly selected from general population, but conveniently recruited from the pool of individuals who voluntarily participated in the memory screening program. This might place some restrictions on the generalizability of our results. In addition, although the overall sample size was big enough to provide sophisticated and stable information for most cells in the normative tables, the size of some cells was still quite small (e.g. the cells for the 80–90 age group with >13 years of education and cells for the 50–59 age group with 0–3 years of education in Tables 4 to 5). As small sample size possibly reduces the stability of results, so we combined male and female data in the cells. Therefore, users should be more cautious when interpreting the scores of individuals within such cells.
In summary, the CERAD-NP total scores were influenced by age, education, and gender. Education had the strongest effect among the demographic factors. Interaction effect between gender and age was also observed. The normative information presented in this paper will allow clinicians and researchers to better interpret the CERAD-NP total scores and understand the level of global cognitive functioning. These data may also be useful for comparing the performance of the battery across countries.
Conflict of interest
None.
Description of authors’ roles
Ji Young Han and Eun Hyun Seo have contributed equally to this work. They were responsible for carrying out the statistical analysis and wrote the paper. Dahyun Yi, Bo Kyung Sohn, Young Min Choe, Min Soo Byun, Hyo Jung Choi, Shin Gyeom Kim, Shin Young Park, Jee Wook Kim, Jong Chul Youn, Jin Hyeong Jhoo, Jung Hie Lee, Ki Woong Kim, and Jong Inn Woo contributed to collecting the data and assisted with the writing of the paper. Dong Young Lee designed the study, supervised analyzing the data, and wrote the paper.
Acknowledgments
This work was supported by a grant from the Korea Healthcare Technology R & D Project, Ministry of Health, Welfare & Family Affairs, Republic of Korea (Grant No. A092145), a grant from KIST Open Research Program (Grant No. 2013-1520), and a grant from the Ministry of Science, ICT, and Future Planning, Republic of Korea (Grant No. 2013M3C7A1072998).