INTRODUCTION
The Greater Yellowstone Ecosystem (GYE) encompasses about 72,850 km2 of northwestern Wyoming, southwestern Montana, and eastern Idaho. Most of our understanding of the vegetation, fire, and climate history of this area is based on sites within the Yellowstone (YNP) and Grand Teton national parks at middle elevations (Waddington and Wright, Reference Waddington and Wright1974; Whitlock, Reference Whitlock1993; Millspaugh et al., Reference Millspaugh, Whitlock and Bartlein2000; Whitlock et al., Reference Whitlock, Dean, Rosenbaum, Stevens, Fritz, Bracht and Power2007; Iglesias et al., Reference Iglesias, Whitlock, Krause and Baker2018). In contrast, the vegetation and fire history at the margins of the GYE is based on isolated sites in southwestern Montana (Mumma et al., Reference Mumma, Whitlock and Pierce2012), just north of YNP (Krause et al., Reference Krause, Lu, Whitlock, Fritz and Pierce2015), and locations east and south of Grand Teton National Park (Fall et al., Reference Fall1994; Shuman et al., Reference Shuman, Pribyl, Minckley and Shinker2010). The ecological history of high elevations in the GYE, aside from studies in the Wind River Range (Fall, Reference Fall, Davis and Zielinski1995), is also poorly known, and this geographic gap limits our ability to understand long-term vegetation dynamics across elevational, latitudinal, and longitudinal gradients.
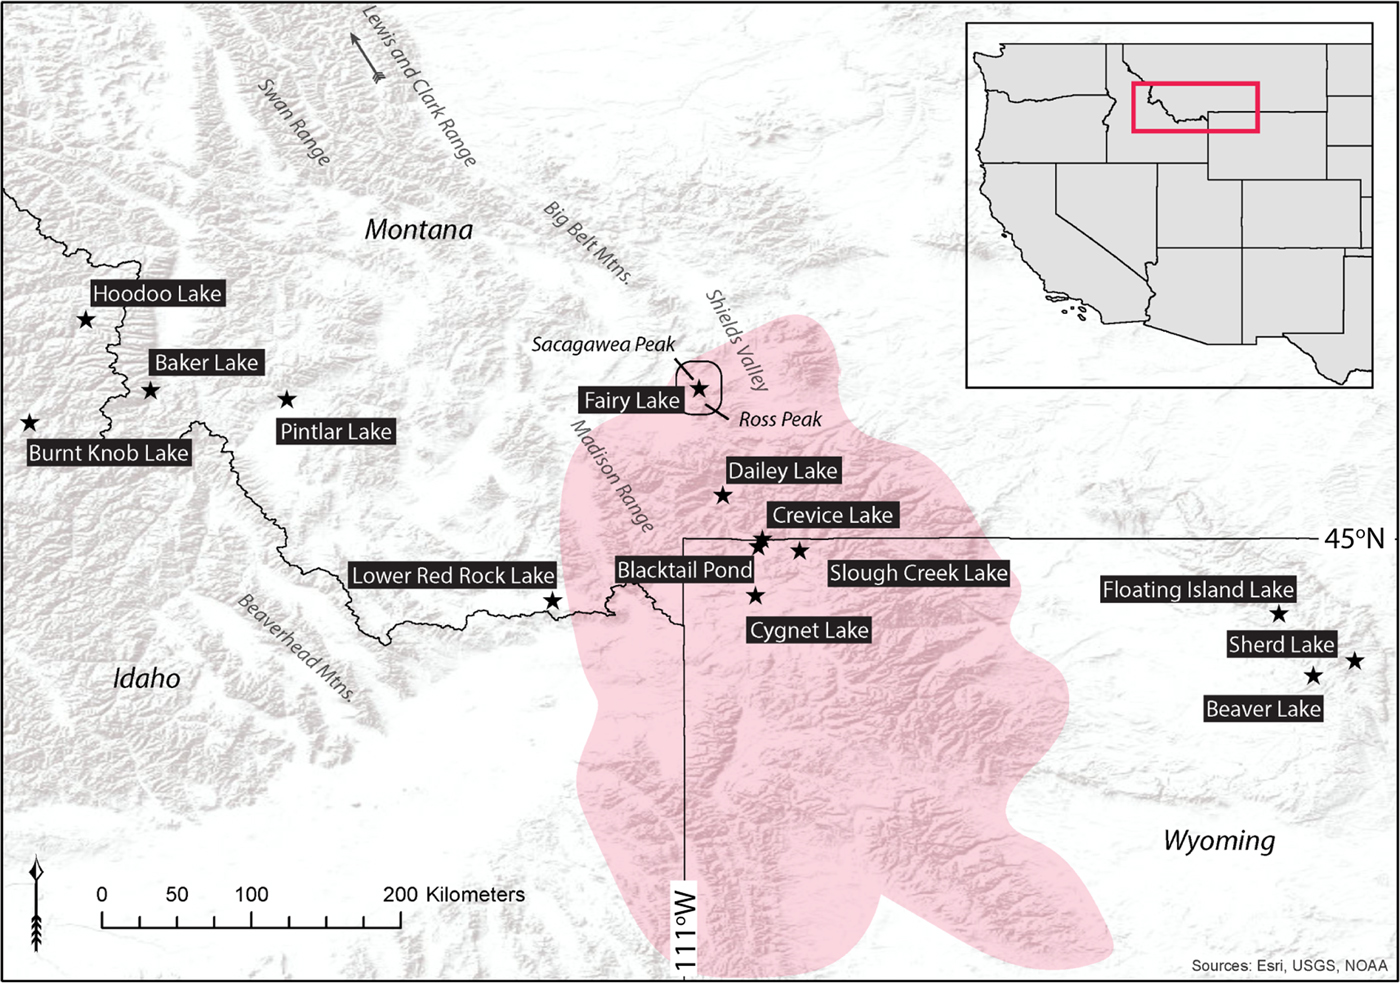
In this study, we describe a high-elevation record from Fairy Lake in the Bridger Range of the northern GYE (45.904 N, 110.958 W, 2308 m elev, 4 ha, 12 m water depth), with the following objectives: (1) reconstruct the postglacial vegetation, fire, and avalanche history of the Bridger Range; (2) assess the environmental dynamics of the northern GYE across an elevation gradient based on several records; and (3) compare the high-elevation history of the Bridger Range with high-elevation Rocky Mountain settings to the east and west to examine geographic differences in the response to past climate change. Our objectives were to provide new information about the postglacial history of an isolated mountain range and contribute to a broader understanding of the long-term vegetation and fire dynamics of the northern Rocky Mountains.
The Bridger Range is a northwest-trending mountain chain that stretches for approximately 40 km in southwestern Montana. Fairy Lake lies in a glacial scour basin on the east side of the highest mountain, Sacagawea Peak (2948 m elev; Fig. 1). The lake is fed by surface flow and a small spring-fed stream, and drained by a small outlet stream, Fairy Creek. The bathymetry is generally conical and 12 m deep in the central area. Watershed geology consists of interbedded shale, siltstone, calcareous sandstones, and basal conglomerates of the Jurassic Ellis Group, along with shales and mudstone of the Jurassic Morrison Formation (McMannis, Reference McMannis1955). The Mississippian-Pennsylvanian Amsden Formation forms red cliffs on the southwest side. The Bridger Range was partially glaciated during the late Pleistocene (McMannis, Reference McMannis1955). Although the timing of the last glaciation in the Bridger Range is not known, it likely coincided with late Pinedale Glaciation in the northern YNP region, which reached its maximum extent at ca. 17.9 ka (Licciardi and Pierce, Reference Licciardi and Pierce2018).
Map of study area, showing sites discussed in text. The circle with Fairy Lake in the center demarcates the Bridger Range. Red shading indicates the Greater Yellowstone Ecosystem (GYE). (For interpretation of the references to color in this figure legend, the reader is referred to the web version of this article.)

Average maximum summer (June–August) temperature from 1981–2010 is 18.4°C, with an average minimum of 5.3°C. Average maximum winter (December–March) temperature is -2.3°C, and the average minimum is -10.8°C (PRISM Climate Group, 2015). In the Bridger Range, annual precipitation from 1981–2010 ranged from 127–152 cm at elevations of ~1800–2400 m to 51–61 cm at elevations of ~1500–1800 m (PRISM Climate Group, 2015). The ratio of June–August (JJA) to December–February (DJF) precipitation is 1.34, but most precipitation is received in April–June.
Present-day vegetation in the Bridger Range varies by elevation and aspect. On the eastern flank, lower tree line lies at ~1800 m elev and upper tree line is located at ~2530 m elev. On the western side, lower tree line is similar while upper tree line is higher in elevation (~1750 and 2650 m, respectively). Open forests at low elevations are composed of Pinus flexilis, Pinus contorta, and Pseudotsuga menziesii, with some Juniperus scopulorum and J. communis. At higher elevations and in mesic settings, forests are dominated by Picea engelmannii, Abies lasiocarpa, P. flexilis, and Pinus albicaulis with some J. communis (Pfister et al., Reference Pfister, Kovalchik, Arno and Presby1977). Upper tree line consists of krummholz patches of J. communis, P. flexilis, and P. albicaulis.
The Fairy Lake watershed supports a mixed forest of high- and low-elevation conifers, with Abies, Picea, and Pinus contorta as forest dominants near the lake, Juniperus communis in the understory, Pinus flexilis at higher elevations, and Pseudotsuga on south-facing slopes. Understory shrubs include Rosa woodsii, Shepherdia canadensis, Amelanchier alnifolia, Vaccinium scoparium, and Symphoricarpos albus as well as diverse herbs, including members of the Asteraceae, Rosaceae, Ranunculaceae, Apiaceae, Fabaceae, Polygonaceae, and Geraniaceae families. The west slope below the lake supports areas of Artemisia tridentata steppe. Alnus viridis, Salix spp., and Acer incana grow in wet areas, and Carex, Typha, and Equisetum are present along the lake margin. The fire regime in these subalpine forests is characterized by infrequent, stand-replacing fires (fire-free intervals of 200 yr or more), although frequent low-intensity fires occur in open Pseudotsuga forests and steppe (Baker, Reference Baker2009).
Humans have been present in the northern GYE since the late-glacial period (Rasmussen et al., Reference Rasmussen, Anzick, Waters, Skoglund, DeGiorgio, Stafford, Rasmussen, Moltke, Albrechtsen, Doyle and Poznik2014). Archaeological findings, including lithics and stone cairns, indicate regular use of the Bridger Range for hunting, gathering, and food processing (Byers et al., Reference Byers, Allen, Fisher, Kornfeld and Osborn2003). Stone tools in the Fairy Lake watershed are associated with Pelican Lake projectile point styles (ca. 3000–1500 BP; MacDonald, Reference MacDonald2012). The Bridger Range itself was visited on a transient and seasonal basis before European settlement. Seasonal or year-round settlements were likely present at low elevations in the late Holocene, although none have been reported to date (Byers et al., Reference Byers, Allen, Fisher, Kornfeld and Osborn2003, Fisher et al., Reference Fisher, Dudley and Donahoe2016).
METHODS
Field
In July 2013, three overlapping sediment cores (13A, B, and C) were obtained from Fairy Lake using a modified Livingstone square-rod sampler (Wright et al., Reference Wright, Mann and Glaser1983) from an anchored platform. The cores were taken from the deepest central portion of the lake (12 m deep). The uppermost sediment, including the mud-water interface, was collected in a short core that was extruded at 1-cm increments in the field. The long cores were wrapped in plastic, transported to the Montana State University (MSU) Paleoecology Lab, and stored under refrigeration. Core 13C was the most complete core (i.e., no gaps in coverage) and used for analysis.
Lithologic analysis
Cores were taken to the LacCore National Lacustrine Core Facility at the University of Minnesota, Minneapolis, where they were split, photographed, and described. Core imaging was performed with a DMT CoreScan Colour and Geotek Geoscan-III at 0.001-cm resolution (~254 dpi) to generate a color profile of the sediment. By use of a Geotek XYZ MSCL logger, magnetic susceptibility was measured in SI units at 0.5-cm intervals. Magnetic susceptibility provides information on mineral clastic input into the lake (Gedye et al., Reference Gedye, Jones, Tinner, Ammann and Oldfield2000). The organic and carbonate content of the sediment was determined through sequential loss-on-ignition of 1-cm3 samples taken at 8-cm intervals (Dean, Reference Dean1974). Red sediment layers were identified by their color intensity (in the color profile) and above-the-mean MS values. Mineralogic analysis revealed that the red layers in the cores are derived from the Amsden Formation, which outcrops above the lake in the southwestern portion of the watershed (Bodalski and Michaels, Montana State University, written commun., 2014).
Chronology
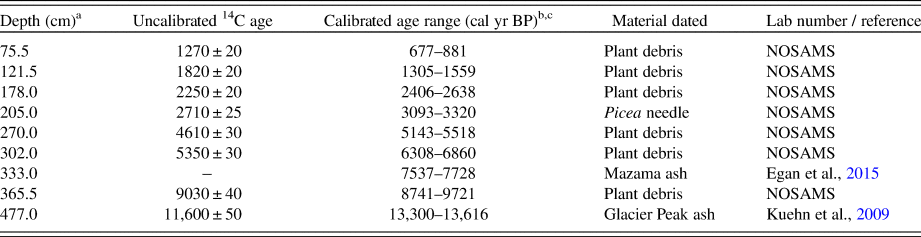
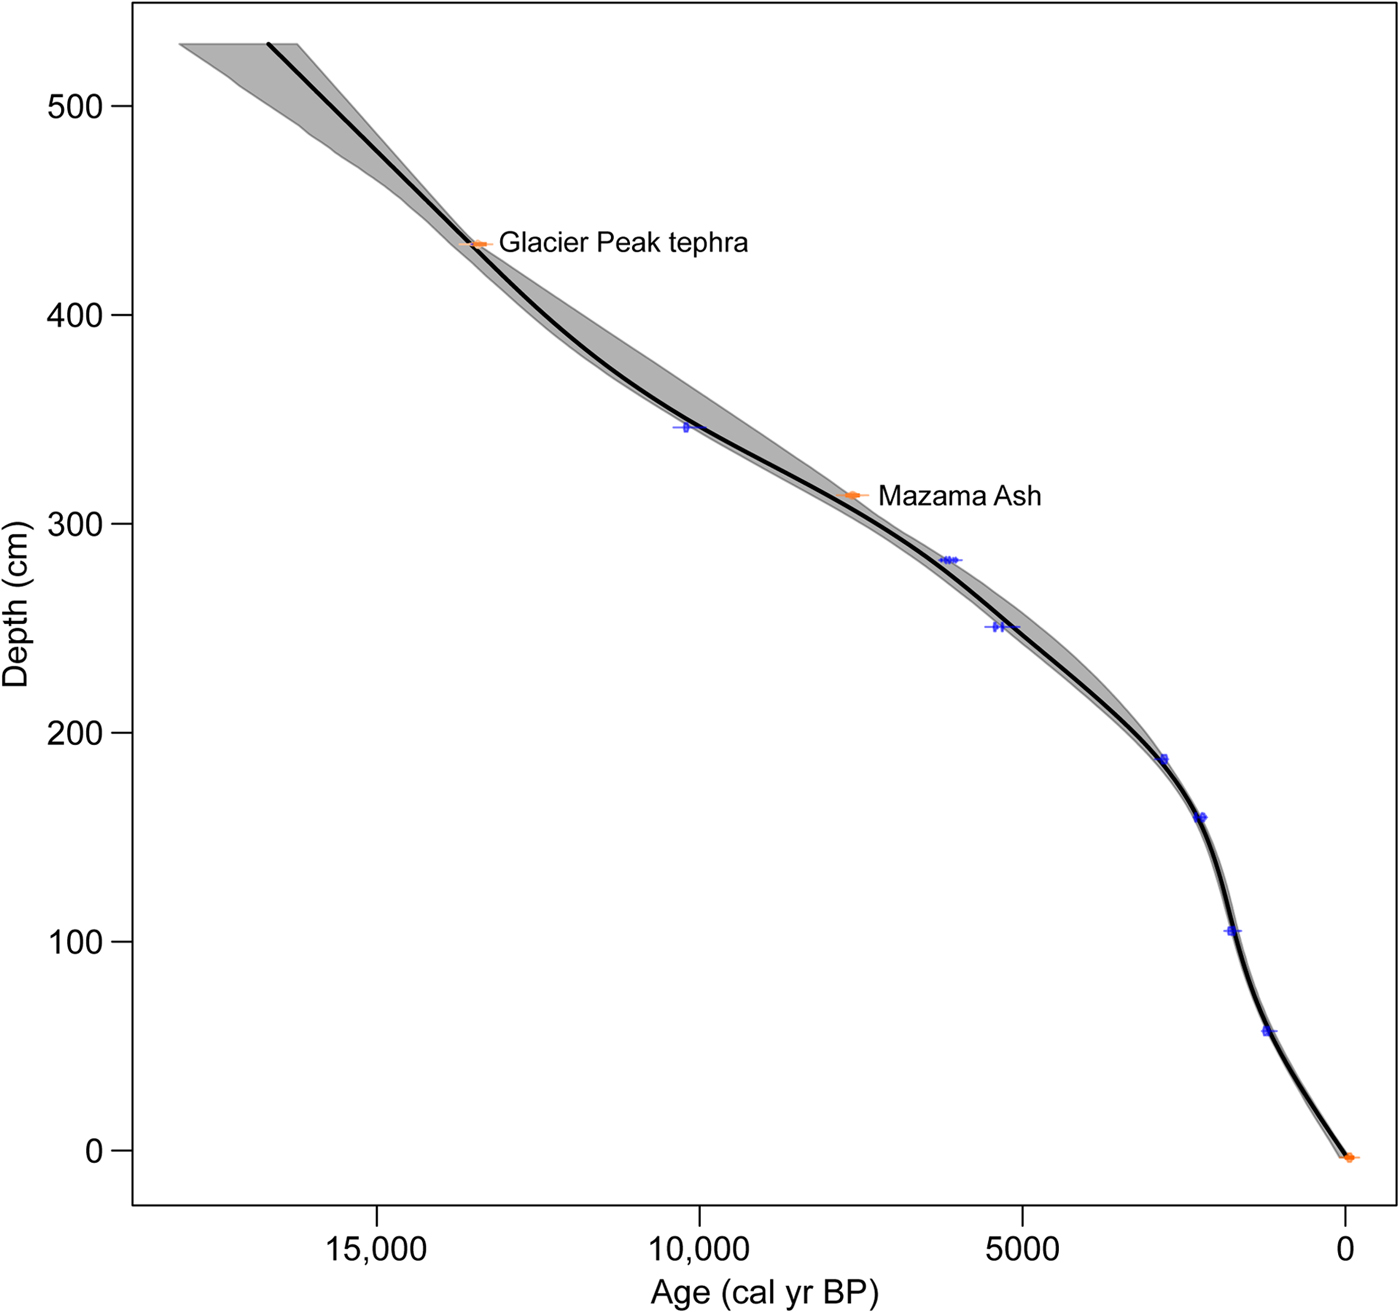
Seven terrestrial plant macrofossils were submitted for AMS radiocarbon dating to the National Ocean Sciences Accelerator Mass Spectrometry facility (Table 1). AMS 14C dates were calibrated with the IntCal13 calibration curve (Reimer et al., Reference Reimer, Bard, Bayliss, Beck, Blackwell, Bronk Ramsey and Buck2013). The chronology of the Fairy Lake core was developed by modeling depth as a function of the calibrated radiocarbon ages and known ages of two tephra at 333 and 477 cm depth. Mineralogic analyses identified the tephra layers as Mazama Ash (7633 ± 49 cal yr BP; Egan et al., Reference Egan, Staff and Blackford2015) and Glacier Peak tephra (13,599 ± 95 cal yr BP; Kuehn et al., Reference Kuehn, Froese, Carrara, Franklin, Pearce and Rotheisler2009). An age-depth model was constructed with smoothing splines (smoothing parameter = 0.5) and a resampling approach that allowed each date to influence the model through the probability density function of the calibrated age (Blaauw, Reference Blaauw2010).
Radiocarbon samples for Fairy Lake. NOSAMS, National Ocean Sciences Accelerator Mass Spectrometry facility

a Depth below mud surface
b 14C ages derived from CALIB IntCal13 calibration curves ( Reimer et al., Reference Reimer, Bard, Bayliss, Beck, Blackwell, Bronk Ramsey and Buck2013 ). Calibrated range is based on two sigma range
c AMS radiocarbon dates obtained from NOSAMS
Pollen analysis
Samples of 0.5 cm3 were taken at 4- to 16-cm intervals for pollen analysis, following procedures in Bennett and Willis (Reference Bennett, Willis, Smol, Birks and Last2001). Pollen grains were identified at magnifications of 400 and 1000×, and ~300 terrestrial pollen grains were counted per sample. Terrestrial pollen and fern spore percentages were calculated as a proportion of the total terrestrial sum, and aquatic taxa percentages were based on a sum of total pollen and spores. Pollen concentration (grains/cm3) and pollen accumulation rates (PAR; grains/cm2/yr) were calculated after adding a known concentration of an exotic tracer (Lycopodium spores) to each sample (Bennett and Willis, Reference Bennett, Willis, Smol, Birks and Last2001).
Pollen grains were identified using the reference collection housed at the MSU Paleoecology Lab, as well as pollen identification keys and atlases (e.g., McAndrews et al., Reference McAndrews, Berti and Norris1973; Moore and Webb, Reference Moore and Webb1978; Kapp et al., Reference Kapp, Davis and King2000). In this study, Pinus subg. Strobus pollen is attributed to Pinus flexilis and/or Pinus albicaulis and we refer to it as P. flexilis/albicaulis. Pinus subg. Pinus pollen was likely from Pinus contorta, and we refer to the pollen type as Pinus contorta-type. Pinus pollen grains that were damaged or had missing distal membranes were classified as Pinus undifferentiated. The ratio of Pinus subg. Strobus to Pinus subg. Pinus (referred to as the Pinus subg. Strobus/Pinus ratio) in the identifiable Pinus pollen fraction was then applied to the total pine pollen in a given level to infer relative abundance of the two types.
Pseudotsuga and Larix pollen grains are indistinguishable, but given that Larix does not presently grow in the Bridger Range, this pollen type was referred to as Pseudotsuga-type. Juniperus-type pollen is attributed to J. communis, J. scopulorum, and possibly J. horizontalis. The category “Total Rosaceae” includes pollen identified as Rosaceae undifferentiated, Amelanchier-type, Spiraea-type, and Prunus-type. “Other Amaranthaceae” refers to pollen types in the family other than Sarcobatus vermiculatus. The category “Other Herbs” includes pollen types that also had no discernable stratigraphy, including, Arceuthobium, Galium, Onagraceae, Ranunculaceae (including Thalictrum), Caryophyllaceae, Fabaceae, Polygonaceae (including Polygonum and Eriogonum), and Apiaceae, as well as Selaginella densa-type spores. Aquatic taxa with no distinctive stratigraphy were grouped into a category called “Other Aquatics” that included Myriophyllum, Equisetum, Utricularia, and Typha latifolia. The full dataset is available in the Neotoma Paleoecology Database (http://neotomadb.org).
The squared-chord distance (SCD) between every sample and the youngest sample of the record was calculated and plotted as a function of time. The resulting series provides an overall trend in vegetation development as well as sample-to-sample variability. Sequential Lepage testing was then applied to the time series to assess the presence of changes in the mean SCD of consecutive 3-sample sequences without making any assumptions about the distribution of the samples (Lepage, Reference Lepage1971). The test allows identification of abrupt and statistically significant changes in community composition (P < 0.05).
Comparison of pollen records from sites in the northern GYE and across the northern Rocky Mountains focused on an examination of trends in total arboreal Picea and Pseudotsuga-type pollen as indicators of overall forest cover and changes in upper and lower tree line composition through time. The northern GYE reconstruction was based on smoothed pollen data from two sites at low elevation (1601–1695 m elev), two at middle elevation (2017–2070 m elev), and Fairy Lake at high elevation (2308 m elev). The smoothing was performed with a moving median (600-yr window). The uppermost sediment in the short core pollen record provided information on the modern pollen rain.
For the northern Rocky Mountains comparison, median pollen percentages were plotted for high-elevation sites from regions west and east of Fairy Lake as a function of time. Pollen data were interpolated to the median resolution of all sites prior to the analysis to avoid overrepresentation of the best-resolved records. In all cases, standard deviations provide a measure of the uncertainty of the reconstructions. All analyses were performed and figures were made with R programming language (R Core Team, 2017), using packages cpm (Ross, Reference Ross2015), mgcv (Wood et. al., Reference Wood, Pya and Saefken2016), and tidyverse (Wickham, Reference Wickham2017).
Charcoal analysis
A local high-resolution reconstruction of fire was obtained from 2-cm3 samples taken at contiguous 0.5-cm intervals through the core and subjected to standard processing methods (Whitlock and Larsen, Reference Whitlock, Larsen, Smol, Birks and Last2001). The fire history was developed with CharAnalysis software (Higuera et al., Reference Higuera, Brubaker, Anderson, Hu and Brown2009). Charcoal accumulation rates (CHAR, particles/cm2/yr) were calculated by dividing the charcoal concentration by the deposition time for each sample. A 750-yr LOWESS smoother robust to outliers was used to decompose the CHAR record into a slowly varying component (background CHAR = BCHAR) and high frequency variability (i.e., positive residuals of the model). BCHAR is generally considered to be a record of area burned or biomass burning within a 20–25 km radius of the site (Higuera et al., Reference Higuera, Brubaker, Anderson, Hu and Brown2009, Reference Higuera, Whitlock and Gage2010). Gaussian mixed models were fit to the positive residuals of the LOWESS model at 750-yr windows to identify local departures from the mean. Values that exceeded the 95th percentile of the distribution (i.e., charcoal peaks) were tested for significance with a Poisson distribution (P < 0.05). The window size was defined by maximizing the signal-to-noise ratio. Charcoal peaks represent individual fire episodes (i.e., one or more fires occurring during the sampling interval) within a 1–3 km radius of the lake (Higuera et al., Reference Higuera, Brubaker, Anderson, Hu and Brown2009, Reference Higuera, Whitlock and Gage2010). Fire-episode trends were summarized as fire-episode frequency as a function of time (episodes/1000 yr). BCHAR was minmax-transformed for the northern GYE sites to allow comparison among records.
RESULTS
Lithology and chronology
The Fairy Lake core spans the last 15,000 cal yr (min 95% = 15,800 cal yr BP, max 95% = 14,160 cal yr BP) based on extrapolation of the age-depth model. The age-depth model indicates no abrupt changes in sediment deposition, and sediment accumulation rates ranged from 33/cm2/yr at ca. 13,800 cal yr BP to 61/cm2/yr at ca. 9000 cal yr BP and with an average of 20/cm2/yr in the last 4000 yr (Fig. 2).
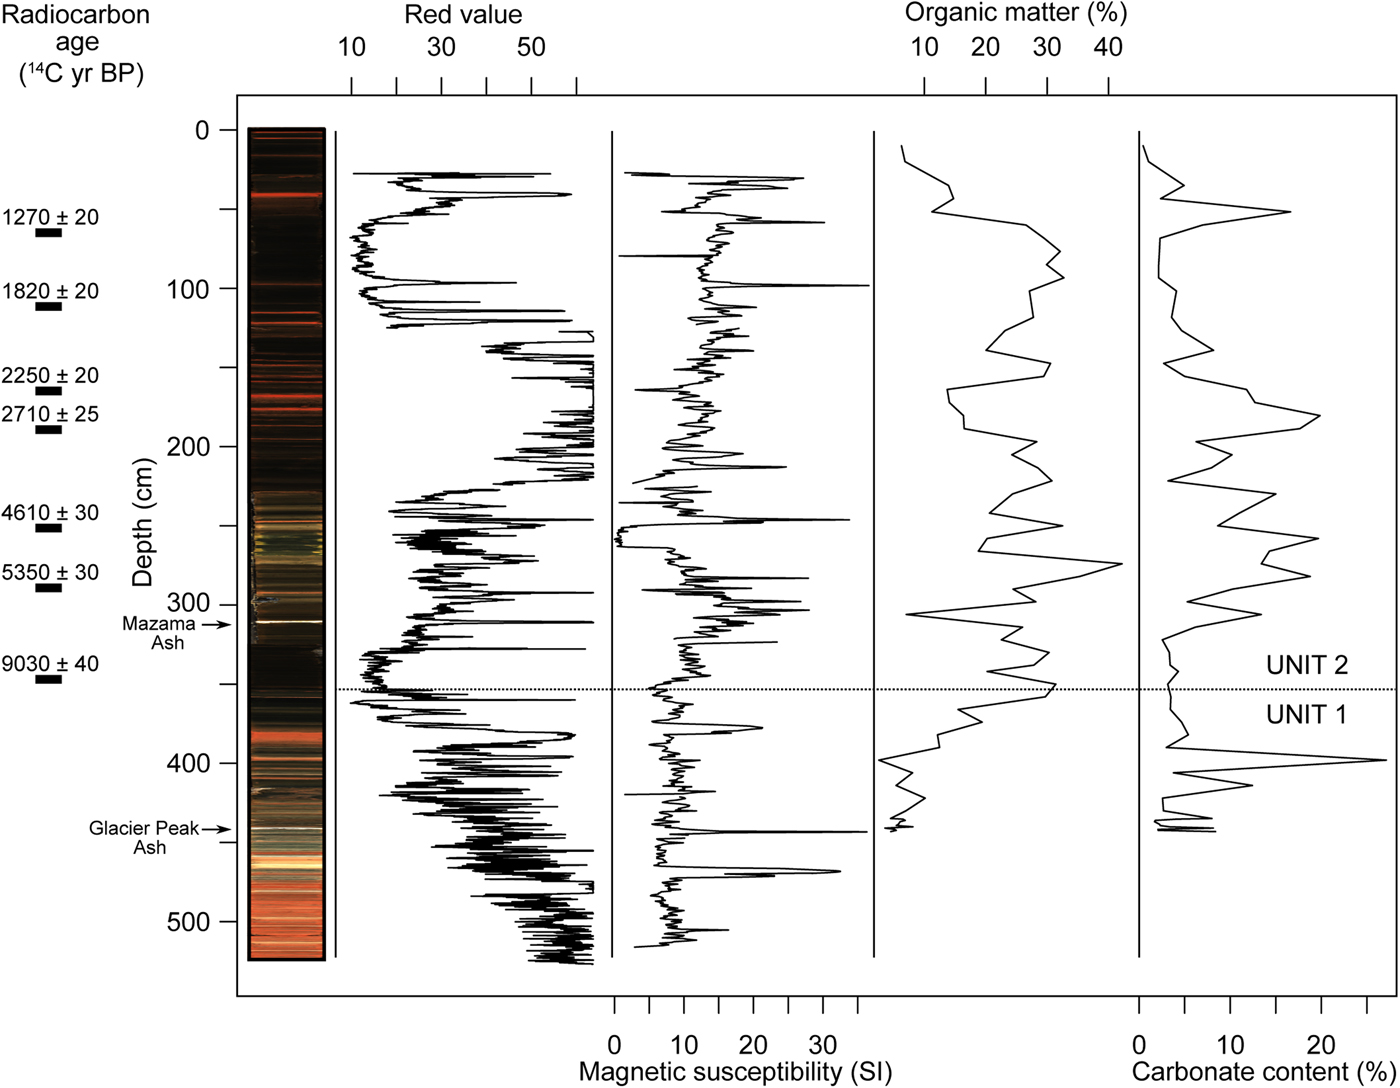
(color online) Lithology, red-value intensity, magnetic susceptibility (SI), carbonate content (%), and organic matter (%) from Fairy Lake. Lithological units 1 and 2 are shown. The black rectangles represent 14C dates.

Two lithologic units were identified in the core (Fig. 3). Unit 1 (535–351 cm depth; 15,510–10,590 cal yr BP) was composed of gray and pink clay with several red clay layers. The red clay layers are attributed to the Amsden Formation, which outcrops above the lake in a well-defined avalanche basin. We interpret deposition of these layers to periods of pronounced avalanche activity or similar mass-wasting events that transported Amsden sediment to the lake. The thickest red layer was present between 385 and 374 cm depth (ca. 11,400 cal yr BP). The organic content in Unit 1 was 3–14%, and the carbonate content ranged from 2–27%. Magnetic susceptibility was between 1.1 and 128.4 (SI units), with higher values towards the base, indicating high allochthonous inorganic input in the early part of the record. A tephra layer at 437–436.5 cm depth was assigned to the late-glacial eruption of Glacier Peak (Bodalski and Michaels, Montana State University, written commun., 2014).
Age-depth model for Fairy Lake. 95% confidence intervals are shown in gray. The distributions of the calibrated ages employed in the development of the chronology are shown in purple and orange (samples submitted for 14C analysis and published ages of tephra deposition, respectively). (For interpretation of the references to color in this figure legend, the reader is referred to the web version of this article.)

Unit 2 (351–0 cm depth; 10,590 cal yr BP–present) was composed of brown fine-detritus gyttja that was moderately organic (20–42% organic content) below 55 cm depth, and less organic (<15%) above that level (Fig. 3). The carbonate content was 2–20% with highest values between 275 and 150 cm depth (ca. 5500–2000 cal yr BP). Red clay layers were also present in this unit and most frequent between 200–100 cm depth (ca. 4500–2000 cal yr BP), including a thick red layer at ~27 cm depth (ca. 700 cal yr BP). Magnetic susceptibility values were between 0 and 36.6 (SI units), and a tephra layer at 318–317 cm depth was identified as Mazama Ash (Bodalski and Michaels, Montana State University, written commun., 2014).
Pollen and charcoal
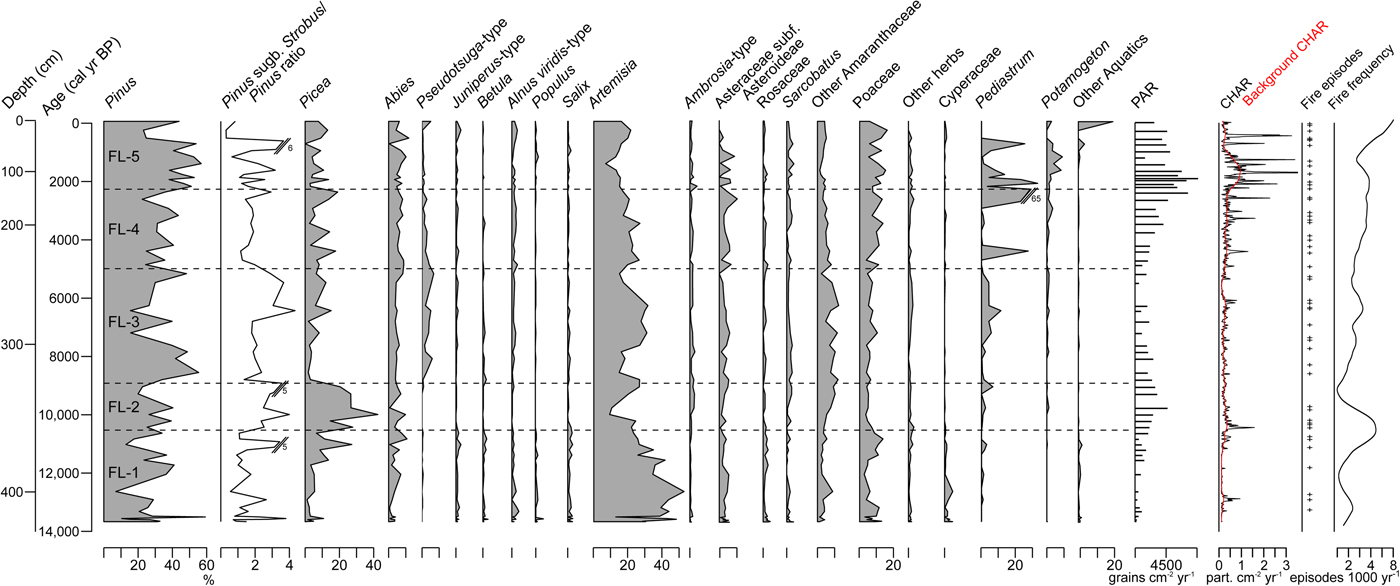
Five pollen zones were identified using CONISS (Grimm, Reference Grimm, Huntley and Webb1988) to describe the Fairy Lake record (Fig. 4). Zone FL-1 (433–353 cm depth; 13,670–10,530 cal yr BP) is dominated by non-arboreal pollen taxa, notably Artemisia (13–53%), Poaceae (3–14%), and herbaceous taxa (Other Asteraceae [ < 4%], Cyperaceae [ < 5%], and Amaranthaceae [ < 6%]). Pinus accounts for 10–67% with high Pinus subgenus Strobus/Pinus ratios (up to 2.8), pointing to the dominance of Pinus flexilis or Pinus albicaulis. Picea (<27%), Abies (<11%), and Juniperus-type (<2%) are present in low but steady percentages. Similarly, Alnus viridis-type, Salix, Populus, and Betula pollen each have values of 2–6%, suggesting a deciduous shrub component. PAR ranges between 400 and 1500 grains/cm2/yr, matching values found in modern shrub tundra or subalpine parkland (Fall, Reference Fall1992). CHAR and fire-episode frequency are low (0–1 particles/cm2/yr; 2–6 episodes/1000 yr), indicating few fires. The assemblage suggests a tundra or steppe with scattered trees and shrubs, and high SCDs indicate that the vegetation was substantially different from present (Fig. 5).
(color online) Pollen percentage, total pollen accumulation rates, and charcoal data from Fairy Lake (ka BP= 1000 cal yr BP). Entire pollen data set is available at Neotoma.org.

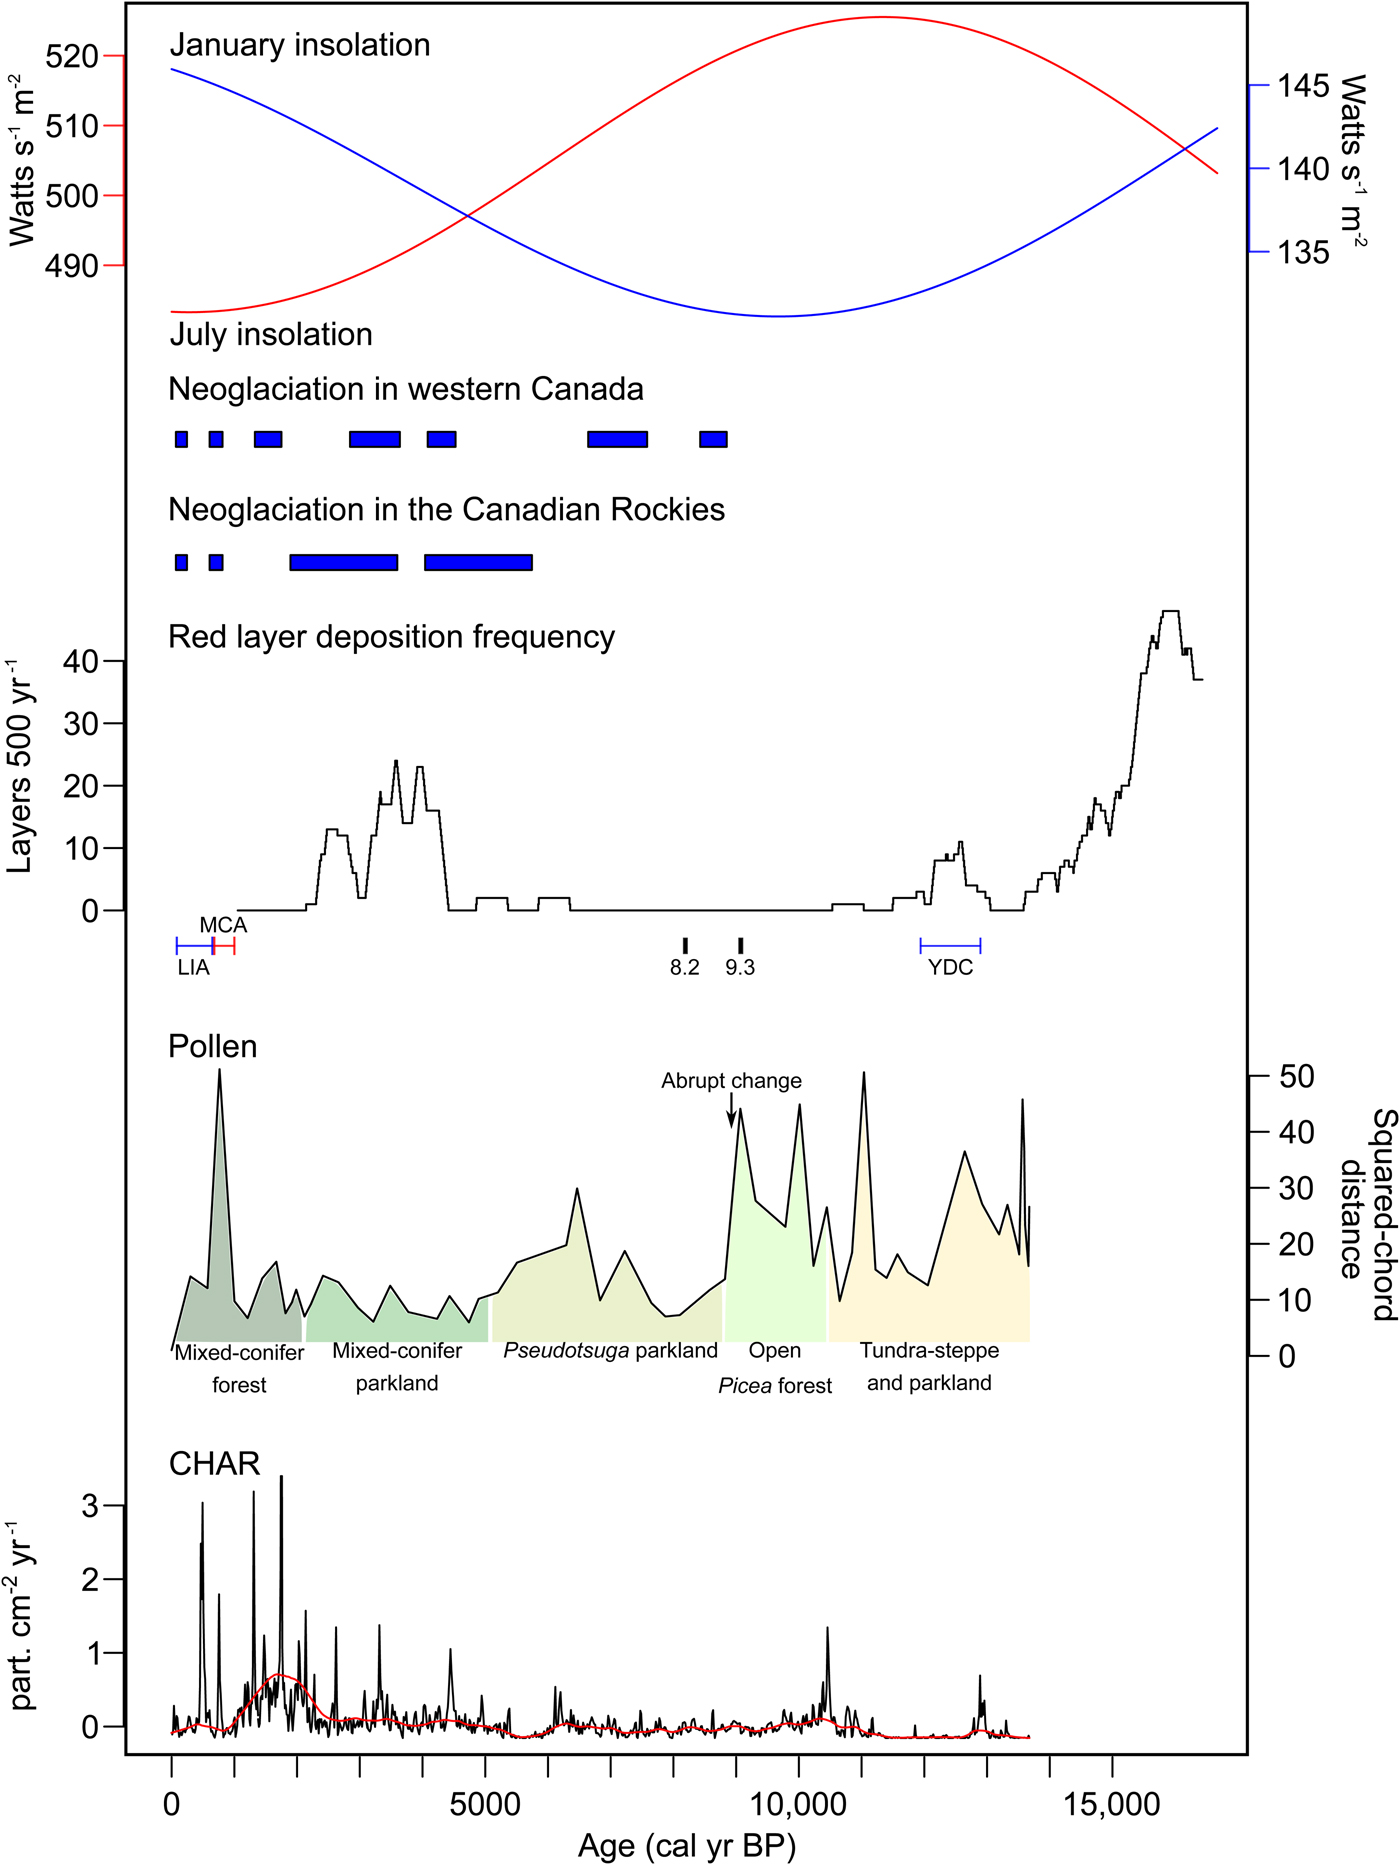
Comparison of Fairy Lake results with other paleoenvironmental data: January and July insolation at lat. 44°N (Berger and Loutre, Reference Berger and Loutre1991); Neoglaciation in western Canada and in the Canadian Rockies (Menounos et al., Reference Menounos, Osborn, Clague and Luckman2009); red layer deposition frequency at Fairy Lake (layers 500/yr); vegetation trajectory at Fairy Lake as inferred from squared-chord distances between each sample and the youngest sample of the record (abrupt change in vegetation composition, identified through sequential Lepage testing, is shown); and charcoal accumulation rates (CHAR) at Fairy Lake (background charcoal [BCHA] is shown in red). Major climate events are noted as follows: YDC, Younger Dryas chronozone (12,900–11,500 cal yr BP; Alley, Reference Alley2000); 9.3, 9.3 ka event (Yu et al., Reference Yu, Colman, Lowell, Milne, Fisher, Breckenridge, Boyd and Teller2010); 8.2, 8.2 ka event (Thomas et al., Reference Thomas, Wolff, Mulvaney, Steffensen, Johnsen, Arrowsmith, White, Vaughn and Popp2007); MCA, Medieval Climate Anomaly in the Greater Yellowstone Ecosystem (GYE; Meyer et al., Reference Meyer, Wells, Stephen and Timothy Jull1995); and LIA, Little Ice Age in GYE (Meyer et al., Reference Meyer, Wells, Stephen and Timothy Jull1995). (For interpretation of the references to color in this figure legend, the reader is referred to the web version of this article.)

Zone FL-2 (353–325 cm depth; 10,530–9200 cal yr BP) shows a strong increase in arboreal pollen (>50%). Picea (15–42%) and Pinus (19–40%) have high percentages, and Abies is present in steady levels of <10%. The Pinus subg. Strobus/Pinus ratio (3–6) increases as a result of a higher abundance of Pinus flexilis /albicaulis. Artemisia decreases (10–27%), and Amaranthaceae (4–10%), and Ambrosia-type (1–3%) increase. CHAR is low (mean = 0.34 particles/cm2/yr), except for an initial increase to ~2 particles/cm2/yr and fire frequency decreases from six episodes/1000 yr at the beginning of the zone to one episode/1000 yr at the end. The initial increase in fires is likely the result of more fuel biomass associated with larger populations of Abies and Picea. PAR ranges from 1771–5700 grains/cm2/yr, matching modern open subalpine forest (Fall, Reference Fall1992), but SCD values are similar to those of the previous zone and indicate that the vegetation was still different from present day.
Zone FL-3 (325–243 cm depth; 9200–5010 cal yr BP) consists mainly of arboreal pollen (>50%), with increased values of Pinus (34–55%) and Pseudotsuga-type (1–6%). The beginning of the zone shows increases in Pinus (42–48%), Pseudotsuga-type (1–6%), and lower levels of Artemisia (15–17%), Poaceae (4–5%), and Other Herbs (0–1%). Picea (2–4%) and Abies (4–5%) decrease in abundance from Zone FL-2. Pinus subg. Strobus/Pinus ratios (1–4%) decrease, indicating greater abundance of Pinus contorta-type. Artemisia pollen is present at ~30%, Poaceae ranges from 6–10%, Alnus is 1–2%, Shrubs are 3–4%, and Other Herbs are <2%. This pollen assemblage suggests a parkland of Pinus and Pseudotsuga, with areas of steppe and meadow. CHAR is slightly elevated compared with previous zones (0.5–1 particles/cm2/yr), and fire frequency is one to four episodes/1000 yr (mostly three to four episodes/1000 yr), indicating frequent but small fires. PAR values of 820–2020 grains/cm2/yr are consistent with open vegetation (Fall, Reference Fall1992). A pronounced decline in SCD at the beginning of the zone suggests an abrupt change in vegetation composition (Fig. 5), and the vegetation likely became more open than before.
Zone FL-4 (243–154 cm depth; 5010–2260 cal yr BP) features increased percentages of Abies (5–9%) and Picea (3–19%) and decreases in Pseudotsuga-type (1–3%) and Pinus (22–43%). Pinus subg. Strobus/Pinus ratios (1–3%) are lower than before, reflecting an increase in Pinus contorta-type. Shrubs (2–6%), Alnus (1–3%), Poaceae (4–14%), and Asteraceae subfamily Asteroideae (1–5%) increase from the previous zone and Artemisia (17–27%) remains present at intermediate values. CHAR is higher than before (1–2 particles/cm2/yr) and fire frequency increases to three to five episodes/1000 yr. PAR ranges from 1770–3150 grains/cm2/yr and suggests a mixed-conifer parkland (Fall, Reference Fall1992). Lower-than-before SCDs indicate that the vegetation was becoming more like present.
Zone FL-5 (154–0 cm depth; 2260–65 cal yr BP) has total arboreal percentages from 49–70%. Pinus (23–57%), Abies (~1–12%), and Picea (~1–13%) increases in abundance. Pseudotsuga-type values are low (~1%), although rise to ~5% at the top of the zone. Pinus subg. Strobus/Pinus ratios (~1–3%) are initially similar to previous levels but increase between ca. 1600 and 1400 cal yr BP, indicating more Pinus flexilis/albicaulis. Artemisia (7–22%) and Asteraceae subfamily Asteroideae (~1–4%) decrease and Poaceae (6–16%) increases slightly from the previous zone. This zone marks the establishment of the present-day mixed-conifer forest. CHAR (1–4 particles/cm2/yr) and fire frequency (3–8 episodes/1000 yr) are highest, indicating more fire activity. PAR ranges from 1428–1973 grains/cm2/yr, which is consistent with modern forest environments (Fall, Reference Fall1992). No significant changes in SCDs are observed with respect to the previous zone.
DISCUSSION
Environmental history at Fairy Lake
The modeled basal age of Fairy Lake suggests that the Bridger Range was nearly ice-free by ca. 15,000 cal yr BP, which postdates the timing of deglaciation at middle and high elevations on the Yellowstone Plateau to the south ca. 17,900 ka (Licciardi and Pierce, Reference Licciardi and Pierce2018). The pollen data suggest a dominance of shrubs and herbs, including Artemisia, Juniperus-type, Betula, Alnus viridis-type, Salix, and Poaceae. Steady but low percentages of Pinus (both Pinus flexilis/albicaulis and Pinus contorta-type), Picea, and Abies in Zone FL-1 (Fig. 4) imply that conifers grew in the region soon after deglaciation and slowly expanded upslope as the climate warmed. High SCD values indicate substantially different plant communities than at present (Fig. 5). The low abundance of conifer pollen suggests that the region was largely covered by tundra-steppe or parkland with scattered trees until ca. 11,500 cal yr BP.
The inorganic sediments at Fairy Lake are consistent with an unproductive lake and poor soil development prior to ca. 10,600 cal yr BP. The basal sediments include numerous red clay layers that are interpreted as evidence of past avalanche activity or similar snow-related mass-wasting events. Recent studies in the region attribute high avalanche activity to periods of positive snow water equivalent anomalies that result from frequent Pacific storms in winter and early spring (Reardon et al., Reference Reardon, Pederson, Caruso and Fagre2008). Avalanches and snow mass-wasting events occur during times of high winter precipitation and also when snow transitions to rain in early spring (Reardon et al., Reference Reardon, Pederson, Caruso and Fagre2008). The high frequency of the layers in the early late-glacial period suggests that rising temperatures led to particularly unstable snow conditions.
The increase in conifer pollen at the beginning of Zone FL-2 marks the development of an open forest of Picea with low amounts of Pinus flexilis/albicaulis and Abies between ca. 10,500 and 9000 cal yr BP. At this time, upper tree line was likely higher than today in the Bridger Range, as evidenced by the relatively high abundance of Picea pollen at the site (Fig. 4). Percentages of Artemisia, Sarcobatus, Other Amaranthaceae, Ambrosia-type, and Asteraceae sub. Asteroideae at Fairy Lake persisted in relatively high abundance during the late-glacial and early Holocene (Fig. 4), indicating the presence of steppe vegetation at lower elevations and on south-facing slopes. In general, high SCD values suggest that vegetation was strongly dissimilar to present, as registered by the dominance of Picea pollen and poor representation of other conifer types compared to the modern pollen assemblage (Fig. 5). CHAR levels and fire frequency were higher than before, indicating more fire activity in association with the expansion of forest (Fig. 5). Increased limnic production after 10,500 cal yr BP is evidenced by a rise in organic content. The absence of red layers suggests little avalanche activity or snow-related mass-wasting events (Fig. 5).
The transition from Zone FL-2 to Zone FL-3 marks an abrupt change at ca. 9200 cal yr BP from an open Picea forest to a parkland dominated by Pinus (both Pinus contorta and Pinus flexilis and/or Pinus albicaulis) and Pseudotsuga (Fig. 4). Increasing percentages of Artemisia, Juniperus-type, Shepherdia canadensis, Rosaceae, Asteraceae subg. Asteroideae, Sarcobatus, Other Amaranthaceae, Ambrosia-type, and Other Herb pollen types between ca. 9200 and 5000 cal yr BP indicate more-open vegetation than before. CHAR was slightly higher than before but with few charcoal peaks, suggesting mostly frequent, small fires (Whitlock and Larsen, Reference Whitlock, Larsen, Smol, Birks and Last2001). The core lithology features increased organic and carbonate content relative to previous periods, suggesting greater lake production (Meyers and Ishwatari, Reference Meyers and Ishiwatari1993). The lack of red layers indicates negligible avalanche activity or other snow-related mass-wasting events (Fig. 5). Overall, the pollen, charcoal, and lithologic records imply warmer conditions in the middle Holocene than before.
The abrupt timing of this zone boundary may have been triggered by a regional climate event. Evidence of a severe drought is noted at Kettle Lake, North Dakota and other sites across the northern Great Plains at 9200–9300 cal yr BP (Grimm et al., Reference Grimm, Donovan and Brown2011). It also coincides with an abrupt decline in biogenic silica and a shift in chironomid assemblages in southern British Columbia (Gavin et al., Reference Gavin, Henderson, Westover, Fritz, Walker, Leng and Hu2011). These transitions have been attributed to a 9.3-ka cold event detected in Greenland ice cores and at various sites in the North Atlantic (Marshall et al., Reference Marshall, Lang, Crowley, Graham, van Calsteren, Fisher and Holme2007; Fleitmann et al., Reference Fleitmann, Mudelsee, Burns, Bradley, Kramers and Matter2008; Axford et al., Reference Axford, Briner, Miller and Francis2009). The interpretation is that a decrease in sea-surface temperature was possibly triggered by the release of a surge of freshwater from Lake Superior to the North Atlantic (Yu et al., Reference Yu, Colman, Lowell, Milne, Fisher, Breckenridge, Boyd and Teller2010). So far, the occurrence of an abrupt change at 9.3 ka is registered at only a few sites in the western United States. and there is no consistent direction of climate change among records.
The Fairy Lake pollen record shows decreased Pseudotsuga-type and Artemisia pollen and increased Poaceae, Pinus (mostly Pinus contorta-type), Picea, and Abies pollen after ca. 5000 cal yr BP (Zone FL-4; Fig. 4). The shift marks establishment of mixed-conifer parkland at high elevations in the Bridger Range. Pollen of Populus, Rosaceae, Poaceae, Asteraceae, Ambrosia, and Other Herbs steadily increased after 5000 cal yr BP, and Artemisia and Pseudotsuga-type pollen declined (Fig. 4). This transition indicates an expansion of alpine meadows and aspen groves and at the expense of steppe and low-elevation conifers. After ca. 2800 cal yr BP (Zone FL-5), increased pollen levels of Abies, Picea, and Pinus and further decreases in Artemisia pollen mark development of the present-day mixed-conifer forest (Fig. 5).
Increased levels of Potamogeton and Other Aquatics after ca. 3000 cal yr BP imply flooded lake margins, and decreased carbonate content suggests lower water temperatures than before (Meyers and Ishiwatari, Reference Meyers and Ishiwatari1993). CHAR levels increased slightly in Zone FL-4, and large charcoal peaks suggest occasional large and/or severe fires (Whitlock and Larsen, Reference Whitlock, Larsen, Smol, Birks and Last2001). CHAR levels became even higher in the last 2000 yr (Zone FL-5) with several large charcoal peaks and fire frequency increased from ca. 3–8 episodes/1000 yr, implying a shift to stand-replacing fires similar to the present fire regime (Fig. 5).
Between ca. 4500 and 2000 cal yr BP, increased red clay layers at Fairy Lake suggest a higher frequency of avalanches or mass-wasting events in the watershed (Fig. 5). Their appearance coincides with the onset of Neoglacial advances in the Canadian and United States Rockies when summers became cooler and wetter than before (Menounos et al., Reference Menounos, Osborn, Clague and Luckman2009).
Vegetation and fire history in the northern GYE
The high-elevation vegetation and fire history from Fairy Lake (Fig. 5) was compared with four records at lower elevations in the northern GYE (Fig. 1): (1) Dailey Lake (45.262 N, 110.815 W, 1601 m elev) in present-day steppe/parkland, which provides a pollen and charcoal record for the period from ca. 14,500–7000 cal yr BP; (2) Crevice Lake (45.000 N, 110.578 W, 1695 m elev) in open Pseudotsuga forest with a record of the last 8900 yr; and (3) Blacktail (44.953 N, 110.604 W, 2017 m elev) and (4) Slough Creek (44.937 N, 110.337 W, 2070 m elev) pond, both of which lie in open mixed-conifer forest and span the last ca. 14,000 yr (Fig. 1 for site locations). The vegetation history at each site was compared based on trends in total arboreal pollen, as a measure of changing forest cover, and changes in percentages of Picea and Pseudotsuga-type pollen, as taxa indicative of high- and low-elevation forest composition (Fig. 6). Charcoal data were a proxy of site-specific fire activity. In all cases, the published chronologies were used in making the comparison. Oxygen-isotope and diatom records from Crevice Lake and Blacktail Pond provided independent information on northern GYE environmental change (Whitlock et al., Reference Whitlock, Dean, Fritz, Stevens, Stone, Power, Rosenbaum, Pierce and Bracht-Flyr2012; Krause and Whitlock, Reference Krause and Whitlock2013), and paleoclimate model simulations (Bartlein et al., Reference Bartlein, Anderson, Anderson, Edwards, Mock, Thompson, Webb, Webb III and Whitlock1998) helped identify the large-scale climate conditions since deglaciation.
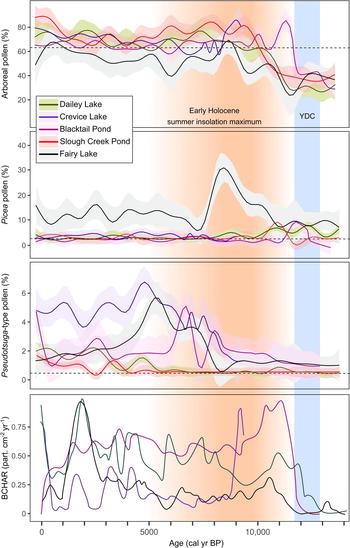
Trends in vegetation and fire in the northern GYE as inferred from moving medians of arboreal, Picea, and Pseudotsuga-type pollen data, and background charcoal, respectively. The shaded areas denote standard deviations and the dashed lines show the median pollen percentage for each taxon. For reference, the timing of the Younger Dryas chronozone (YDC; 12,900–11,500 cal yr BP; Alley, Reference Alley2000) and the early-Holocene insolation maximum (Berger and Loutre, Reference Berger and Loutre1991) are indicated in blue and orange shading, respectively. (For interpretation of the references to color in this figure legend, the reader is referred to the web version of this article.)

Late-glacial period (ca. 15,000 to 11,500 cal yr BP)
Pollen data from all elevations in the northern GYE indicate the presence of a shrub steppe or tundra in the first millennia following glacial recession. Artemisia, Poaceae, and herbs, as well as Juniperus, Alnus, Betula, and Salix, were early colonizers of the region, and the vegetation reconstruction suggests cold, dry conditions, poorly developed soils, and unstable slopes (Krause et al., Reference Krause, Lu, Whitlock, Fritz and Pierce2015). Picea expanded early at all elevations to form a subalpine parkland. This vegetation was present first at low-elevation Dailey Lake at ca. 13,300 cal yr BP (Krause et al., Reference Krause, Lu, Whitlock, Fritz and Pierce2015), then at middle-elevation Blacktail Pond and Slough Creek Pond at ca. 12,600 cal yr BP (Krause and Whitlock, Reference Krause and Whitlock2013), and finally at high-elevation Fairy Lake at 10,500 cal yr BP. The timing of parkland development at different elevations suggests rapid but sequential colonization of Picea along the path of ice recession into northern Yellowstone (Krause and Whitlock, Reference Krause and Whitlock2017) and from low to high elevations.
The subalpine became more diverse between ca. 12,300 and 11,200 cal yr BP with increases in Abies and Pinus flexilis/albicaulis occurring at low- and middle-elevation sites. The CHAR records at Blacktail Pond and Dailey Lake show an increase in fires by ca. 11,800 cal yr BP, whereas increased fire activity at Fairy Lake came slightly later (Fig. 5), probably reflecting cooler conditions and sparser vegetation cover at high elevations.
The late-glacial vegetation and fire history along the elevational transect is consistent with a shift from relatively cold, dry conditions during the early stages of ice recession to warmer, effectively wetter conditions at the end of the late-glacial period. These conditions were likely driven by rising summer insolation and the northward shift of the jet stream from its full-glacial position (Whitlock and Bartlein, Reference Whitlock and Bartlein1993; Bartlein et al., Reference Bartlein, Anderson, Anderson, Edwards, Mock, Thompson, Webb, Webb III and Whitlock1998). Rising temperatures and more-humid conditions likely fostered the transition from early steppe-tundra communities with few shrubs and trees to a subalpine parkland of Picea and then mixed conifers. The combination of increased fuel levels and warmer conditions was also conducive to more fires.
The Younger Dryas chronozone (YDC; 12,900–11,500 cal yr BP; Alley, Reference Alley2000) is not registered as a distinctive climatic event in either the vegetation or fire history of sites in the northern GYE (Fig. 6). Krause and Whitlock (Reference Krause and Whitlock2017), however, proposed that cooler conditions during the YDC may have delayed forest closure at the middle-elevation sites of Blacktail Pond and Slough Creek Pond. At Fairy Lake, high avalanche or other mass-wasting activity, as indicated by frequent red layers (Fig. 5), provides evidence for high snowpack and unstable conditions.
Early-Holocene period (ca. 11,500 to 9000 cal yr BP)
The amplification of the seasonal cycle of insolation between ca. 11,000 and 9000 cal yr BP brought warmer summers than before and winters that were cooler than present (Fig. 5; Bartlein et al., Reference Bartlein, Anderson, Anderson, Edwards, Mock, Thompson, Webb, Webb III and Whitlock1998). A δ18O record from Blacktail Pond indicates lower lake levels at this time, which are attributed to high temperatures and increased evaporative demand (Krause and Whitlock, Reference Krause and Whitlock2013). Presumably in response to these climate changes, all sites show an increase in forest cover. At low elevations, Pinus contorta was present at Dailey Lake after ca. 12,300 cal yr BP, although the valley floor may have remained treeless (Krause et al., Reference Krause, Lu, Whitlock, Fritz and Pierce2015). The transition towards more conifers occurred next at Blacktail Pond at ca. 11,500 cal yr BP, when closed Pinus forest with some Picea and Abies was present between ca. 11,300 and 7500 cal yr BP. Pseudotsuga was also present in low abundance by ca. 9000 cal yr BP (Fig. 6; Krause and Whitlock, Reference Krause and Whitlock2013). The Slough Creek Pond area supported Pinus-Juniperus forest between ca. 11,000 and 9200 cal yr BP (Millspaugh et al., Reference Millspaugh, Whitlock, Bartlein and Wallace2004). Warm conditions at Fairy Lake occurred between 10,500 and 9200 cal yr BP and led to an upslope shift of upper tree line, as evidenced by the presence of open Picea forest and more fires.
Middle-Holocene period (ca. 9000 to 5000 cal yr BP)
The middle Holocene was characterized by drought-tolerant, fire-adapted taxa (e.g., Pseudotsuga and Pinus contorta), relatively open forest at all elevations, and a shift to smaller or less-severe fires. The Fairy Lake record suggests an abrupt shift from open Picea forest to a parkland dominated by Pinus and Pseudotsuga at ca. 9200 cal yr BP. Pseudotsuga increased in abundance between ca. 9200 and 5500 cal yr BP across the northern GYE, although the timing of expansion is variable. Pseudotsuga parkland was present at Fairy Lake at ca. 9200 cal yr BP, Crevice Lake at ca. 8000 cal yr BP, Blacktail Pond at ca. 7600 cal yr BP, Slough Creek Pond at ca. 7000 cal yr BP, and Dailey Lake at ca. 5500 cal yr BP (Fig. 6; Krause and Whitlock, Reference Krause and Whitlock2017). Blacktail Pond shows maximum Pseudotsuga-type abundance between ca. 8500 and 4500 cal yr BP followed by a decline, whereas at the other low- and middle-elevation sites, high values persisted into the late Holocene. The decrease in CHAR levels and absence of pronounced fire episodes at most sites is interpreted as evidence of frequent, small or low-severity fires (Whitlock and Larsen, Reference Whitlock, Larsen, Smol, Birks and Last2001) during this time period (Fig. 6).
This period of summer drought occurred when summer insolation was higher than present but less than the early-Holocene maximum. Paleoclimate model simulations show that persistent enhancement of the northeastern Pacific Subtropical High-pressure system during this period maintained higher-than-present summer temperatures and aridity (Bartlein et al., Reference Bartlein, Anderson, Anderson, Edwards, Mock, Thompson, Webb, Webb III and Whitlock1998; Shinker et al., Reference Shinker, Bartlein and Shuman2006). The isotope data from Crevice Lake indicate relatively dry winters during this period, and these conditions may have amplified the effects of the summer insolation maximum in creating a strong drought signal in northern GYE (Whitlock et al., Reference Whitlock, Dean, Fritz, Stevens, Stone, Power, Rosenbaum, Pierce and Bracht-Flyr2012).
Late-Holocene period (ca. 5000 to present)
Pollen data from the low-and middle-elevation sites show increased forest cover and high values of Pseudotsuga-type and Pinus in the last 5000 to 3000 yr (Fig. 6). Diatom data from Crevice Lake indicate greater water-column mixing than before and shortened springs (Whitlock et al., Reference Whitlock, Dean, Fritz, Stevens, Stone, Power, Rosenbaum, Pierce and Bracht-Flyr2012), suggesting rapid shifts from winter to summer conditions. A more-closed forest of Pinus contorta and Pseudotsuga developed at Blacktail and Slough Creek ponds in the last 2500 yr (Fig. 6), and mixed-conifer parkland was established at Fairy Lake at ca. 5000 cal yr BP and became a closed forest in the last 2800 cal yr (Fig. 5).
Fairy Lake shows high fire activity in the late Holocene, with the most pronounced increase occurring in the last three millennia (Fig. 6). A similar period of high fires is noted at Slough Creek Pond after ca. 2000 cal yr BP and at Crevice Lake after ca. 1000 cal yr BP, although it did not occur at Blacktail Pond (Fig. 6). The heightened CHAR levels, along with the presence of large charcoal peaks, are consistent with increased fuel loads and a shift to large stand-replacing fires (Higuera et al., Reference Higuera, Briles and Whitlock2014).
Evidence of late-Holocene forest closure and increased large fires is registered in many records in the northern Rocky Mountains as well as within the GYE. This shift is attributed to the onset of generally wetter conditions during the Neoglacial period, which led to increased fuel accumulation, as well as occasional times of drought, when fuels desiccated and burned (Meyer et al., Reference Meyer, Wells, Stephen and Timothy Jull1995; Whitlock et al., Reference Whitlock, Dean, Fritz, Stevens, Stone, Power, Rosenbaum, Pierce and Bracht-Flyr2012; Riley et al., Reference Riley, Pierce and Meyer2015). Indigenous peoples may also have been an important ignition factor at some sites, given archaeological evidence throughout the GYE for increasing population size in recent millennia (MacDonald, Reference MacDonald2012; Fisher et al., Reference Fisher, Dudley and Donahoe2016).
Comparison with other northern Rocky Mountain records
The Bridger Range is located between the Bitterroot-Selway ranges to the west and the Bighorn Mountains to the east (Fig. 1). Comparison of late-glacial and Holocene pollen data from small high-elevation lakes in these three regions reveals somewhat different responses to large-scale changes in climate. These differences reflect the influence of receding glaciers, the summer insolation maximum, and shifts in the position of jet stream.
In the Selway-Bitterroot region, we draw on pollen records from Burnt Knob Lake (45.704 N, 114.9866 W, 2250 m elev) and Baker Lake (45.892 N, 114.262 W, 2300 m elev; Brunelle et al., Reference Brunelle, Whitlock, Bartlein and Kipfmueller2005), located in open subalpine forest dominated by Abies lasiocarpa, Pinus albicaulis, Picea engelmannii, and Pinus contorta. Baker Lake also supports some Larix lyallii. In the Bighorn Mountains, Beaver Lake (44.453 N, 107.101 W, 2569 m elev) and Sherd Lake (44.270 N, 107.0125 W, 2668 m elev; Burkart, Reference Burkart1976) are located in subalpine forest predominantly of Pinus contorta but with some Picea engelmannii and Abies lasiocarpa. The Bitterroot-Selway ranges are the wettest of the three regions (102–114 cm/yr), with most precipitation in winter (summer [July–August]/winter [December–February] = 0.58–0.96). The Bighorn Mountains are dry, with the sites receiving 20–31 cm/yr but a significant component falls in summer (JJA/DJF= 2.1–3.4). Fairy Lake is intermediate with mean annual precipitation of 81 cm/yr in both seasons (JJA/DJF = 1.3). In this analysis, we compare moving median percentages of arboreal pollen to describe forest openness through time and temporal trends in Picea percentages, an indicator of high-elevation forest, and Pseudostuga-type pollen, a signal of lower forest dynamics.
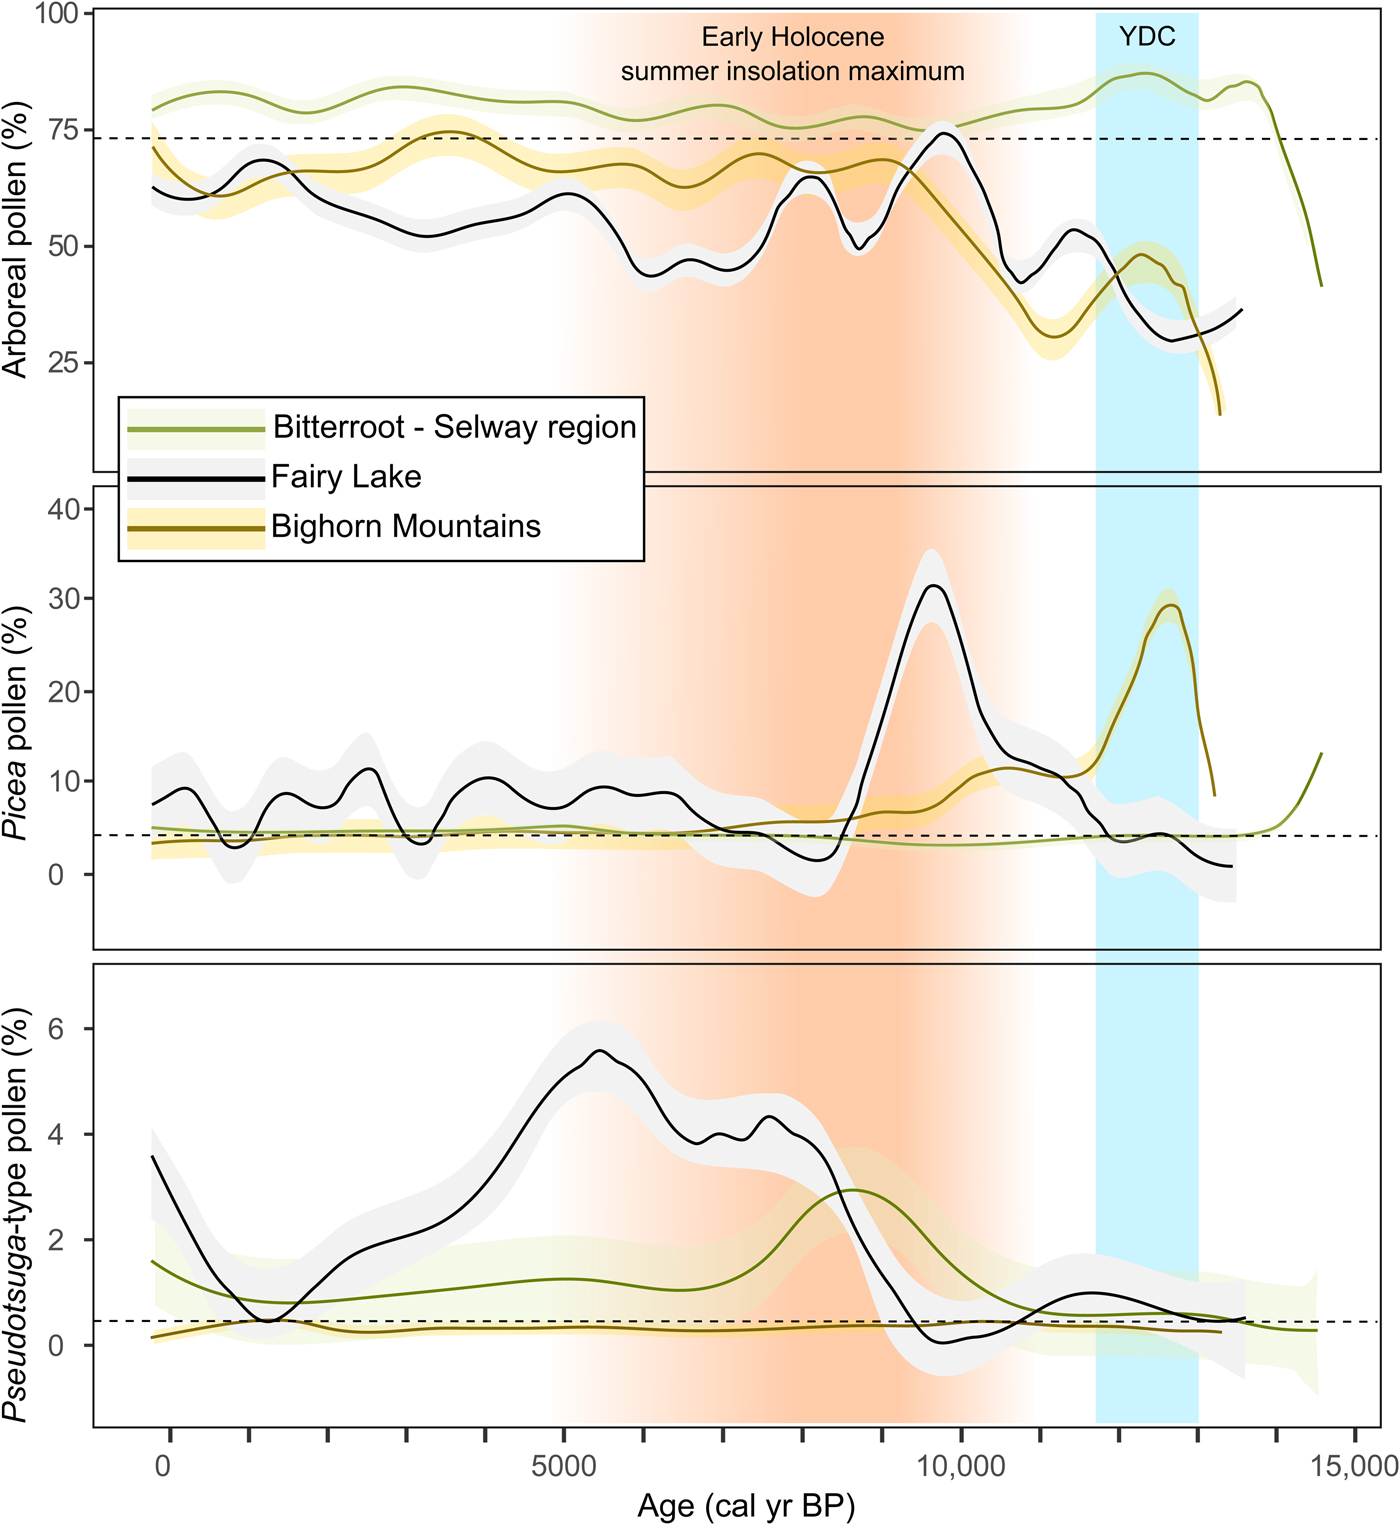
Comparison of arboreal pollen through time suggests forest development in the Bitterroot-Selway region started at ca. 14,000 cal yr BP, whereas at Fairy Lake parkland was not replaced by forest until ca. 11,500 cal yr BP (Fig. 7). In the Bighorn Mountains, parkland/tundra also persisted until ca. 11,500 cal yr BP. The earlier establishment of forest in the west is possibly related to earlier warming and effectively wetter conditions there. It is likely that the effects of the northward-shifting jet stream following ice-sheet recession and rising summer insolation were felt first in the west while cool conditions persisted in the east (Whitlock and Bartlein, Reference Whitlock and Bartlein1993; Bartlein et al., Reference Bartlein, Anderson, Anderson, Edwards, Mock, Thompson, Webb, Webb III and Whitlock1998).
High-elevation vegetation trends in the northern Rocky Mountains as inferred from moving medians of arboreal, Picea, and Pseudotsuga-type pollen data from Fairy Lake, the Bitterroot-Selway region to the west, and the Bighorn Mountains to the east. The shaded areas denote standard deviations and the dashed lines show the median pollen percentage for each taxon. For reference, the timing of the Younger Dryas chronozone (YDC; 12,900–11,500 cal yr BP; Alley, Reference Alley2000) and the early-Holocene insolation maximum (Berger and Loutre, Reference Berger and Loutre1991) are indicated in blue and orange shading, respectively. (For interpretation of the references to color in this figure legend, the reader is referred to the web version of this article.)
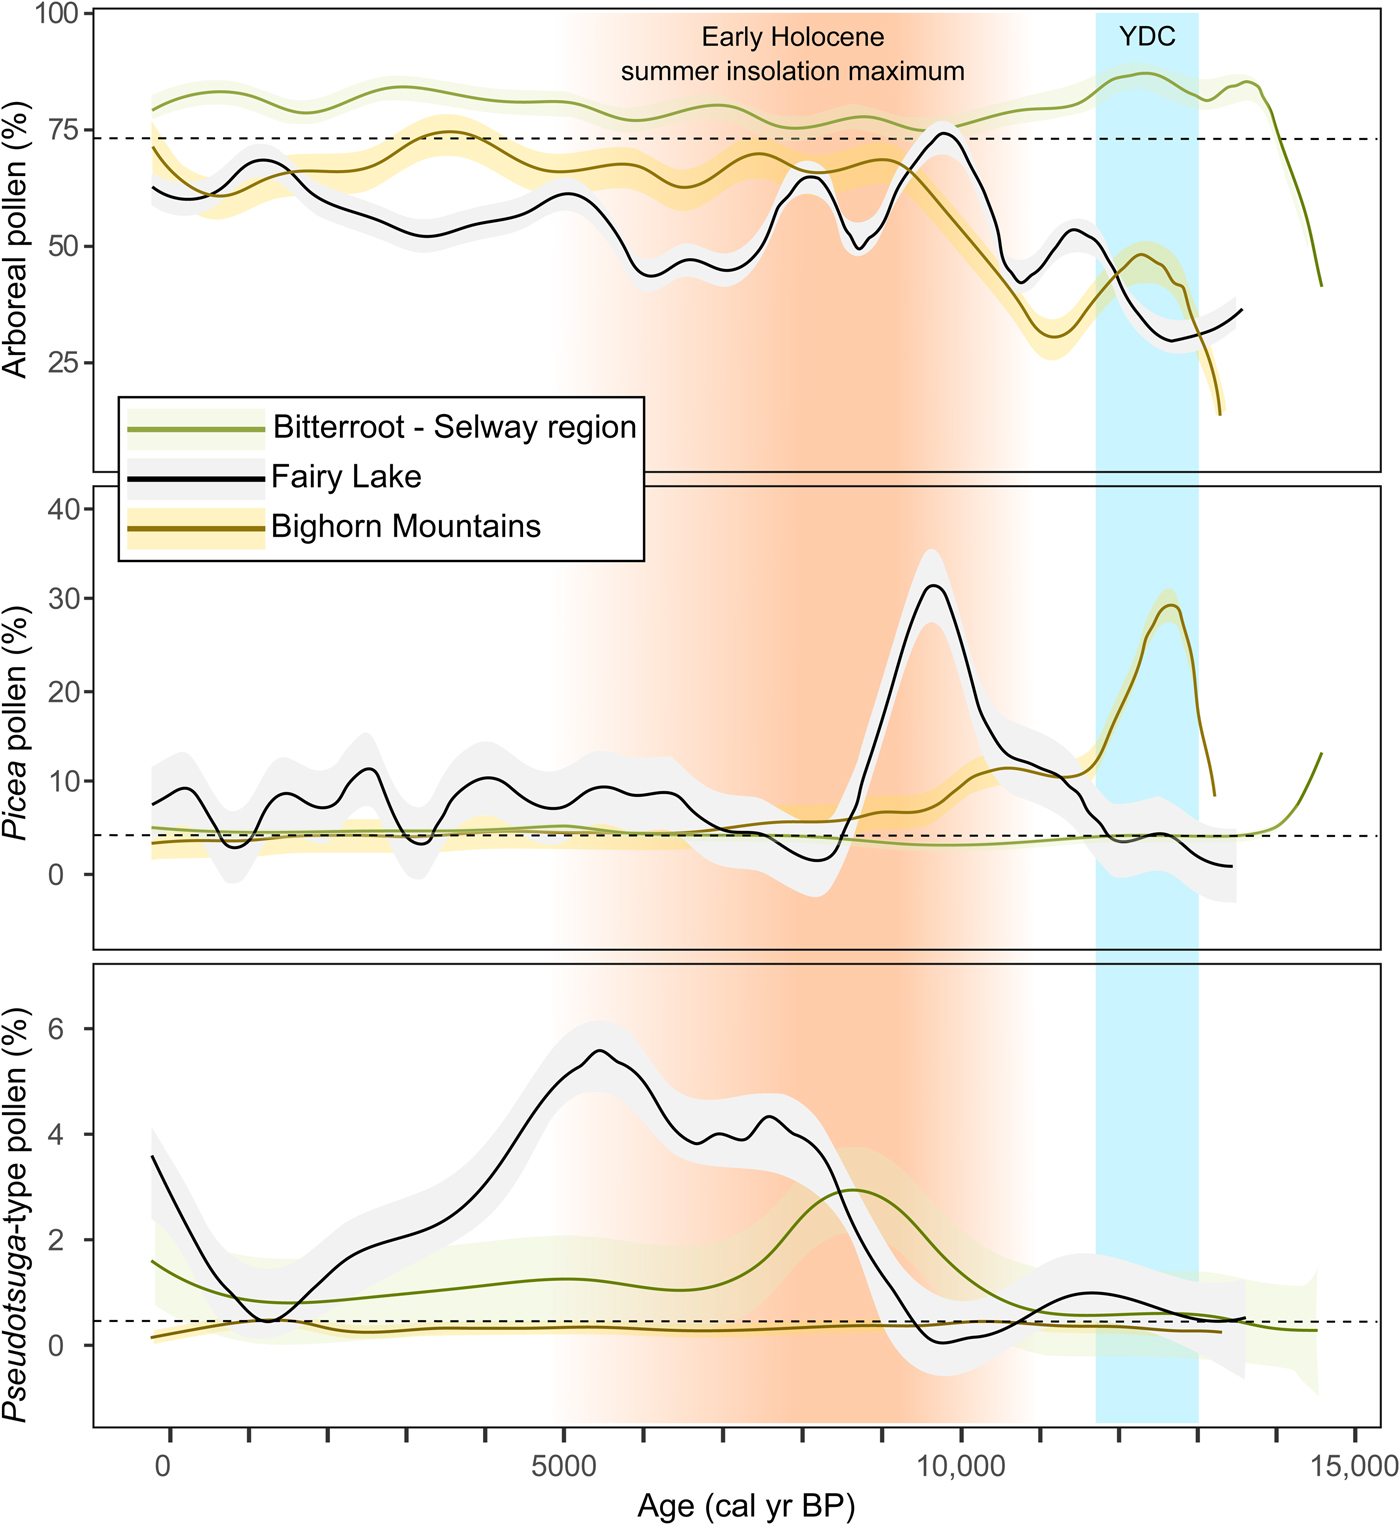
Picea was present by ca. 14,000 cal yr BP in the Bitterroot-Selway region, although never abundant and soon replaced by Pinus-dominated forest (Fig. 7). At Fairy Lake, a closed Picea forest developed from ca. 11,500 to 9200 cal yr BP. In the Bighorn Mountains, Picea was present after ca. 13,000 cal yr BP, but soon declined in importance with the expansion of Pinus. The relatively short period of Picea dominance followed by Pinus in the west and east regions suggests a response to rising temperatures and aridity with increasing summer insolation (Whitlock and Bartlein, Reference Whitlock and Bartlein1993; Bartlein et al., Reference Bartlein, Anderson, Anderson, Edwards, Mock, Thompson, Webb, Webb III and Whitlock1998). In contrast, Picea forest was present at Fairy Lake during the summer insolation maximum, indicating that high elevations in the Bridger Range were sufficiently wet to support mesophytic forest. Unlike the regions to the east and west, which have strongly seasonal patterns of precipitation at present, the Bridger Range receives precipitation year-round with a maximum in April, May, and June (PRISM Climate Group, 2015).
Pseudotsuga-type pollen in the Bitterroot-Selway region suggests an upslope shift of low-elevation forest between ca. 11,500 and 9000 cal yr BP in response to effectively dry conditions (Fig. 7; Brunelle et al., Reference Brunelle, Whitlock, Bartlein and Kipfmueller2005); Larix may also have been part of the forest expansion given that its pollen cannot be separated from that of Pseudotsuga (Gugger and Sugita, Reference Gugger and Sugita2010). A similar expansion of Pseudotsuga occurred at Fairy Lake but later at ca. 9000–5000 cal yr BP, and this is consistent with delayed middle-Holocene warming noted in all the northern GYE sites discussed in this paper. In the Bighorn Mountains, Pseudotsuga abundance did not increase until the last 2500 yr and the eastern region may have been too dry at high elevations to support much upslope movement (Lyford et al., Reference Lyford, Jackson, Betancourt and Gray2003).
The earlier expansion of Pseudotsuga in the west suggests that the onset of warm, dry conditions coincided with summer insolation maximum. At Fairy Lake and other GYE sites, Pseudotsuga expansion occurred after the summer insolation maximum (Berger and Loutre, Reference Berger and Loutre1991), and it was much later and less pronounced in the Bighorn Mountains. The west-east differences in the timing of Holocene aridity and Pseudotsuga expansion may be related to the relative importance of winter precipitation in the Bitterroot-Selway region versus the relatively high levels of summer precipitation in the Bighorn Mountains. The intensification of the northeastern Pacific Subtropical High-pressure system during the early-Holocene summer insolation maximum would have enhanced summer drought in summer-dry regions like the Bitterroot-Selway. In contrast, summer-wet regions, like the Bighorn Mountains, would have experienced strengthened summer monsoonal circulation in the early Holocene, thus delaying aridity (Whitlock and Bartlein, Reference Whitlock and Bartlein1993).
During the late Holocene, the Bitterroot-Selway region shows an expansion of Picea at ca. 5000 cal yr BP, whereas at Fairy Lake, the expansion began at ca. 7000 cal yr BP, coincident with increased avalanche or mass-wasting activity (Fig. 7). Beaver Lake in the Bighorn Mountains registered very slight increases in Picea pollen at ca. 6000 cal yr BP, whereas Sherd Lake showed no change. The somewhat variable timing of Picea expansion across the three regions in the late Holocene matches the asynchronous response of Neoglacial advances in the area (Fig. 5; Menounos et al., Reference Menounos, Osborn, Clague and Luckman2009).
CONCLUSIONS
The Fairy Lake record provides the first information on the postglacial vegetation and fire history of the Bridger Range. Between ca. 15,000 and 13,700 cal yr BP, the site was covered by tundra-steppe, and Alnus, Betula, Salix, and Juniperus were present, but not abundant. An open Picea forest developed at ca. 11,200 cal yr BP during a time of higher-than-present upper tree line and elevated fire activity (increased CHAR and fire-episode frequency). At ca. 9200 cal yr BP, the vegetation changed abruptly to Pinus and Pseudotsuga parkland, which likely supported small, frequent surface fires. After ca. 5000 cal yr BP, a mixed-conifer parkland of Picea, Abies, and Pinus was established at the site, and the watershed supported closed mixed-conifer forest after ca. 2800 cal yr BP with larger or more-severe fires. The early stages of deglaciation, the YDC, and the Neoglacial period were associated with heightened avalanche or similar mass-wasting activity at the site, suggesting times of high snowpack and unstable late-season snow conditions.
A comparison of Fairy Lake with other sites in the northern GYE records shows similarities in the timing of vegetation change at different elevations. The period of highest tree line at Fairy Lake is coincident with expanded steppe and xerophytic parkland at low and middle elevations and represents a region-wide response to warm summers in the early Holocene. All sites show driest conditions between ca. 9000 and 5000 cal yr BP, and establishment of more-closed forest and large stand-replacing fire occurred during Neoglacial cooling in the late Holocene. In this study, relatively synchronous vegetation change attests to the importance of insolation-driven climate variations in governing fire and vegetation dynamics.
West-to-east differences are evident in the vegetation history at high elevations in the northern Rocky Mountains, and likely reflect geographic differences in moisture availability and temperature through time. Sites in the Bitterroot-Selway region to the west show an early response to warming beginning at ca. 14,000 cal yr BP followed by drought conditions at ca. 11,200 cal yr BP that persisted until about ca. 5000 yr. The Bighorn Mountains to the east were relatively dry throughout the postglacial period, as evidenced by a short-lived Picea period, early conversion to Pinus dominance at ca. 13,000 cal yr BP, and a near-absence of Pseudotsuga-type pollen in high-elevation records. The Bridger Range was apparently warm and moist enough in the early Holocene to sustain Picea forest when other mountain ranges supported more xerophytic subalpine forest. The upslope Pseudotsuga expansion in the Bridger Range was delayed until ca. 9000 cal yr BP, marking the timing of drought there. The relatively early response to rising insolation in the west is explained by its location upwind of the Laurentide Ice Sheet, which likely delayed warming in the Bridger Range and Bighorn Mountains to the east. The west-east differences in the timing of maximum aridity are attributed to the relative importance of winter precipitation in the west over summer precipitation in the east.
ACKNOWLEDGMENTS
We thank M. Weingart, D. Hawthorne, K. Taylor, T. Turnquist, P. Alt, B. Ulrich, and P. Bodalski for their help in the field. K. Pierce and J. Dixon aided with the geomorphic interpretations, and P. Bodalski, R. Michels, and J. Mauch provided laboratory assistance. The study was supported by grants from the National Science Foundation (OISE 0966472, EPS-1101342).