1. Introduction
The concept of dual-mode scramjet (DMSJ) was introduced by Curran & Stull (Reference Curran and Stull1964) to extend the operation of a scramjet engine to low Mach numbers (below Mach 7). In this regime, supersonic combustion becomes inefficient because the occurrence of thermal choking severely limits the amount of fuel that can be burned within the engine. To overcome this problem, the combustor of a DMSJ can operate subsonically (ram mode) at low flight speed (Mach 3-4), in a mixed subsonic/supersonic regime (dual mode) at intermediate speed (Mach 4-7) and supersonically (scram mode) at higher speed (above Mach 7). Therefore, a DMSJ can be efficiently operated over a wide range of Mach numbers while retaining the practical advantages of a fixed geometry. The key element that characterizes a DMSJ is a constant-area channel placed between the inlet and combustor, known as an isolator or constant-area diffuser. The isolator is the component that allows a controlled transition from subsonic to supersonic combustion and vice versa.
At the transitional regime the isolator is typically characterized by the presence of a shock train, i.e. a series of consecutive shocks followed by re-expansions occurring in a channel flow. Depending on the shape, a shock train can be classified as  $x$-type (also known as oblique shock train) or
 $\lambda$-type (also known as normal shock train). Experimentally, it was observed (Matsuo, Miyazato & Kim Reference Matsuo, Miyazato and Kim1999; Gnani, Zare-Behtash & Kontis Reference Gnani, Zare-Behtash and Kontis2016; Hunt & Gamba Reference Hunt and Gamba2018b) that the shape of a shock train is mainly controlled by two parameters, namely the incoming Mach number and the flow confinement, defined as
 $C_\delta = 2\delta /H$, where
 $\delta$ is the boundary layer thickness and
 $H$ is a characteristic dimension of the duct (i.e. channel height or hydraulic diameter).
Normal shock trains are typical of lower Mach numbers (below Mach 1.8) and moderate flow confinements ( $C_\delta < 0.2$) (Tamaki, Tomita & Yamane Reference Tamaki, Tomita and Yamane1970). Each
 $\lambda$ shock consists of a normal part near the centre (stem) that bifurcates into two or more oblique shocks near the wall (legs). The pressure rise is mostly localized in the first shock, that accounts for almost 75 % of the total shock train pressure rise. Oblique shock trains are typical of higher Mach numbers (above Mach 2.2) and large flow confinements (
 $0.3 < C_\delta < 0.7$) (Tamaki, Tomita & Yamane Reference Tamaki, Tomita and Yamane1971). Compared with normal shock trains, oblique shock trains tend to be longer and contain a larger number of shocks. The pressure rise is more uniformly distributed, with typically only 25 % of the overall pressure rise localized at the leading shock.
As mentioned earlier, the shape of a shock train is determined by Mach number and flow confinement. This dependency can be qualitatively explained considering that the reflected shocks shape is the result of the shock wave-boundary layer interaction (SBLI) at the wall. The incoming Mach number determines the strength of the shock and, therefore, the magnitude of the pressure gradient applied along the boundary layer. On the other hand, the boundary layer thickness determines the velocity gradient near the wall and, therefore, the ability of the boundary layer to remain attached against an adverse pressure gradient. The effect of these parameters on the shape transition of a shock train was investigated by several authors (Ikui, Matsuo & Nagai Reference Ikui, Matsuo and Nagai1974a; Carroll & Dutton Reference Carroll and Dutton1990; Nill & Mattick Reference Nill and Mattick1996; Miyazato, Matsuo & Kasada Reference Miyazato, Matsuo and Kasada2009; Fotia & Driscoll Reference Fotia and Driscoll2012; Hunt & Gamba Reference Hunt and Gamba2018b). Hunt & Gamba (Reference Hunt and Gamba2018b) summarized and analysed a number of existing experimental results, showing that the shock train is mainly of  $\lambda$-type below Mach 1.7 and of
 $x$-type above Mach 2.2, regardless of the confinement
 $C_\delta$. In the transitional range of
 $1.7 < M < 2.2$, the experimental shock train characterization is less definite, which suggest that
 $C_\delta$ plays a more prominent role.
A major challenge associated with scramjet isolators is the stabilization of the shock train. At design conditions the length of the isolator is sufficient to accommodate the shock train. Nevertheless, perturbations from the incoming flow (abrupt Mach number variations, flow distortion, etc.) or the combustor (flow choking) can destabilize the shock train and cause the disgorgement of the shock system out of the inlet (inlet unstart). Choking-induced unstart has become a priority for the scramjet community after the in-flight failure of the X-51 Waverider was attributed to inlet unstart (Norris Reference Norris2011). An increased effort has been made over the last decade to investigate this problem in greater detail (Im & Do Reference Im and Do2018). Choking is a characteristic phenomenon of internal compressible flows that occurs when sonic conditions ( $M = 1$) are met. Choking in a supersonic combustor is caused by a variety of factors acting simultaneously, most commonly heat release (thermal choking), area blockage, mass addition and irreversibility (caused by shocks, friction, turbulent dissipation, etc.) (Riggins et al. Reference Riggins, Tackett, Taylor and Auslender2006). When choking occurs in the combustor, the entire flow field undergoes a readjustment through the upstream propagation of a pseudo-normal shock.
The term pseudo-normal shock was introduced by Crocco (Reference Crocco1958) to indicate the complex flow structure that arises in a channel in place of a single normal shock because of the viscous interaction at the wall. A pseudo-normal shock is composed of a shock train followed by a low-speed dissipation region. The flow downstream of a pseudo-normal shock is subsonic and, in first approximation, has the same pressure predicted behind a normal shock relation at the same incoming Mach number. It is worth stressing again that, whereas the terms pseudo-normal shock and shock train are often used interchangeably in the literature, a different meaning is attributed to the two terms in this work. Following the nomenclature proposed by Matsuo et al. (Reference Matsuo, Miyazato and Kim1999), the term ‘shock train’ will be used in a more general sense to indicate any flow structure characterized by multiple shock reflections, whereas ‘pseudo-normal shock’ will be reserved uniquely for the unsteady shock initiated by flow choking.
Producing flows representative of the realistic flight conditions at which unstart typically occurs requires large-scale high-enthalpy facilities. These facilities are not readily available to most researchers especially in academia. Therefore, a large number of choking and unstart studies have been performed in non-practical conditions, i.e. at low-enthalpy flow conditions and/or inducing choking artificially (without combustion) by mechanical throttling, mass addition or other means. An example of mechanical blockage used to induce unstart in a model scramjet was reported by Wieting (Reference Wieting1976), who used a cylindrical pin to reduce the exhaust area by up to 60 %. Other investigators used movable ramps downstream of the isolator to mimic the back pressure rise (Emami et al. Reference Emami, Trexler, Auslender and Weidner1995; Rodi, Emami & Trexler Reference Rodi, Emami and Trexler1996; Valdivia et al. Reference Valdivia, Yuceil, Wagner, Clemens and Dolling2009; Wagner et al. Reference Wagner, Yuceil, Valdivia, Clemens and Dolling2009; Srikant et al. Reference Srikant, Wagner, Valdivia, Akella and Clemens2010; Wagner, Yuceil & Clemens Reference Wagner, Yuceil and Clemens2010; Zhang et al. Reference Zhang, Tan, Sun, Bu and Rao2016). Shimura et al. (Reference Shimura, Mitani, Sakuranaka and Izumikawa1998) studied the blockage effect of force measuring systems on a scramjet engine tested in a freejet wind tunnel. Wagner et al. (Reference Wagner, Yuceil, Valdivia, Clemens and Dolling2009, Reference Wagner, Yuceil and Clemens2010) used particle image velocimetry to measure the two-dimensional velocity field in an isolator during unstart. Srikant et al. (Reference Srikant, Wagner, Valdivia, Akella and Clemens2010) developed an algorithm to detect unstart based on high-frequency pressure measurements. Valdivia et al. (Reference Valdivia, Yuceil, Wagner, Clemens and Dolling2009) successfully used vortex generators as an active control tool for inlet unstart. A different approach was adopted by Klomparens, Driscoll & Gamba (Reference Klomparens, Driscoll and Gamba2015), Hunt, Driscoll & Gamba (Reference Hunt, Driscoll and Gamba2009), Hunt & Gamba (Reference Hunt and Gamba2018b) employing the use of a valve to mechanically throttle the outflow of their direct-connect facility to raise the back pressure.
Low-enthalpy mass addition-induced choking studies avoid the introduction of geometric variations in the test model. The first application was implemented by Sato & Kaji (Reference Sato and Kaji1992). Tan, Sun & Yin (Reference Tan, Sun and Yin2009) used a similar technique to study the buzz phenomenon in an unstarted hypersonic inlet. Do et al. (Reference Do, Im, Mungal and Cappelli2011a), using planar laser Rayleigh scattering in a  $\textrm {CO}_2$-seeded flow, obtained a sequence of images of an inlet during an unstart event. Do et al. (Reference Do, Im, Mungal and Cappelli2011b) also investigated the effects of the boundary layer thickness on the shape and propagation speed of a pseudo-normal shock. Fike et al. (Reference Fike, Duraisamy, Alonso, Do, Im and Cappelli2011) compared these results with Reynolds averaged Navier–Stokes simulations in an attempt to develop a technique to predict precursor conditions for unstart.
More recently, an increased effort has been dedicated to the study of choking and unstart in high-enthalpy flows with combustion-induced thermal choking. The first investigation of this type was reported by O'Byrne et al. (Reference O'Byrne, Doolan, Olsen and Houwing2000), who used shadowgraph visualization and pressure measurements in a shock tunnel to determine the propagation speed of a pseudo-normal shock in a hydrogen-fuelled scramjet. Shock tunnels were also used by Frost et al. (Reference Frost, Gangurde, Paull and Mee2009) and Laurence et al. (Reference Laurence, Karl, Martinez Schramm and Hannemann2013, Reference Laurence, Lieber, Martinez Schramm, Hannemann and Larsson2014) to investigate choking and incipient shock train propagation in a model of the HyShot scramjet engine. Thermal choking studies on rectangular supersonic combustors were also performed by Mashio et al. (Reference Mashio, Kurashina, Bamba, Okimoto and Kaji2001) and Owens et al. (Reference Owens, Mullagiri, Segal, Ortwerth and Mathur2001) using direct-connect continuous-flow vitiated tunnels. Do, Passaro & Baccarella (Reference Do, Passaro and Baccarella2012), Liu et al. (Reference Liu, Passaro, Baccarella and Do2014) and Im et al. (Reference Im, Baccarella, McGann, Liu, Wermer and Do2016) studied combustion-induced unstart in a pulsed freejet-type arc-heated tunnel with 1 second test time. Im et al. (Reference Im, Baccarella, McGann, Liu, Wermer and Do2016) also discussed a comparison between combustion- and mass-induced unstart on a rectangular cross-section scramjet model.
The goal of this experimental study is to characterize the role played by combustion on the isolator-combustor interaction observed during choking-induced unstart in a scramjet engine. This will help to better understand the limitations posed by studying these phenomena in surrogate non-reacting and low-enthalpy environments. The main novelties are represented by the unique capabilities of the experimental set-up used that combines a sufficiently long test time for a complete observation of the unstart process, an unprecedented optical accessibility provided by fully transparent isolator and combustor and the possibility to study and compare unstart occurring in a variety of different conditions, high/low enthalpy, reacting/non-reacting mixtures, using the same canonical geometry. The high-enthalpy experiments are performed in a Mach 4.5 flow generated by an arc-heated hypersonic tunnel. A comparison is performed between unstart induced by thermal (combustion heat release) and non-thermal (mass addition) choking in a constant-area model scramjet with circular cross-section. The interest for curved-wall scramjets with a circular or elliptical cross-section has grown over the past decade (Bulman & Siebenhaar Reference Bulman and Siebenhaar2006) in light of their engineering advantages, such as the absence of corner-flow effects and improved structural efficiency. High-speed flow visualization and time-resolved pressure measurements are used to characterize the flow/flame post-choking behaviour in the scramjet combustor and isolator. Hydroxyl (OH)-planar laser-induced fluorescence (PLIF) imaging provides further details about flame distribution inside the combustor. Low-enthalpy experiments were performed using a pure  $\textrm {CO}_2$ free stream at Mach 4 and choking induced by mass addition. High-speed planar imaging performed by planar induced Rayleigh scattering revealed further details about the shock configuration and dynamics in the isolator. The paper is organized as follows. Section 2 provides an overview of the experimental set-up including wind tunnel, model scramjet and diagnostics. Sections 3 and 4 present and discuss the experimental results obtained at high and low enthalpy, respectively. Finally, § 5 summarizes the most significant findings.
2. Experimental set-up
2.1. The ACT-II experimental facility
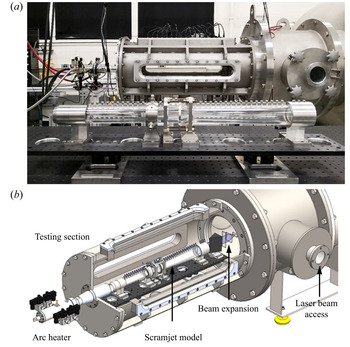
The experiments were conducted in the ACT-II hypersonic facility (see figure 1). The ACT-II is a pulsed, high-enthalpy wind tunnel designed for supersonic combustion research. The facility is composed of two high-pressure tanks, where the working gases (nitrogen and oxygen) are initially stored, a hot-gas generator (arc heater), a converging/diverging (C/D) nozzle, a test section and a vacuum tank where the flow is exhausted.
The ACT-II facility: (a) an overview and (b) a rendered cross-section view.

The arc heater of ACT-II has a coaxial electrode configuration with a cylindrical cathode (lanthanated tungsten) and an annular anode (titanium, zirconium, molybdenum alloy) separated by a ceramic constrictor. A typical DC voltage of 550–600 V is applied between the electrodes, generating an electric discharge in the constrictor gas flow. Typically, the arc is ignited and stabilized in argon and later transitioned to nitrogen. Oxygen is injected downstream of the discharge and mixed with the heated nitrogen using a set of ceramic screens to obtain standard air composition. This injection strategy significantly reduces erosion of the electrodes (and, consequently, the contamination of the flow) by limiting the formation of atomic oxygen in the arc chamber.
After mixing, the gas reaches thermodynamic equilibrium flowing at low speed through a plenum chamber before being expanded in the nozzle. The contoured nozzle used for the experiments has a throat diameter of 12.6 mm and an exit diameter of 60 mm, and was designed to produce a uniform air flow at Mach 4.5. The nozzle exit is connected to the test section of the facility, where the scramjet model is installed. The test section is provided with optical apertures on three sides, allowing flow visualization and laser diagnostics. Depending on the flow conditions, the test time of the tunnel can be extended up to 1 s. Further details about the facility and its performance are provided in Baccarella et al. (Reference Baccarella, Liu, Lee, Hammack and Do2017), Liu et al. (Reference Liu, Baccarella, McGann and Lee2018, Reference Liu, Baccarella, McGann and Lee2019) and Baccarella et al. (Reference Baccarella, Lee, Liu, Elliott, Freund and Lee2020).
2.2. Axisymmetric model scramjet and instrumentation
The circular section scramjet models, shown in figure 2, are comprised of a conical inlet, an isolator, a fuel injection manifold and a constant-area combustor. The models have a modular design and the single parts can be interchanged to obtain different geometrical configurations. Two slightly different configurations have been used in the high- and low-enthalpy tests for reasons that will be explained in § 4. Figure 2(a) shows a comparison between the two configurations of the model used and details of the fuel nozzle geometries. Figures 2(b) and 2(c) report the main dimensions of the high-enthalpy and low-enthalpy models, respectively.
Model scramjets used in the experiments: (a) comparison between high-enthalpy and low-enthalpy models and details of the injector nozzles; (b) dimensions (in mm) of the high-enthalpy model and (c) dimensions (in mm) of the low-enthalpy model.

Flow compression is provided by a  $20^{\circ }$ conical inlet with variable area contraction ratio (CR). A
 $\textrm {CR}=1.3$ was used for the low-enthalpy tests whereas
 $\textrm {CR}=1.6$ was used at high enthalpy. The combustor and isolator both have an internal diameter of 35 mm. They are manufactured from a UV-transparent acrylic material and instrumented with Kulite XTE-190SM-5A pressure transducers (PT), spaced at 15 mm along the flow direction. The signals from the pressure transducers are filtered (high-pass 20 kHz bandwidth) and amplified by signal conditioners (Dataforth 8B50), and are acquired by a data acquisition system (National Instruments PCIe-6363).
The fuel injector is located between the combustor and isolator. Different injector configurations have been used for low- and high-enthalpy cases as shown in figure 2(a). For the low-enthalpy tests, the injector consists of four radial supersonic nozzles, equally spaced along the perimeter. The nozzles have a throat diameter of 1.5 mm and a  $45^{\circ }$ conical divergent part. In the low-enthalpy experiments nitrogen was injected instead of fuel and a velocity of Mach 3.4 is estimated at the exit of the nozzles. Nitrogen is initially stored at the proper pressure in a gas tank and is injected into the model scramjet through fast-response solenoid valves controlled remotely. The fuel injector in the high-enthalpy case consists of an annular chamber with 16 sonic nozzles equally distributed along the circumference. Each nozzle has a diameter of 0.75 mm and is vectored
 $45^{\circ }$ downstream. A Kulite XTEL-190SM-50A sensor measures the pressure inside the annular chamber during the test, from which the mass flow rate of gas injected is computed using the sonic area relation. As shown in figure 2(a), the low-enthalpy model has a
 $60^{\circ }$ conical exhaust that was replaced by a constant-area acrylic extension in the high-enthalpy configuration.
2.3. Flow conditions
2.3.1. Low-enthalpy conditions
The flow conditions used for the low-enthalpy experiments are summarized in table 1. The tunnel was operated with the electric arc off and a pure  $\textrm {CO}_2$ free stream at Mach 4.0 with a stagnation pressure of 150 kPa. An estimation of the flow conditions at the combustor entrance have been obtained via computational fluid dynamics (CFD) using OpenFOAM software (Weller et al. Reference Weller, Tabor, Jasak and Fureby1998). The isolator flow was simulated with no injection downstream using an axisymmetric geometry. The axisymmetric distributions of the variables were transformed to equivalent one-dimensional (1D) values by means of stream-thrust averaging.
Summary of flow conditions.

 $^{a}$At low enthalpy equal to room temperature.
At high enthalpy estimated as in Baccarella et al. (Reference Baccarella, Liu, Lee, Hammack and Do2017).
 $^{b}$Measured using a Pitot probe.
 $^{c}$Computed from isentropic gas relations.
 $^{d}$Computed from CFD using stream-thrust averaging.
 $^{e}$With respect to the flow direction.
In low-enthalpy experiments flow blockage in the model scramjet was induced by mass addition, injecting a non-combustible gas (nitrogen) through the fuel nozzles. Each test is initiated by opening the solenoid valves of the facility. A quasi-steady  $\textrm {CO}_2$ flow is established after about 100 ms. Nitrogen injection is initiated after 150 ms and is maintained for 100 ms. The test is completed after 400 ms by closing the main valves of the tunnel.
2.3.2. High-enthalpy conditions
All the high-enthalpy tests performed in this study use the same free stream conditions as reported in table 1. The stagnation enthalpy of the tunnel is estimated using the method described in Baccarella et al. (Reference Baccarella, Liu, Lee, Hammack and Do2017). The free stream Mach number is evaluated from the stagnation pressure ratio, measured by a Pitot probe, and all the other properties are calculated using isentropic flow relations. Once again, stream-thrust averaged values at the entrance of the combustor are calculated from axisymmetric CFD simulations performed in OpenFOAM.
A comparison between two different choking mechanisms was made, namely combustion heat release (thermal choking) by injecting ethylene fuel and mass addition (non-thermal choking) by injecting air. Each tunnel run has a duration of 400 ms. About 200 ms are necessary to reach steady state conditions of the tunnel flow. Injection of the fuel/air is initiated after 50 ms of steady flow and is maintained for 100 ms.
3. High-enthalpy tests
This section presents and discusses the experimental results obtained at high-enthalpy conditions, comparing situations in which unstart shock propagation is initiated by thermal and non-thermal choking mechanisms. In analogy to a practical scramjet combustor, thermal choking is induced by excessive heat release from the combustion of ethylene fuel. Non-thermal choking, on the other hand, is caused by the aerodynamic blockage and mass loading of high-momentum air jets. The objective is to single out the phenomena inherently related to combustion from those provided by other factors.
3.1. Overview of the unstart process induced by thermal choking
In a typical process in which inlet unstart is initiated by thermal choking, the five stages depicted in figure 3 can be identified. For each stage, figure 3 shows a schematic of the flow configuration along with the corresponding wall pressure distribution. This figure, explained in detail below, will be used as a roadmap for the interpretation of the experimental results in the remaining sections.
Stages of the unstart process: flow configurations and pressure distributions. From top to bottom:  $0=\text {unfuelled}$,
 $1=\text {scram mode}$,
 $2=\text {dual mode}$,
 $3=\text {ram mode}$,
 $4=\text {unstart}$.

The significance of the colouring in figure 3 is as follows. White regions correspond to the high-speed core flow. Shocks are represented by black lines with thickness corresponding to the shock strength. Grey regions represent low speed separated flow. A red colour is used for the fuel flow and the colour map from red to yellow represents the overall combustion efficiency (the fraction of the injected fuel that has been burned).
Stage 0 corresponds to unfuelled conditions in which a supersonic flow is established through the scramjet model but no fuel is injected yet. The flow through the model is characterized by a series of weak shock waves induced by the conical inlet. The pressure profile at the wall exhibits a slightly increasing trend due to the effects of shocks and friction and the associated decrease in Mach number.
In stage 1 fuel is injected into the combustor and non-premixed flames develop at the interface between the fuel jets and the crossflow. Fuel injection induces a back pressure rise and additional shock compression in the combustor. The adverse pressure gradient propagates into the isolator through the subsonic part of the boundary layer, causing flow separation and formation of a shock train. At this stage, a more pronounced pressure increase can be observed in both the combustor and isolator but the core flow is still supersonic throughout the entire engine and, therefore, the DMSJ is operating in scram mode.
In stage 2 thermal choking occurs at the combustor exit. A pseudo-normal shock develops in the combustor and propagates upstream. The pseudo-normal shock region is characterized by a steep pressure rise, followed by a slight decrease indicating that the flow downstream has become subsonic. Intense combustion occurs in the highly turbulent diffusion region of the pseudo-normal shock because of the combination of low speed, fast mixing and high temperature. At this stage, combustion is accomplished partially at supersonic and partially at subsonic speed, i.e. the DMSJ is operating in dual mode. During the pseudo-normal shock propagation inside the combustor, periodic oscillations of the shock train in the isolator are observed.
In stage 3 the pseudo-normal shock has propagated into the isolator and starts interacting with the isolator shock train. This interaction disrupts the oscillations and the motion of the isolator shock system becomes irregular. In agreement with one-dimensional flow theory, the pressure exhibits an increasing trend upstream where the flow is still supersonic and a decreasing trend downstream of the shock where the flow is subsonic. At this stage, the fuel is injected into a subsonic flow and combustion occurs entirely in a subsonic regime, indicating that the DMSJ has completed transition to ram mode.
As the back pressure continues to rise, the isolator is not capable of accommodating the shock train anymore. In stage 4 the shock system has been entirely disgorged outside of the inlet, collapsing into a single normal shock. The flow through the scramjet model is entirely subsonic and mass spillage occurs at the leading edge. The pressure distribution under these conditions becomes monotonically decreasing. Despite restarting attempts occasionally occurring, this condition persists as long as fuelling is maintained.
3.2. Effects of the overall equivalence ratio
For the experimental set-up and the flow conditions considered in this study, the dependence of the operational mode on the overall equivalence ratio  $\phi _o$ is summarized in figure 4. Following Heiser & Pratt (Reference Heiser and Pratt1994), the overall equivalence ratio is defined as
 \begin{equation} \phi_o = \frac{1}{{r_{st}}}\frac{\dot{m}_{fuel}}{\dot{m}_{air}}, \end{equation}
where  $\dot {m}_{fuel}$ and
 $\dot {m}_{air}$ are respectively the fuel and air mass flow rate and
 $r_{st}$ is the stoichiometric fuel–air ratio.
Scramjet operational mode as a function of the overall equivalence ratio  $\phi _o$.

At low equivalence ratios ( $\phi _o < 0.6$), combustion heat release is insufficient to cause thermal choking and a stable scram mode is observed for the entire duration of the test. For
 $0.6 < \phi _o < 0.7$, choking may occur at some point during the test, whereas above 0.7 and below 0.9 dual mode was consistently observed. Similarly, the transition to ram mode started above
 $\phi _o = 0.9$ and stable subsonic combustion was observed up to
 $\phi _o = 1.4$. Pressure data revealed that combustion-induced pressure rise keeps increasing also for mixtures significantly richer than stoichiometric, indicating incomplete combustion in the combustor. This is not surprising considering the highly simplified geometry of the combustor in which no mixing enhancement was performed and flame stabilization relies uniquely on jet-wake stabilization. For
 $\phi _o > 1.4$, the combustion-induced pressure rise becomes large enough to push the pseudo-normal shock outside of the inlet causing unstart.
It is worth remarking the stochastic nature of mode transition between the modes. Due to the intrinsically unsteady nature of turbulent combustion, transitions are not characterized by a well-defined threshold value of the equivalence ratio but by an interval of  $\phi _o$'s over which the transition probability increases from 0 to 1.
3.3. Thermal and non-thermal choking comparison
The present work investigates the possibility of replicating an unstart process similar to that described in the previous section but with choking induced by non-thermal mechanisms, i.e. without significant variations of the stagnation enthalpy of the flow.
The non-thermal mechanism selected for comparison with combustion-induced choking is mass addition, in which choking is achieved by the injection of an inert gas (in this case air) at high pressure. This mechanism was preferred to mechanical choking devices, such as throttling valves or movable ramps, because it allows a closer approximation of the actual flow field in a scramjet combustor. This allows for better decoupling of the role played by combustion from those related to gas dynamics. To emphasize this analogy, a qualitative comparison between reacting and non-reacting jets in a crossflow is illustrated in figure 5.
Schematic of a jet in a supersonic crossflow interaction: comparison between (a) reacting and (b) non-reacting mixtures.

Fuel injection using a jet in a crossflow configuration has been extensively investigated (Gamba & Mungal Reference Gamba and Mungal2015; Sun, Wang & Xiao Reference Sun, Wang and Xiao2019) and the main features of this flow field are sketched in figure 5(a). The jet-crossflow interaction creates a bow shock and a separation region that provides compression of the incoming air. Furthermore, recirculation of the separated flow promotes the development of partially premixed flames that support combustion stabilization. A non-premixed flame develops inside the turbulent shear layer between the fuel jet and the air flow. Combustion heating rises the local temperature of the shear layer, the density decreases forcing the shear layer flow into an axial acceleration as demonstrated by Hasselbrink & Mungal (Reference Hasselbrink and Mungal2001). A similar interaction, shown in figure 5(b), can be obtained with an inert gas jet, under-expanded to mimic the combustion-induced pressurization.
The intent is to compare the response of the isolator flow to the interaction with the pseudo-normal shock (formed in the choked combustor) for cases in which choking is originated by combustion and by mass injection. The comparison between the two methods is performed by matching the global pressure rise across the isolator as shown in figure 8. The rationale behind this approach is that, matching the overall effect on the pressure field, only the peculiar aspects of reacting flows would be revealed, helping to better understand the role played by combustion beyond pressurization of the combustor.
Figure 6 shows that by properly selecting the supply pressure of the non-reacting jets it is possible to match almost perfectly the pressure distribution obtained with thermal choking. The plot reports, for case B of table 2, the time-averaged pressure distribution in the isolator when the DMSJ operates in ram mode (stage 3 of figure 3). The red pressure profile was obtained by thermal choking and the blue curve by non-thermal choking.
Time-averaged pressure distribution in the isolator during ram-mode operation: comparison between thermally and non-thermally choked flow.

Selected cases for comparison between thermal and non-thermal choking (note,  $p_0 = \text {stagnation}$ pressure of the gas injected,
 $\dot {m}_j = \text {mass}$ flow rate of the gas injected,
 $\phi _o = \text {overall}$ equivalence ratio,
 $J = \text {jet}$ momentum ratio).

Two cases were selected for comparison of thermal and non-thermal choking effects as reported in table 2. Case A has an overall equivalence ratio  $\phi _o = 1.7$ and causes full unstart of the model scramjet (stage 4 of figure 3). Under these conditions, the pressure distribution in the isolator can be matched by injecting
 $3.33\ \textrm {g}\ \textrm {s}^{-1}$ of air. This case is used for comparison of the pseudo-normal shock propagation throughout the model up to disgorging. Case B has a lower equivalence ratio,
 $\phi _o = 1.3$, and produces stable ram-mode operation corresponding to stage 3 of figure 3, with the pseudo-normal shock stabilized at the location of the injector. As shown in figure 6, under these conditions the pressure distribution in the isolator can be matched by injecting
 $2.98 \ \textrm {g}\ \textrm {s}^{-1}$ of air. Case B was mainly used to study and compare shock train oscillations in the isolator.
A third case C was used to compare the effects of injecting the same amount of fuel and air on the reduction of the flow Mach number in the combustor. The quantity of ethylene injected is  $0.36\ \textrm {g}\ \textrm {s}^{-1}$, corresponding to
 $\phi _o = 0.62$. As shown in figure 4, this value is at the bottom of the range at which choking and dual-mode operation can be observed with the present set-up. In the non-reacting case the same amount of air is injected (
 $0.35\ \textrm {g}\ \textrm {s}^{-1}$) and despite the different gas properties, the jet momentum ratios in both cases were very similar. The intent of the comparison is to evaluate the relative importance of combustion heating and mass addition as causes of flow choking.
3.4. Pressure distribution comparison
If the isolator average pressure distributions are matched, as discussed in the previous section, the flow behaviour inside the scramjet model in the thermal and non-thermal cases was found to be qualitatively and quantitatively similar.
Figure 7 compares the pressure contours in  $x-t$ space obtained with thermal (a) and non-thermal (b) choking-induced unstart in the conditions of case A. The map covers the entire time interval from the beginning of injection (
 $t=0$ ms) to the disgorgement of the shock and combines both isolator (bottom) and combustor (top). The gap between the two regions corresponds to the location of the injectors, that is not covered by the pressure sensors. As injection is started, the bow shock created by the jets immediately separates the boundary layer, forming a steady shock train in the isolator. At this stage, the core flow in the combustor and isolator is still supersonic.
Isolator and combustor pressure contour in a  $x-t$ space for case A with thermal (a) and non-thermal (b) choking-induced unstart. Uncertainty on velocity measurements
 $\pm 15\,\%$.

Combustion heating in the reacting case and mass addition in the non-reacting case increase the pressure and reduce the Mach number until the flow chokes near the combustor exit. A pseudo-normal shock is formed and propagates upstream through the combustor. During this phase, the flow in the isolator is characterized by self-sustained oscillations of the shock system and vigorous pressure fluctuations. Once the pseudo-normal shock reaches the isolator, it starts interacting with the isolator shock train, disrupting the oscillatory motion. Ultimately the shock system reaches the inlet and disgorges outside, causing the flow to become entirely subsonic throughout the model.
An analysis of the two contour plots shows remarkable qualitative and quantitative similarities. Qualitatively, pressure features related to pseudo-normal shock propagation, boundary layer separation in the isolator and unstart can be identified in both cases, indicating that the same sequence of events previously described in § 3.1 for the thermal choking case also occurs with non-thermal choking. Quantitatively, the time-averaged pressure values measured by the sensors at corresponding stages agree to within 10 %, and the propagation speeds of the pressure waves, estimated from their slope in a  $x-t$ diagram, are within the measurement uncertainty (
 $\pm 15\,\%$). As evident from figure 7, what is not matched are the time instants at which the various phenomena occur. For example, in the non-reacting case choking occurs at
 $t_c=19.3$ ms and inlet unstart at
 $t_u=83.9$ ms, whereas in the reacting case it is
 $t_c=22.1$ and
 $t_u=49.7$ ms. These differences are believed to be driven more by the stochastic nature of turbulence-dominated flows than by the differences in the choking mechanism. To further support this claim, multiple tests performed at the same conditions, either with thermal or non-thermal choking, exhibited a scarce repeatability for the values of
 $t_c$ and
 $t_u$, whereas all the other parameters exhibited a remarkable consistency.
A striking feature observed in the unstart process was the onset of self-sustained shock oscillations after choking of the flow in the combustor. At high equivalence ratio ( $\phi _o > 1.4$) the oscillations are ultimately disrupted by the propagation of the pseudo-normal shock through the isolator and the disgorging of the shock system. However, for lower values of
 $\phi _o$, the isolator is able to arrest the pseudo-normal shock propagation and the shock oscillations continue indefinitely for the time fuelling is maintained. Figure 8 shows a detailed view of the pressure fluctuations associated with isolator shock oscillations in the conditions of case B. The entire time interval up to 100 ms after fuel injection is shown in figure 8(a), whereas figure 8(b) reports a detailed view of the interval between 70 and 80 ms. The analysis of the pressure fluctuations in figure 8(b) reveals interesting details about their structure. The pressure waves have a well-defined dominant frequency near 800 Hz. Two distinct families of waves originate from a region near
 $x = -110$ mm. One family propagates upstream towards the inlet with an average speed of
 $206\ \textrm {m}\ \textrm {s}^{-1}$, whereas the second family propagates downstream towards the injectors at
 $375\ \textrm {m}\ \textrm {s}^{-1}$.
Pressure contour of the isolator pressure fluctuations in a  $x-t$ space for case B with thermal choking. (a) Range
 $-20\text {--}100\ \textrm {ms}$. (b) Subrange 70–80 ms. Uncertainty on velocity measurements
 $\pm 15\,\%$.

Self-sustained pressure fluctuations were also observed with non-thermal choking. Figure 9 shows a pressure contour map for a case in which choking was induced by injecting  $2.98\ \textrm {g}\ \textrm {s}^{-1}$ of air. No significant difference with respect to the non-reacting case was noted. Frequency, amplitude and propagation frequency were all within the uncertainty limits of the calculation method used.
Pressure contour of the isolator pressure fluctuations in a  $x-t$ space for case B with non-thermal choking. (a) Range
 $-20\text {--}100 \ \textrm {ms}$. (b) Subrange 70–80 ms. Uncertainty on velocity measurements
 $\pm 15\,\%$.

3.5. Isolator shock dynamics visualization
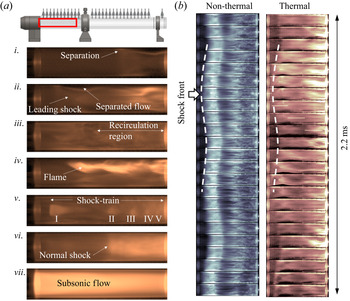
The flow configuration in the isolator was visualized by imaging the natural luminosity of the plasma as described in § A.2. Figure 10(a) shows several instantaneous images taken at different stages of test case B with thermal choking-induced unstart.
(a) Instantaneous plasma luminosity images of the isolator flow in the reacting case, at several stages of the shock evolution. The field of view is shown at the top. (b) Image sequence of the isolator shock oscillations for thermal (b) and non-thermal (a) choking with the same average pressure distribution.

Image i shows incipient flow separation and the development of the isolator shock train immediately after the beginning of fuelling (stage 1 of figure 3). Image ii was taken in a condition of choked flow (stage 2 of figure 3) with the pseudo-normal shock propagating through the combustor. The back pressure generated by the pseudo-normal shock pushes the isolator shock train further upstream and expands the separated flow region. Periodic shock oscillations are observed during this phase with a frequency matching the pressure fluctuations previously described. In these conditions the boundary flow appears still predominantly laminar and several details of the flow structure (shocks and separation point) are clearly distinguishable.
As the pseudo-normal shock approaches the fuel injectors in image iii, flow recirculation is further enhanced in the separated region that appears now mostly turbulent. Excited plasma species are entrained more effectively in the separated flow and the emission from the boundary region largely masks the internal structure of the core flow. Under these conditions, part of the fuel recirculates upstream where it is mixed into the air in the separated flow region. This occasionally allows partially premixed flames to propagate into the isolator as shown in image iv. In images v and vi the pseudo-normal shock has entered the isolator and is interacting with the local shock system (stage 3 of figure 3). During this phase the isolator shock system is strongly perturbed, the oscillations grow in amplitude and become less regular. Image v corresponds to a maximum stretch condition in which up to five shocks can be identified in the isolator. The shock train is led by a large  $\lambda$-type shock located near the entrance of the isolator and having a Mach disk approximately half the diameter of the channel. Four smaller and closely spaced shocks follow about two diameters downstream. Image vi corresponds to a condition of maximum compression of the shock system that collapses to a single normal shock located near the centre of the isolator. Finally, image vii shows completely subsonic flow in the isolator after the shock system is disgorged from the inlet (stage 4 of figure 3). A similar sequence of images can also be used to describe the process of non-thermal choking, indicating a similar development of the isolator flow in spite of the different choking mechanism.
Figure 10(b) shows a time sequence of images of the isolator flow during both thermal and non-thermal choking which capture shock train oscillations in the isolator. The pressure fluctuations associated with these oscillations have been discussed in § 3.4. The sequences span a total time of 2.2 ms during which the pseudo-normal shock is propagating through the combustor. A white dashed curve is used to mark the position of the separation point over time. An analysis of the images revealed the oscillations of the shock train in the two cases to have the same amplitude (in the order of one diameter) and period (approximately 1 ms), suggesting that combustion heat release has a minor effect on the isolator dynamics, which are mainly dominated by shock-boundary layer interaction.
3.6. Combustor shock propagation
High-speed plasma luminosity imaging was also used to investigate the flow in the combustor and in particular the propagation of the pseudo-normal shock during dual-mode operation (stage 2 of figure 3). The region of the combustor covered by the camera is shown in figure 11(a). Figure 11(b) shows an example of the pseudo-normal shock visualization for both thermal and non-thermal choking.
(a) Field of view for the high-speed combustor images. (b) Comparison between instantaneous plasma luminosity images of the pseudo-normal shock in a non-reacting (a) and reacting (c) flow. (c) Instantaneous pressure distribution in the combustor.

In the thermal case (bottom of figure 11b), combustion chemiluminescence is much brighter than the plasma emission. The brighter region near the centre of the combustor corresponds to the dissipation region where a combination of lower speed and higher temperature accelerates the combustion process and the production of excited radicals. Immediately upstream, it is possible to distinguish the first two bifurcated shocks of the pseudo-normal shock surrounded by a darker region of separated flow.
In the non-thermal case (top of figure 11b), since there is no combustion, all the radiation produced belongs to the hot plasma emission. No shock structure is visible in the image and the pseudo-normal shock appears merely as an intensification of the plasma brightness due to the density rise caused by the compression. Comparison with the instantaneous pressure distribution (figure 11c) allowed us to identify the brighter region as the dissipation region of the pseudo-normal shock. Upstream of the pseudo-normal shock, it is possible to notice darker streaks running streamwise along the wall corresponding to the air streams from the injectors.
Figure 12(a) shows a comparison between the propagation of the pseudo-normal shock in the thermal and non-thermal case. Each sequence is composed of 51 images equally spaced in time for a total duration of 12.5 ms. In the case without combustion the shock propagation is remarkably regular with nearly constant velocity, whereas in the combustion case the shock follows a more complicated pattern.
(a) Image sequence of the pseudo-normal shock propagation process in the combustor for non-thermal (a) and thermal (b) choking cases. The field of view is shown at the top-right corner. (b) Shock position vs time extracted from the images. (c) Shock propagation speed. In this case  $t=0$ ms corresponds to the first appearance of the pseudo-normal shock in the images.

Since in both cases the location of the pseudo-normal shock is revealed by a growth of emission intensity, it was possible to estimate the shock position as a function of time by integrating the pixel intensity over a cross-section and setting a proper threshold value to capture the intensity rising due to the pseudo-normal shock. The results are shown in figure 12(b), where time origin  $t=0$ ms in this case corresponds to flow choking at the exit. From the instantaneous position data, the propagation speeds of figure 12(c) were computed by differentiation. Thermal and non-thermal driven shocks have comparable average speeds,
 $-20.8\ \textrm {m}\ \textrm {s}^{-1}$ and
 $-17.3\ \textrm {m}\ \textrm {s}^{-1}$, respectively, but whereas for the non-thermal case, the standard deviation on the velocity is only
 $8\ \textrm {m}\ \textrm {s}^{-1}$, the propagation speed in the thermal case is much more unsteady with a standard deviation of
 $41\ \textrm {m}\ \textrm {s}^{-1}$. Furthermore, the propagation speed in the thermal case is characterized by periodic oscillations, alternating positive peaks (in which the shock moves back towards the combustor exit) as high as
 $66.3\ \textrm {m}\ \textrm {s}^{-1}$ to negative peaks as low as
 $-113.1\ \textrm {m}\ \textrm {s}^{-1}$. The period between the velocity peaks is of the order of 1 ms and, therefore, compatible with the isolator shock oscillations observed during pseudo-normal shock propagation. It is therefore logical to expect a cause–effect relation coupling the two oscillatory motions.
The occurrence of isolator oscillations also in the non-thermal choking case, where the pseudo-normal shock propagation speed is nearly constant, suggests two important observations. First, the oscillations of the isolator shock train are the driver for the unsteadiness in the pseudo-normal shock propagation and not vice versa, otherwise no shock oscillations would be observed in the isolator for the non-thermal case. Second, the driving forces exerted by the isolator shock train must have a chemical nature, otherwise unsteadiness in the pseudo-normal shock propagation would also be present in the non-thermal case. While a comprehensive understanding of the exact nature of the forcing mechanism certainly demands further investigation, some speculations can be made in advance. Shock oscillations in the isolator are expected to create fluctuations not only on the pressure but also on the flow temperature in the combustor. Changes in the temperature upstream of the pseudo-normal shock would impact the combustion efficiency in the diffusion region and, therefore, the rate of heat release that, as shown by previous studies (Laurence et al. Reference Laurence, Lieber, Martinez Schramm, Hannemann and Larsson2014; Baccarella et al. Reference Baccarella, Liu, McGann and Lee2019), is directly related to the propagation speed of the shock. Another possible explanation is related to mixing efficiency. Turbulence intensity at the injector location is expected to be fluctuating with the isolator shocks position and internal structure. This would impact the fuel–air mixing degree at the location of the pseudo-normal shock and, therefore, the combustion efficiency and heat release.
3.7. Contribution of mass addition to thermal choking
In the present work the term thermal choking has been used to indicate those circumstances in which heat release is the main cause determining flow choking. Nevertheless, other factors as mass addition, friction and other dissipative phenomena, may provide a significant contribution to the reduction of the Mach number to sonic conditions. In the framework of one-dimensional flow theory, a differential equation for the variation of the Mach number can be conveniently written as (Shapiro Reference Shapiro1953)
 \begin{equation} \frac{\textrm{d}M^2}{M^2} = \frac{1+(\gamma-1) M^2}{1-M^2} \left(1+\frac{\gamma-1}{2} M^2\right) \left(\frac{\textrm{d}T_t}{T_t} + 2 \frac{\textrm{d}\dot{m}}{\dot{m}} - 2 \frac{\textrm{d}F}{F} \right). \end{equation}
In (3.2) the impulse function  $F=p+\rho V^2$ has been preferred to the more common wall friction term
 $4 \,f \,{\textrm {d} x}/D$ because using
 $F$ the three coefficients of influence differ just by a factor two and the integration of (3.2) becomes straightforward. In addition, reasoning in terms of
 $F$ is more general and allow us to consider, in addition to wall friction, any other type of viscous dissipative phenomena such as shock waves. Integrating (3.2) between the combustor entrance (subscript ‘c’) and the exit (subscript ‘e’) yields
 \begin{equation} \ln \left[\frac{M_e}{M_c} \sqrt{\frac{2+(\gamma-1)M_e^2}{2+(\gamma-1)M_c^2} } \frac{1+\gamma M_e^2}{1+\gamma M_c^2} \right] = \ln \frac{F_c}{F_e} + \ln \left (1+\frac{\dot{m}_j}{\dot{m}_f} \right ) + \frac{1}{2} \ln \frac{T_{te} }{T_{tc} }, \end{equation}
where  $\dot {m}_f$ is the mass flow rate ingested by the inlet and
 $\dot {m}_j$ is the mass flow rate (fuel or air) injected through the nozzles. Equation (3.3) can be used to evaluate the relative contribution of the single terms on the right-hand side to the Mach number reduction function on the left-hand side. Since the Mach number at the exit is not measured directly, it is estimated from the static pressure value using the integral relation by Shapiro (Reference Shapiro1953),
 \begin{equation} \frac{p_e}{p_c} = \left (1+\frac{\dot{m}_j}{\dot{m}_f} \right) \sqrt{\frac{T_{te} }{T_{tc} }} \frac{M_c}{M_e} \sqrt{\frac{2+(\gamma-1)M_c^2}{2+(\gamma-1)M_e^2}}. \end{equation}
Equations (3.3) and (3.4) were applied to case C of table 2, in which the same amount of mass is injected for both reacting and non-reacting flows. A case with no injection was also considered for reference. The flow properties at the combustor entrance are the same reported in table 1. Figure 13(a) shows the pressure history in the three conditions (up to 170 ms after starting injection) at the farthest downstream pressure transducer, located at  $x=321.5$ mm, i.e. 8.5 mm upstream of the combustor exit. When no injection occurs (
 $\dot {m}_j=0$) the pressure at the exit is steady at 1.65 kPa (yellow curve), just slightly above the pressure at the combustor entrance 1.31 kPa. Applying (3.4) with
 $\gamma =1.4$ and
 $T_{te}=T_{tc}$ (any heat loss at the wall is neglected), an exit Mach number
 $M_e=2.60$ is obtained. As in a Fanno flow, this Mach number reduction has to be entirely attributed to friction and other viscous effects, and from (3.3), it follows that
 $\ln (F_c/F_e) = 0.032$. Injecting
 $0.35\ \textrm {g}\ \textrm {s}^{-1}$ of air,
 $\dot {m}_j/\dot {m}_f = 0.040$ and the pressure at the exit rises to 2.19 kPa (blue curve). In addition, since mass is injected at room temperature, it contributes to decrease the average total temperature of the gas mixture at the exit to
 $T_{te} = 2480$ K, therefore, it results in
 $T_{te}/T_{tc}=0.976$. According to (3.4) this pressure value corresponds to
 $M_e=2.20$, and the left-hand side of (3.3) takes the value 0.073. The contribution of irreversibility increases to
 $\ln (F_c/F_e) = 0.046$ and accounts for 63 % of the total. This is not surprising since in this case, in addition to wall friction, there is also a significant contribution from shocks. Mass addition contributes for 55 % whereas the effects of total temperature is negative (
 $-18\,\%$) because a reduction of
 $T_t$ would act to increase the Mach number.
Thermal – non-thermal comparison for the conditions of case C. (a) Static pressure near the combustor exit ( $x=321.5$ mm) as function of time. (b) Time-averaged pressure distribution along the combustor. The same data corresponding to a case with no injection (unperturbed flow) is also shown for reference.

Injecting the same amount of fuel (red curve) and assuming complete combustion towards the exit, the expected total temperature ratio is  $T_{te}/T_{tc}=1.32$, where a specific energy of
 $49\ \textrm {MJ}\ \textrm {kg}^{-1}$ has been considered for ethylene. Under these conditions, the exit pressure for a choked flow, i.e.
 $M_e=1$, is expected to be
 $p_e=7.18$ kPa that, considering the level of the approximations introduced, is consistent with the actual post choking average pressure
 $p_e=6.48$ kPa. At choking conditions the left-hand side of (3.3) is 0.21, the heating term contributes for 65 %, mass addition for 19 % and viscous interactions for the remaining 16 %. These results, summarized in table 3, support the conclusion that with ethylene injection, thermal choking is the main cause responsible for flow choking, with a marginal (although not negligible) contribution from mass injection and viscous dissipation.

In figure 13(a) it is interesting to observe how a choked flow condition is achieved. Differently from air, ethylene injection generates a highly unsteady pressure at the exit, with an average value of 4.02 kPa and peaks up to 6 kPa. These peaks can be attributed to transient turbulent mixing and combustion intensification phenomena leading to a larger heat release. Flow choking occurs between 140 and 145 ms when, plausibly, a peak of combustion heating is sufficiently intense to lower the exit Mach number below unity. Flow properties corresponding to the average and peak pressures have been obtained in table 3, by assuming the viscous losses to be the same as the choked flow case, but allowing the  $T_{te}$ to be lower because of incomplete combustion.
Figure 13(b) shows, for the three conditions discussed above, the time-averaged pressure distributions along the combustor. The time average interval is between 40 and 140 ms after the beginning of injection. When the jets are active, large variations in the wall pressure distribution are observed near the injectors because of the shock reflections initiated by jet-crossflow interaction. Despite in this region the pressure distribution obtained with air and fuel showing a similar behaviour, the pressure values in the reacting case are shifted up by 360–370 Pa compared with the non-reacting case, indicating a contribution of combustion-induced pressurization even at this early stage of the combustor. The divergence between the two curves grows further moving downstream as mixing efficiency increases and more fuel is burned.
3.8. Combustor flame structure
Flame visualization in the combustor, obtained by OH-PLIF, was used to investigate in greater detail the combustion process during pseudo-normal shock propagation. Figure 14 shows different stages of the flame development during a case with thermal choking-induced unstart. Because of the limitation imposed by the 10 Hz PLIF set-up, the images were not taken during a single test. Each one was taken in a different test at the same nominal conditions, adjusting the time delay from fuel injection to capture different stages of the process. The field of view covers the first 180 mm of the combustor from the edge of the injector ring (indicated by a white dashed line). Despite not being time resolved and, hence, unable to explain the pseudo-normal shock unsteady propagation phenomena, these images provide important information on the combustion and heat-release distribution in the supersonic and subsonic portions of the pseudo-normal shock.
Instantaneous OH-PLIF images of the combustor flow at several stages of the choking and shock propagation process. The field of view is shown at the top. Flow direction is from left to right.

In figure 14(a) fuelling has just started and the jet momentum ratio is still low. The fuel jets are not able to penetrate in deep into the core flow and remain attached to the wall. Non-premixed flames develop at the boundary layer edge (about 6–7 mm from the wall), where fuel and air get sufficiently mixed. The regular shape of the OH distribution suggests that the boundary layer is mostly laminar at this stage. As the fuelling rate increases in figure 14(b) the fuel jets interact more strongly with the flow. The flame is still located at the boundary layer edge, but the boundary layer in this case is thicker and turbulent as revealed by flame corrugation. Towards the end of the field of view, the flame has reached the centre of the combustor.
In figure 14(c) the flow in the terminal part of the combustor is choked and a pseudo-normal shock is starting to propagate. In the diffusion region of the pseudo-normal shock, the rapid mixing causes the combustion to transition from non-premixed to partially premixed, and the high temperature and low speed cause the Damkohler number to increase locally. The shock propagation continues and in figure 14(d) it has reached the centre of the field of view. Upstream the flow is still supersonic with a non-premixed flame confined at the boundary layer edge, whereas downstream the flow is subsonic and dominated by turbulent combustion. In figure 14(e) the shock has reached the injectors and the combustor flow is now mostly subsonic. A small region of supersonic flow, surrounded by a non-premixed flame, is still visible at the combustor entrance. Finally, in figure 14(f), in which inlet unstart has occurred, the flow through the axisymmetric scramjet model is entirely subsonic. Most of the OH is concentrated close to the injectors where the flame is anchored and the fuel is rapidly burned.
4. Low-enthalpy tests
Low-enthalpy tests were performed with the objective of studying more closely the phenomenon of shock train oscillations in the isolator. To this purpose, low enthalpy provides two important advantages. First, it allows for a reduction in the flow speed for a given Mach number so that similar phenomena occur on a longer time scale and, therefore, can be studied with a greater temporal resolution. Second, low enthalpy allows for high-speed planar imaging using condensed  $\textrm {CO}_2$ laser Rayleigh scattering. Avoiding line of sight integration and allowing shorter gate time, planar laser Rayleigh scattering (PLS) provides superior spatial and temporal resolution compared with plasma visualization performed at high enthalpy.
Flow choking is induced by mass addition that, as demonstrated in the previous section, is capable of well representing the effects of thermal choking on the isolator shock dynamics. Some adjustments to the experimental set-up were necessary in order to maximize the similarity between low-enthalpy and high-enthalpy conditions. In order to optimize the image resolution at the low free stream densities provided by the tunnel it was necessary to use a free stream composed entirely of carbon dioxide. This caused a reduction of the free stream Mach number from 4.5 to about 4 due to the lower specific heat ratio  $\gamma$ of
 $\textrm {CO}_2$ compared with air. To partially compensate for this effect and keep the isolator Mach number as close as possible to the air case (see table 1), a lower contraction ratio was used for the inlet (1.3 instead of 1.6). In addition, since the mass flow rate through the scramjet model at low enthalpy is about 3.6 times large than at high enthalpy, a modification to the injector geometry was necessary in order to achieve mass-induced choking. The sixteen 0.75 mm sonic nozzles at
 $45^{\circ }$ were replaced with four transverse supersonic nozzles to increase the overall mass flow rate and jet penetration capabilities. Finally, since the pseudo-normal shock propagation speed is reduced at low enthalpy, a shorter version of the combustor was used (200 mm instead of 300 mm).
4.1. Overall flow behaviour
As in § 3.4, pressure data in  $x-t$ space were used to characterize the overall unstart behaviour at low-enthalpy conditions and verify its consistency with the observations made at high enthalpy. Figure 15(a) shows
 $x-t$ pressure contours inside the model scramjet for a case with an injection mass flow rate of
 $5.5\ \textrm {g}\ \textrm {s}^{-1}$ of nitrogen (17.5 % of the inlet mass flow rate). Figure 15(b–e) show corresponding pressure distributions in the isolator and combustor at selected time instants. The information provided by pressure data is consistent with what is shown in figure 7 at high enthalpy and with the stages described in § 3.1.
(a) Time–space pressure map in isolator and combustor. (b–e) Pressure profiles at selected time instants. Uncertainty on velocity measurements  $\pm 15\,\%$.

Before injection, the pressure in the isolator is relatively uniform, with small variations due to the compression and expansion waves generated by the conical diffuser. The flow configuration in these conditions, visualized through PLS, is shown in figure 16(a). It is observed that the boundary layer, initially laminar, becomes transitional downstream of the first shock reflection and breaks down to turbulent after the second reflection. Moving downstream the shocks are weakened by the interaction with the expansion waves and become no longer visible after the second reflection. Further downstream the pressure distribution becomes monotonically increasing under the effect of wall friction, consistent with Fanno theory (Shapiro Reference Shapiro1953). The turbulent wake aligned with the centreline of the isolator is generated by a Mach disk formed at the reflection of the inlet conical shock. Even if not directly observable with this set-up, the presence of the Mach disk is consistent with previous studies on conical inlets (Leonard & Narayanaswamy Reference Leonard and Narayanaswamy2018).
Instantaneous frames from PLS isolator imaging with no injection (a), With mass injection (b) and with choked flow (c). The field of view is shown at the top.

When injection begins at  $t=0$ ms, the nitrogen jets start to interact with the supersonic crossflow, forming shocks that reflect on the combustor wall. As the nitrogen mass flow rate builds up towards its steady value, the locations of reflections move upstream. This explains the negative slope bands appearing in figure 15(a) between 0 and 20 ms.
The back pressurization in the combustor causes boundary layer separation and a shock train forms along the isolator. A PLS image of the separated flow in the isolator is shown in figure 16(b). The separation point emerges from the injector region at  $t=35$ ms and moves into the isolator at a nearly constant speed of
 $7.2\ \textrm {m}\ \textrm {s}^{-1}$ (figure 15). Both propagation speed and final extension of the separated region were found to be dependent on the back pressure level generated by the jets. The pressure profile under these conditions is shown in figure 15(b). The shock train creates a nearly uniform pressure gradient in the isolator, followed by a pressure drop across the injectors (due to the losses induced by the transverse jets) and by a smaller pressure gradient in the combustor caused by shock compression and wall friction. A positive pressure gradient indicates that the bulk flow in the combustor is still supersonic at this stage. This flow configuration resembles that of the scram operating mode (stage 1 in figure 3).
In agreement with one-dimensional compressible flow theory, the increase of pressure along the combustor in figure 15(c) is associated with a reduction of the flow Mach number. For large mass addition, sonic conditions can be reached at the combustor exit causing flow choking. Figure 15 shows choking occurring at about  $t=52$ ms, from which the pressure jump associated with the pseudo-normal shock is observed to depart at an average speed of
 $8\ \textrm {m}\ \textrm {s}^{-1}$. The pressure profile at this stage is shown in figure 15(c). Downstream of the pseudo-normal shock, the pressure gradient becomes negative, indicating that the flow is locally subsonic, as in dual-mode operation (stage 2 in figure 3). Similarly to what was observed in high-enthalpy conditions, once the combustor flow is choked, the isolator shock system becomes unstable and breaks down into a self-sustained oscillatory motion accompanied by large pressure fluctuations. This phenomenon will be addressed in greater detail in §§ 4.2 and 4.3.
At  $t=68$ ms the pseudo-normal shock has propagated up to the injectors and starts to interact with the isolator shock system, disrupting the oscillatory motion. Figure 16(c) shows an instantaneous PLS image of the pseudo-normal shock propagating through the isolator. The leading
 $\lambda$-type located about half-way through the field of view, induces massive boundary layer separation. The higher static temperature of the flow after the shock causes the
 $\textrm {CO}_2$ particles to sublimate preventing further light scattering. This explains why the region downstream appears almost completely dark. The instantaneous pressure profile at this stage is shown in figure 15(d) and is characterized by a fluctuating component superimposed on the mean isolator pressure profile. The combustor flow is entirely subsonic at this stage, as indicated by a monotonically decreasing pressure distribution, and the transition to ramjet mode is completed (stage 3 in figure 3).
At  $t=92$ ms the shock system has propagated throughout the diffuser and disgorges outside the inlet as a single normal shock. As the normal shock moves from the isolator to the free stream, the incident Mach number increases and the stagnation pressure of the flow is reduced accordingly. The readjustment of the pressure field to this change in stagnation conditions occurs through the propagation of a pressure wave downstream with a nearly constant speed of
 $252\ \textrm {m}\ \textrm {s}^{-1}$. It is of note that this propagation speed is consistent with the expected speed of sound for
 $\textrm {CO}_2$ in post-shock conditions inside the duct assuming a stagnation temperature of 298 K. The pressure distribution under these circumstances, shown in figure 15(e), appears relatively uniform and steady in both combustor and isolator. The flow is now subsonic throughout the entire model scramjet (stage 4 in figure 3). The pressure jump between the isolator and combustor can be attributed to the losses caused by the injectors. Differently from the high-enthalpy case, the flow after unstart was found to be remarkably steady, with no inlet buzz or restarting attempts.
Figure 17 shows a PLS sequence of the shock disgorgement taken at the inlet. The white dashed line represents the edge of the inlet (located on the right), whereas the left part corresponds to the incoming free stream. The normal shock is clearly visible because the  $\textrm {CO}_2$ particles sublimation leaves the flow downstream entirely dark. The frames are taken at an interval of
 $100 \ \mathrm {\mu }\textrm {s}$ and show the distance in mm between the shock front and the leading edge. In the first frame on the left, the shock is located 1.54 mm upstream of the inlet and shows a slight concavity upstream. After
 $200 \ \mathrm {\mu }\textrm {s}$ the distance has increased to 2.93 mm and the surface is almost flat. After
 $400\ \mathrm {\mu }\textrm {s}$ the shock has reached its steady location at 3.86 mm and the concavity has flipped to a downstream direction. This flow configuration in the model scramjet is maintained as long as mass injection continues. Once the source of blockage is removed, the inlet is usually able to restart with a delay of a few tens of milliseconds.
Planar laser Rayleigh scattering sequence of shock disgorging from the inlet. The time interval between frames is  $100\ \mathrm {\mu }\textrm {s}$. The field of view is shown on the right.

4.2. Self-sustained shock oscillations
Similar to the high-enthalpy case, self-sustained shock oscillations in the isolator were consistently observed following choking of the combustor flow. Isolator shock oscillations have been extensively studied over the past decades. Ikui et al. (Reference Ikui, Matsuo, Nagai and Honjo1974b) were among the first to study these phenomena in detail and they attributed the origin of the oscillations to small perturbations in the incoming flow. Yamane et al. (Reference Yamane, Kondo, Tomita and Sakae1984a), Yamane, Takahashi & Saito (Reference Yamane, Takahashi and Saito1984b) and later Sugiyama et al. (Reference Sugiyama, Takeda, Zhang, Okuda and Yamagishi1988) investigated how the oscillations are affected by the shock position along a straight duct documenting  $\lambda$-type to
 $x$-type shock train transition. Matsuo et al. (Reference Matsuo, Mochizuki, Miyazato and Gohya1993) investigated the relation between shock oscillations and pressure fluctuations observing resonant phenomena between the latter and the oscillations of the leading shock. Only a limited number of studies are available on shock train oscillations in scramjet engines with combustion. Ma et al. (Reference Ma, Li, Yang, Lin and Jackson2005) and Li et al. (Reference Li, Ma, Yang, Lin and Jackson2007) investigated shock oscillations in a hydrocarbon-fuelled scramjet reporting a feedback mechanism in which combustion-induced pressure waves in the flame zone propagate upstream through low-speed flow regions leading to possible instabilities. The existence of such instabilities was proved numerically by Choi, Ma & Yang (Reference Choi, Ma and Yang2005) and experimentally by Micka & Driscoll (Reference Micka and Driscoll2009). Further advancements in the understanding of the complex physics of unsteady shock trains were recently made by Xiong et al. (Reference Xiong, Wang, Fan and Wang2017) who studied the effects of boundary separation mode on self-excited oscillations, Hunt & Gamba (Reference Hunt and Gamba2018a) who investigated the effects of back pressure on shock train oscillation and shape transition and by Vanstone et al. (Reference Vanstone, Bosco, Saleh, Akella, Clemens and Gogineni2020) who demonstrated the possibility of closed-loop control of unstart in a scramjet isolator.
This section provides a discussion of the shock oscillations observed in the low-enthalpy experiments based on the PLS images and pressure data collected.
4.2.1. The PLS image sequences
When the injected mass flow rate was reduced from  $5.5\ \textrm {g}\ \textrm {s}^{-1}$ to
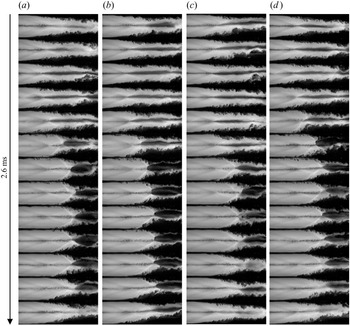
 $4.9\ \textrm {g}\ \textrm {s}^{-1}$ (15.5 % of the inlet mass flow rate) the propagation of the pseudo-normal shock was arrested and the isolator oscillations continued indefinitely as long as the injection valve was kept open. Figure 18 shows four cycles of shock oscillations. The oscillation period is about 2.6 ms, corresponding to a frequency of 380 Hz. During the oscillations both location (determined by the foot of the leading shock at the wall) and shape of the shock train are strongly affected. When the separation point moves upstream, the shock train assumes an
 $x$-type configuration, whereas when the separation moves back, it transitions to a
 $\lambda$-type configuration, characterized by a strong leading shock followed by a large region of lower speed and higher temperature. As shown by the images, this behaviour is remarkably consistent from oscillation to oscillation.
Shock oscillation PLRS sequence of four cycles of 2.6 ms each. The field of view is the same as figure 16.

4.2.2. Pressure fluctuations
The pressure fluctuations associated with the shock oscillations are shown in figure 19(a). The fluctuations start developing at approximately  $t=60$ ms and continue up to
 $t=140$ ms. A closer view of the interval 100–120 ms is shown in figure 19(b). Similarly to figures 9 and 8, two families of pressure fluctuations can be observed departing from a location near
 $x=-190$ mm. The forward propagating fluctuations travel at an average absolute speed of
 $130\ \textrm {m}\ \textrm {s}^{-1}$, whereas the backward propagating fluctuations travel at
 $240\ \textrm {m}\ \textrm {s}^{-1}$. The lower speed and frequency of the pressure fluctuations at low enthalpy allow us to better resolve the single fluctuations compared with the high-enthalpy case, revealing additional details.
Isolator time–space pressure map during self-sustained oscillations. (a) Entire range 0–160 ms. (b) Subrange 100–120 ms. Uncertainty on velocity measurements  $\pm 15\,\%$.

Looking at the structure of the backward propagating pressure fluctuations, it is possible to distinguish a fundamental component, with a period of 2.6 ms, and a finer structure of weaker pressure fluctuations at higher frequency. The long-period fluctuations oscillate at the same frequency as the motion of the shock train in figure 18 and, therefore, the two phenomena are expected to be strictly related. From the analysis of simultaneous images and pressure data, a direct correspondence between the edge of the pressure fluctuations (indicated by a white dashed line in figure 19b) and the location of boundary layer separation (oscillating roughly between  $x=-180$ and
 $x=-130$ mm in figure 18) was found. In addition, observing how the position of the local pressure peak moves in time, it is possible to establish the propagation direction of these pressure fluctuations. It is found that the pressure waves downstream of the separation point propagate downstream with an average speed of
 $240 \ \textrm {m}\ \textrm {s}^{-1}$, and the pressure fluctuations upstream of the shock propagate upstream at
 $130\ \textrm {m}\ \textrm {s}^{-1}$, indicating the separation point as the source of these pressure fluctuations.
4.2.3. Analysis in the frequency domain
Figure 20 shows the power spectral density (PSD) of the pressure signals in the isolator for frequencies in the range  $10^2\text {--}10^{3.5}$ Hz. Note that the curves have been artificially shifted in the vertical direction for clarity. Each curve exhibits a strong peak at 380 Hz, corresponding to the long-period fluctuations discussed above. A second, weaker peak near 741 Hz is observed in the pressure traces located in the downstream half of the isolator. This second peak tends to become less pronounced moving upstream and vanishes for the two most upstream sensors. Therefore, the short-period fluctuations seem to be able to propagate only in the subsonic part of the isolator, i.e. downstream of the boundary layer separation point at the foot of the leading shock. This agrees with previous observations by Yamane et al. (Reference Yamane, Kondo, Tomita and Sakae1984a,Reference Yamane, Takahashi and Saitob) and Sugiyama et al. (Reference Sugiyama, Takeda, Zhang, Okuda and Yamagishi1988), that suggested an acoustic nature of the short-period pressure fluctuations. In fact, since the leading shock oscillates between
 $x=-130$ and
 $x=-180$ mm, the sensors at
 $x>-130$ mm are always located in the separated flow, where the acoustic waves can propagate freely, and the short-period peak is stronger. The sensors between
 $x=-130$ and
 $x=-180$ mm are within the range of the leading-shock oscillations, where the flow is subsonic only a fraction of the time. Finally, the sensors at
 $x<-180$ mm are never reached by the separated flow and, thus, the acoustic waves are unable to propagate further upstream and the short-period peaks were not present.
Power spectral density of pressure signals in the isolator during self-sustained oscillations. The curves have been artificially shifted for clarity.

4.3. Dynamics of a single oscillation
In this section the attention is focused on a single oscillation of the isolator shock train in order to investigate more closely the details of the governing shock-boundary layer interaction. A single oscillation has a period of 2.6 ms and is composed of an extension phase in which the separation point advances towards the inlet, increasing the total length of the shock train, and a contraction phase in which separation moves back towards the injectors, reducing the overall shock length. During the extension phase – that has typically a duration of 0.6 ms – the shock train assumes an  $x$-type configuration as in figure 21(a), whereas in the contraction phase taking the remaining 2 ms of the period – the shock train has a
 $\lambda$-type shock configuration as in figure 21(c), with a strong bifurcated leading shock. The type of the shock train has important implications for what concerns pressure distribution and boundary layer interaction as discussed below.
Planar laser Rayleigh scattering images of the isolator shock train during self-sustained oscillations: (a) extension, (b) transition, (c) contraction and (d) swallowing.

A better understanding of the mechanism driving the shock oscillations can be obtained with the aid of figure 22. Figure 22(a) shows a cartoon picture of the oblique shock train at the beginning of the extension phase. Under these conditions the pressure rise across the shock train spreads over the entire length of the shock train and is balanced by the pressure distribution in the diffusion region, as shown in figure 22(c). If this equilibrium situation is perturbed by an increase of pressure downstream, pressure waves can propagate in the subsonic separated region (grey area), but not in the supersonic core (white area) creating an imbalanced situation in which the pressure near the wall is greater than the pressure at the centre. This pressure difference tends to expand and push the separated region upstream with a subsequent compression effect on the shock train. As the core flow is constrained, the shocks become stronger in attempt to restore mechanical equilibrium. The angle of the leading oblique shocks increases until Mach disks are formed near the axis and the shock-train transitions from an  $x$- to
 $\lambda$-type configuration, as shown in figure 22(b). A detailed sequence of the transition of the leading shock from oblique to bifurcated is shown in figure 21(b). The third image of the sequence shows how the larger pressure gradient induced by the
 $\lambda$ shock promotes a further expansion of the separated region downstream.
Schematic of the shock train shape transition in response to pressure distributions in the core flow (white) and separated region (grey).

The  $x \rightarrow \lambda$ transition of the shock train drastically changes the pressure distribution within the shock train. It is known from previous studies (Tamaki et al. Reference Tamaki, Tomita and Yamane1970) that in a
 $\lambda$ shock train the larger part of the pressure rise occurs across the first normal shock. The pressure profile in the core flow is therefore characterized by an abrupt change in correspondence of the leading shock. This pressure discontinuity cannot be sustained in the subsonic separated flow where it is smeared out by acoustic, viscous and turbulent effects, leading to the pressure distributions of figure 22(d). Upstream of the normal shock, the pressure in the core flow is lower than the pressure at the boundary and the boundary region tends to be lifted up. On the other hand, downstream of the shock, the core pressure is larger and tends to compress the boundary region. This change in the geometry of the interface between core and boundary flows promotes the swallowing of the normal shock through the formation of a virtual throat. A sequence of the shock swallowing process is shown in detail in figure 21(d). In the first image of the sequence the
 $\lambda$ shock is located right upstream of the virtual throat, whereas in the last image the shock has been swallowed and the core flow has re-accelerated to supersonic speed.
5. Conclusions
This study investigates experimentally the interaction between isolator and combustor occurring during unstart in a freejet axisymmetric model scramjet with emphasis on the role played by combustion. Using a high-enthalpy air free stream at Mach 4.5, a comparison was made between unstart induced by thermal and non-thermal choking mechanisms. Thermal choking was achieved by combustion heat release using ethylene fuel and non-thermal choking was achieved by mass addition of an inert gas (air). Time-resolved wall pressure measurements and plasma luminosity visualizations were used to investigate the flow dynamics during the unstart process. Planar laser-induced fluorescence of the OH radical was used to visualize the flame structure in the combustor at several stages of the scram-ram transition.
The results showed that for matched time-averaged isolator pressure distributions, the unstart processes between the two cases are qualitatively very similar. For an entirely supersonic combustor flow (scram mode), the back pressure rise induced by fuel injection separates the boundary layer in the isolator forming a steady shock train. As choking occurs near the exit and a pseudo-normal shock propagates upstream, the combustor flow becomes partially subsonic (dual mode). Under these conditions the isolator shock train becomes unstable and develops a series of self-sustained oscillations accompanied by pressure fluctuations. Significant differences were observed in the pseudo-normal shock propagation initiated by non-thermal and thermal mechanisms. Whereas the former case was characterized by a nearly uniform propagation speed, the latter exhibited large velocity fluctuations at the same frequency as the shock oscillations in the isolator. These observations reveal a direct effect of the isolator flow on the pseudo-normal shock propagation (in the combustor) during scram-to-ram transition. Nevertheless, no evidence of a feedback effect of the unsteady combustor flow on the isolator was observed. Once the pseudo-normal shock reaches the isolator, the combustor flow becomes entirely subsonic (ram mode) and the oscillations are disrupted as the pseudo-normal shock propagates towards the inlet. The unstart process is completed by the disgorging of the shock system from the inlet, resulting in an entirely subsonic flow along the full length of the scramjet model.
Further details on the driving mechanism of the self-sustained shock oscillations in the isolator were provided by low-enthalpy experiments performed in a  $\textrm {CO}_2$ free stream with mass addition-induced choking (nitrogen injection). During the oscillations the shock train is periodically stretched and compressed, alternating between an
 $x$-type and a
 $\lambda$-type configuration. Two families of waves were observed to originate from the boundary layer separation point (the location where the head of the shock train impinges on the boundary layer causing separation). Long-period pressure waves exhibited the same frequency as that of the shock train oscillations, and propagated in both the upstream and downstream directions. Weaker short-period pressure waves were detected only in the subsonic portion of the isolator flow, suggesting an acoustic nature of the wave propagation phenomenon, which is in agreement with previous investigations.
In summary, this study seems to support the common assumption of isolator-combustor interactions in choked flow conditions being largely dominated by shock-boundary layer interaction and acoustic phenomena, with no major combustion feedback effect.
Funding
This work was supported by the U.S. Air Force Office of Scientific Research (AFOSR) (grant number FA9550-14-1-0343, FA9550-17-1-0008). The authors gratefully acknowledge these sources of support.
Declaration of interests
The authors report no conflict of interest.
Appendix A. Diagnostics description
A.1. High-speed  $\textrm {CO}_2$ PLS

High-speed flow visualization at low enthalpy was performed using condensed  $\textrm {CO}_2$ PLS. The basic principles of
 $\textrm {CO}_2$ PLS can be summarized as follows: when a gas flow seeded with carbon dioxide is expanded through a nozzle and its static temperature drops below the
 $\textrm {CO}_2$ condensation point, clusters of
 $\textrm {CO}_2$ molecules form with a typical size ranging from a few to tens of nanometres (Erbland, Rizzetta & Miles Reference Erbland, Rizzetta and Miles2000). Projecting a laser sheet across the flow field with a wavelength much larger than the particles size, some of the photons are scattered by the particles in the Rayleigh regime. Assuming a nearly uniform distribution of the
 $\textrm {CO}_2$ particles, the intensity of the scattered light at each point would be proportional to the local density of the gas.
Compared with techniques based on the variation of index of refraction with density (for example, schlieren or shadowgraph), PLS has the advantage of providing an image on a single plane, avoiding line-of-sight integration. Furthermore, it provides higher contrast allowing us to resolve features such as weak shocks and turbulent structures that are often not captured by other methods.
The experimental set-up used in ACT-II for time-resolved PLS imaging is shown in figure 23. A high-repetition (10 kHz) frequency doubled (532 nm) Nd:YAG laser (Edgewave InnoSlab IS120-2-LD) was used as a light source. The laser beam, with a pulse energy of  $300\ \mathrm {\mu }\textrm {J}$, was directed inside the vacuum chamber, aligned with the axis of the model scramjet, and converted into a thin sheet (
 ${<}0.5$ mm at the focal distance) via an optical system consisting of one cylindrical plano-concave lens (
 ${f} = -30\ \textrm {mm}$) and two cylindrical plano-convex lenses (
 ${f} = 125\ \textrm {mm}$ and
 ${f} = 500 \ \textrm {mm}$, respectively). The images were collected using a high-speed camera (Photron FASTCAM SA-Z) provided with a Nikon Nikkor 50 mm f/1.2 lens. The camera shutter sync signal was used to trigger the laser. The camera was mounted on a rail to move the field of view between inlet and isolator. In all the images captured the flow direction is from left to right.
High-speed visualization set-up using condensed  $\textrm {CO}_2$ planar laser Rayleigh scattering.

A.2. High-speed plasma luminosity visualization
High-speed visualization of the high-enthalpy flow was performed by capturing the natural broadband luminescence of the hot plasma at 20 kHz using a high-speed camera (Photron Fastcam SA-5). When the flow passes through the electric arc, a fraction of the free electrons produced by the discharge is not able to recombine in the plenum chamber and freezes in non-equilibrium during the expansion through the nozzle. The free electrons contained in the free stream emit broadband radiation, mainly through photorecombination and bremsstrahlung interaction with the ions. The visible band of the emission can be exploited to visualize the flow. Assuming the electrons are uniformly distributed, the signal intensity will be roughly proportional to the local gas density. Despite line-of-sight integration, the images obtained were revealed to be effective in visualizing the shock structure. This technique is used in both high-enthalpy reacting and non-reacting cases to study the dynamics of the flow in the isolator and the propagation of the pseudo-normal shock in the combustor and the isolator. Despite all the images captured are monochromatic, two different colour maps have been used for thermal (orange) and non-thermal (cyan) choking to make the distinction between the two cases obvious. In all the images the flow direction is from left to right.
A.3. Hydroxyl-PLIF
The hydroxyl radical (OH), formed during high-temperature combustion, can be regarded as a marker of combustion zones in supersonic reacting flows (Seitzman & Hanson Reference Seitzman and Hanson1993). In this study OH-PLIF imaging was carried out to visualize the flame structure in the combustor. The OH-PLIF set-up is shown in figure 24. The  $Q_1$(6) transition of the
 $A^2\varSigma ^+-X^2\varPi$ (1,0) vibronic band of the OH molecule near 283 nm was selected due to its low temperature dependency (Kychakoff, Howe & Hanson Reference Kychakoff, Howe and Hanson1984). A tunable dye (Rhodamine 590) laser (Sirah Cobra-Stretch CBST-P) – doubled in frequency and pumped with the second harmonic of a 10 Hz Nd:YAG laser (Spectra-Physics Quanta-Ray Pro-250) – has been used to produce the desired laser radiation with a pulse energy of 25 mJ. The laser beam is converted into a thin sheet using the same optical set-up described in § A.1. The laser sheet is projected into the scramjet combustor section from the model exhaust, in counter-streamwise direction. An intensified scientific complementary metal-oxide semiconductor (sCMOS) imaging camera (Andor iStar-sCMOS-18F-E3) is used to capture the laser-induced OH fluorescence with a gate width of 100 ns. The camera lens used for the imaging is an ultraviolet lens (Cerco UV 100 f/2.8) fitted with a narrow bandpass filter (Asahi Spectra ZBPA310) at
 $310\pm 5\ \textrm {nm}$.
Hydroxyl-PLIF and high-speed plasma luminosity visualization set-up.