1. INTRODUCTION
Tugs play a significant role in assisting large ships with limited manoeuvring capabilities at slow speeds in restricted waters, such as in harbours and canals. However, the hydrodynamic interaction effects due to interacting pressure fields around the vessels can have a significant impact on their safety and handling during such manoeuvres. The adverse hydrodynamic effects are more severe for the attending tugs as they are much smaller in size in comparison to the assisted ships (Hensen et al., Reference Hensen, Merkelbach and Wijnen2013). The Maritime Coastguard Agency (MCA) in the United Kingdom states that when vessels are being manoeuvred at close quarters for operational reasons, the greatest potential danger exists when there is a large difference in size between the two vessels, such as when a ship is being attended by a tug (MCA, 2001). Thus, it is vital for tug operators to be aware of adverse interaction effects that can occur during such vessel manoeuvres by quantifying the relevant effects through comprehensive research studies.
To date, most of the studies on vessel interaction have been carried out for similar sized vessels (Chen and Fang, Reference Chen and Fang2001; Falter, Reference Falter2010; Fortson, Reference Fortson1974; Lataire et al., Reference Lataire, Vantorre, Delefortrie and Candries2012; Lu et al., Reference Lu, Yang and Lohner2009; Newton, Reference Newton1960; Tuck and Newman, Reference Tuck and Newman1974; Zou and Larsson, Reference Zou and Larsson2013), with only a small number focusing on dissimilar sized vessels operating in close proximity (Dand, Reference Dand and Troup1975; Fonfach et al., Reference Fonfach, Sutulo, Soares, Pettersen, Berg, Eloot and Vantorre2011; Geerts et al., Reference Geerts, Vantorre, Eloot, Huijsmans, Fierens, Pettersen, Berg, Eloot and Vantorre2011; Jong, Reference Jong2007; Simonsen et al., Reference Simonsen, Nielsen, Otzen, Agdrup, Pettersen, Berg, Eloot and Vantorre2011; Vantorre et al., Reference Vantorre, Verzhbitskaya and Laforce2002). Dand (Reference Dand and Troup1975) carried out scaled-model experiments on tug-ship interaction to determine the physical causes of interaction and the resulting effects. This approach is still useful for tug-ship interaction prediction when both vessels are advancing on parallel courses. However, parallel operation is only one of many manoeuvres encountered in practical operating conditions. Vantorre et al. (Reference Vantorre, Verzhbitskaya and Laforce2002) conducted physical scaled model tests to determine ship interaction effects for head-on and overtaking encounters of similar and dissimilar vessels in parallel. The study conducted by Fonfach et al. (Reference Fonfach, Sutulo, Soares, Pettersen, Berg, Eloot and Vantorre2011) also used a tug operating in parallel to a tanker to predict interaction effects acting on tugs.
In contrast to previous studies, Geerts et al. (Reference Geerts, Vantorre, Eloot, Huijsmans, Fierens, Pettersen, Berg, Eloot and Vantorre2011) assessed the hydrodynamic interaction effects on a tug with small drift angles (between −5° to 10°) operating in close proximity to a container ship moving forward at the same speed. Their study was, however, limited to a tug operating at the bow area of the ship and to a few drift angles that tugs may operate at during ship-assist manoeuvres. Simonsen et al. (Reference Simonsen, Nielsen, Otzen, Agdrup, Pettersen, Berg, Eloot and Vantorre2011) conducted a study to predict the interaction effects acting on a drifted tug located at various longitudinal and lateral locations to a larger ship. However, the tests were conducted only for a tug located in the midships region of the ship at limited tug drift angles (zero to 60°), thus providing a limited set of data.
As stated above, research studies available in the public domain do not explicitly address the interaction behaviour between a tug and a ship operating at different ship locations and tug drift angles. Therefore, it is difficult to establish how well these results represent the overall interaction behaviour of a tug during real ship-assist manoeuvres. Thus, there is a need to investigate possible tug-ship combinations during ship-assist manoeuvres to comprehend the significance of the hydrodynamic interaction effects on tugs.
This paper presents the results of full-scale Computational Fluid Dynamics (CFD) simulations conducted to investigate the interaction effects on a tug operating at different longitudinal and lateral locations relative to a tanker. At each location the tug's drift angle was varied from zero to 90°. Simulations were conducted for two full-scale speeds, 3 knots and 6 knots, representing the widely used minimum and maximum ship-assist manoeuvre speeds (Hensen, Reference Hensen2003). Selected CFD simulation results were validated at model-scale against experimental measurements obtained in the Model Test Basin at the Australian Maritime College (AMC). Previous work by Jayarathne et al. (Reference Jayarathne, Ranmuthugala, Leong and Fei2017a) compared the interaction effects acting on a tug operating in close proximity to ships of varying sizes in order to correlate model-scale and full-scale interaction effects. The results showed good agreement between non-dimensionalised interaction effects for differently scaled vessels, thus providing confidence to use full-scale CFD simulations in this study. The findings of this study are important for tug operators in order to assist the understanding of safe operating envelopes for their vessels during close quarter ship-assist manoeuvres.
2. CASE STUDY
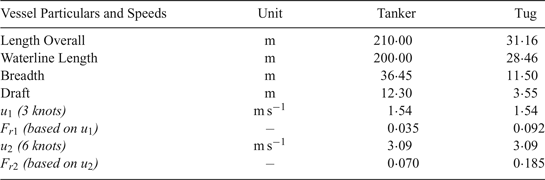
The interaction effects induced on a tug in close proximity to a larger ship were investigated through CFD and experimental work using a generic hull form of a stern drive tug and a Maritime Administration (MARAD) F series tanker hull form (Roseman, 1987). The main particulars of the full-scale tug and tanker are given in Table 1.
Vessel Particulars and Speeds used for the study

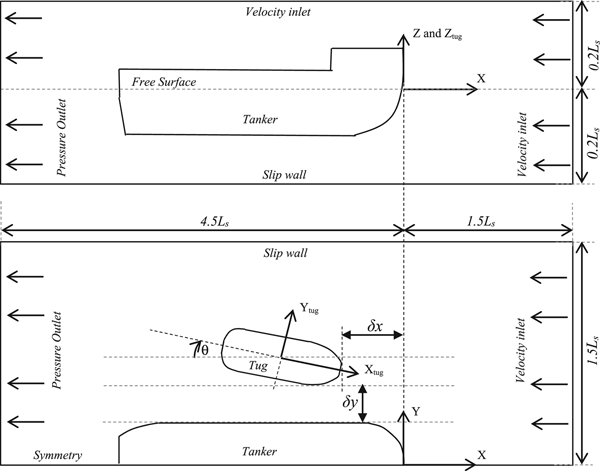
The longitudinal force (X), lateral force (Y), and yaw moment (N) acting on the tug for different cases were measured and non-dimensionalised using volumetric displacements in accordance with Equations (1) to (3) (Fonfach et al., Reference Fonfach, Sutulo, Soares, Pettersen, Berg, Eloot and Vantorre2011; Jayarathne et al., Reference Jayarathne, Ranmuthugala, Leong, Fei and Chai2017b; Simonsen et al., Reference Simonsen, Nielsen, Otzen, Agdrup, Pettersen, Berg, Eloot and Vantorre2011), respectively. The forces were measured in the global coordinate system; while the yaw moment was defined about the tug-local coordinate system (see Figure 1).
Computational domain used in CFD simulations showing coordinate systems, boundaries and relative distances. Top – side view showing tanker. Bottom – plan view showing local (tug) coordinate system and global coordinate system with vessel locations.

 $$C_{X}=\displaystyle{{2X}\over{u^2\nabla_t^{1/3}\nabla_s^{1/3}\rho}} $$
 $$C_{Y} =\displaystyle{{2Y}\over{u^2\nabla_t^{1/3}\nabla_s^{1/3}\rho}} $$
 $$C_{N}=\displaystyle{{2N}\over{u^2\nabla_t^{1/3}\nabla_s^{1/3}L_t\rho}} $$
where C N is the yaw moment coefficient, C X is the surge force coefficient, C Y is the sway force coefficient, L t is the waterline length of the tug (m), u is the velocity of the vessel (m s−1), □ is the density of water (kg m−3), ∇s is the volumetric displacement of the tanker (m3) and ∇t is the volumetric displacement of the tug (m3).
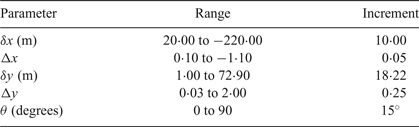
The approaches used to non-dimensionalise the lateral and longitudinal distances are given in Equations (4) and (5) respectively. Justification for the use of these terms were published previously by the authors in Jayarathne et al. (Reference Jayarathne, Ranmuthugala, Leong and Fei2017a). Table 2 provides a summary of the cases investigated in this study.
Parameter range for the cases investigated in this study

 $$\Delta y =\displaystyle{{\delta y}\over{B_s}} $$
 $$\Delta x =\displaystyle{{\delta x}\over{L_s}} $$
B s is the breadth of the tanker (m), L s is the waterline length of the tanker (m), Δ X is the non-dimensionalised longitudinal distance between vessels, δ x is the longitudinal distance between vessels (m), Δ Y is the non-dimensionalised lateral distance between vessels and δ y is the Lateral distance between vessels' midships (m).
3. CFD SIMULATION
Validated CFD models previously developed by the authors (Jayarathne et al., Reference Jayarathne, Leong and Ranmuthugala2016; Reference Jayarathne, Ranmuthugala, Leong and Fei2017a; Reference Jayarathne, Ranmuthugala, Leong, Fei and Chai2017b) were employed to analyse the case studies discussed above. The CFD simulations were modelled using the commercial CFD software StarCCM + Ⓡ which is a finite volume method-based CFD package, utilising an unstructured hexahedral mesh approach. The CFD simulations employed the Reynolds Averaged Navier-Stokes (RANS)-based Shear Stress Transport (SST) model for the analysis. The free surface of the domain was modelled as a Eulerian Multiphase using the Volume Of Fluid (VOF) technique, with the implicit unsteady simulation technique. The free surface was dependent on the VOF flat wave, with a 0·5 of volume fraction implying that a computational cell is equally filled with air and water. The mesh within the free surface region was refined in order to enable the variations in volume fraction to be more accurately captured. A second-order convection scheme was used to accurately capture sharp interfaces between the phases. The nominal total inflation layer thickness of two times Prandtl's 1/7th power law  $\lpar 2\times 0\cdot16\, L_{t}/Re_{Lt}^{1/7}\rpar $ turbulent boundary layer thickness estimate (Leong et al., Reference Leong, Ranmuthugala, Penesis and Nguyen2014; White, Reference White2003) was used to model the inflation layers around the vessels. As investigated previously in Jayarathne et al. (Reference Jayarathne, Ranmuthugala, Leong, Fei and Chai2017b), an SST turbulence model with the tug's near wall mesh spacing y +, was maintained at around 1. This in turn helped to resolve the boundary layer all the way to the wall with a finer mesh to accurately capture any separation and improve the accuracy of the results.
Throughout the analysis, the tug was located on the port side of the tanker. Model scale CFD simulations replicated the experimental captive model test conditions to aid validation of the former. Both the tanker and tug geometries were fixed (that is, zero degrees of freedom) for all of the cases investigated. The upstream end and top boundaries of the domain were kept as inlet boundaries and the downstream end defined as a pressure outlet (see Figure 1). As recommended by CD-Adapco (2015), the velocity inlet at the top boundary was used in preference to a slip wall boundary to reduce the simulation convergence time without affecting the accuracy of the results. The use of the velocity inlet boundary condition at the top prevents the fluid from ‘sticking’ to the walls as well as creating a blockage. Thus, it avoids the occurrence of a pressure gradient between the fluid and the wall, as would be the case if a slip-wall boundary condition was used (Tezdogan et al., Reference Tezdogan, Demirel, Kellett, Khorasanchi, Incecik and Turan2015).
4. CFD VERIFICATION AND VALIDATION
The verification and validation studies for the CFD predictions and non-dimensionlisation convention (Equations (1) to (5)) of the interaction effects for vessels of different sizes and scales are described in detail by the authors in Jayarathne et al. (Reference Jayarathne, Leong and Ranmuthugala2016; Reference Jayarathne, Ranmuthugala, Leong and Fei2017a; Reference Jayarathne, Ranmuthugala, Leong, Fei and Chai2017b). Only a summary is presented in this section. For verification and validation purposes, the tug was located near the bow of the tanker (that is, Δ x = 0) and with  $\Delta y = 2\cdot190$ and 2·276 lateral separations at a forward speed of 1·74 m/s (tug length-based Froude number of 0·104 were used). Froude scaling was used for measuring the dynamic parameters.
To quantify the simulation uncertainty based on the mesh resolution for the model-scale and full-scale predictions, the Richardson Extraplotion method outlined in ITTC (2002a) was used. Mesh models for both scales at three different resolutions (see Table 3): fine (see Figure 3), medium and coarse were created, with an approximate mesh refinement ratio of  $\sqrt 2$. The mesh refinement was carried out on the vessel surfaces and in the pressure and wake regions around the vessels.
Mesh resolution of the simulations used for the sensitivity study (M - Millions)

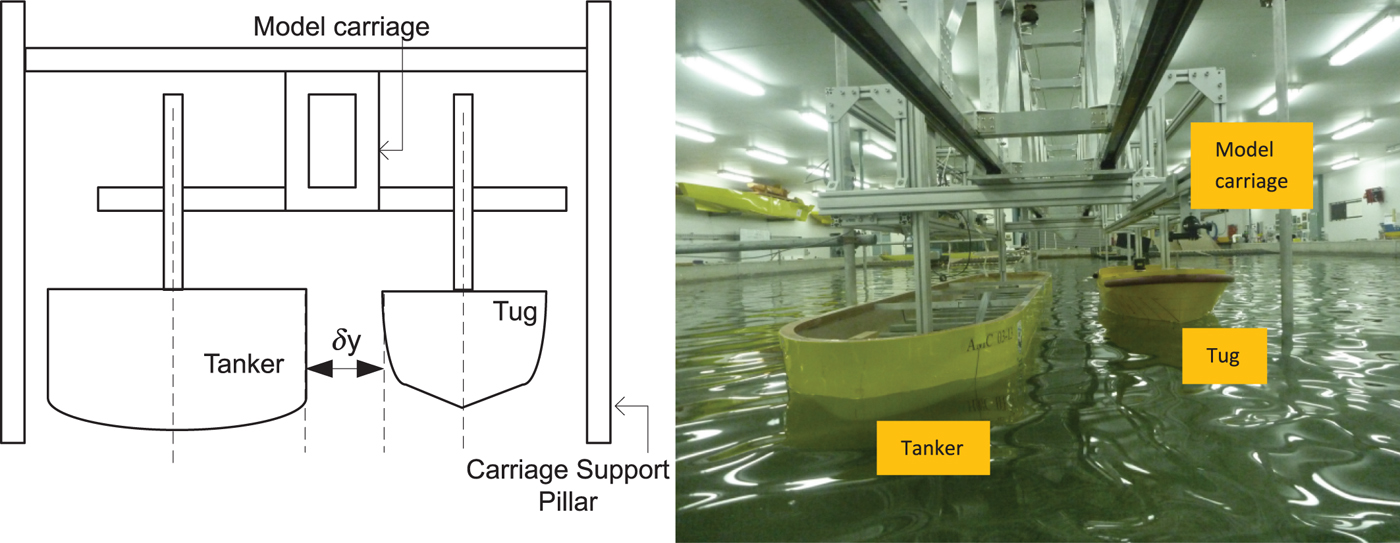
In order to validate the CFD simulations, a series of captive model experiments were conducted in the AMC Model Test Basin to measure the experimental interaction effect on the tug operating in close proximity to a tanker. The dimensions of the Test Basin are 35 m (length) × 12 m (width) × 1·0 m (depth), with the experimental set-up shown in Figure 2. The 1:50 model-scale tanker and tug models were fixed in all degrees of freedom in a similar configuration to that in the CFD simulations, with no relative motion between them. As the forces and moment acting on the tanker were not measured, it was directly attached to the model carriage, while the tug was attached using two strain gauges in order to record the forces acting on it. The experiments were conducted at the fully loaded drafts of both hulls at two model-scale speeds of 0·41 m/s and 0·62 m/s. Experimental uncertainty limits were calculated in accordance with ITTC (2002b), giving 7%, 9·4% and 7% for the measured longitudinal force, lateral force, and yaw moment, respectively (see Jayarathne et al. (Reference Jayarathne, Ranmuthugala, Leong, Fei and Chai2017b) for details on the uncertainty estimation).
Left: Schematic of the experimental set-up in AMC's Model Test Basin. Right: Experimental set-up in AMC's Model Test Basin.

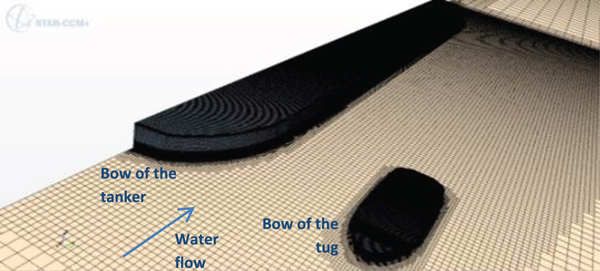
Selected Full Scale Mesh – 14·6 Million Cells.

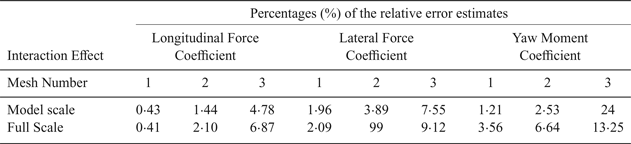
Table 4 presents the error percentage estimates compared to the Richardson extrapolated values (Stern et al., Reference Stern, Wilson, Coleman and Peterson2001). The model-scale CFD and model-scale experimental interaction effect coefficients were in good agreement, with the difference being less than the experimental uncertainty, that is, less than 7%, 9·4% and 7% of the longitudinal force, lateral force, and yaw moment, respectively (Jayarathne et al., Reference Jayarathne, Ranmuthugala, Leong, Fei and Chai2017b). Furthermore, the model-scale and full-scale interaction effect coefficients predicted by the CFD simulations were in good agreement with the maximum difference between them at less than 8% (Jayarathne et al., Reference Jayarathne, Ranmuthugala, Leong, Fei and Chai2017b). Thus, it provides confidence in the use of full-scale results and the non-dimensional conventions presented in this study.
Relative error percentage estimates of the longitudinal and lateral forces and the yaw moment with respect to the Richardson extrapolated values

5. DISCUSSION
This section discusses the longitudinal force, lateral force and yaw moment induced on the tug due to hydrodynamic interaction. It is divided into four sub-sections to improve the clarity of the large amount of interaction data presented. The first two sections present the interaction effects on the tug at two tug drift angle (θ) ranges, that is, zero to 45°, and 60° to 90°, respectively, in comparison to that of an open-water tug (no interaction). The last two sections discuss the effects of Froude number and the lateral separation on the interaction effects respectively.
5.1. Interaction effects at a tug drift angle between 0° to 45°
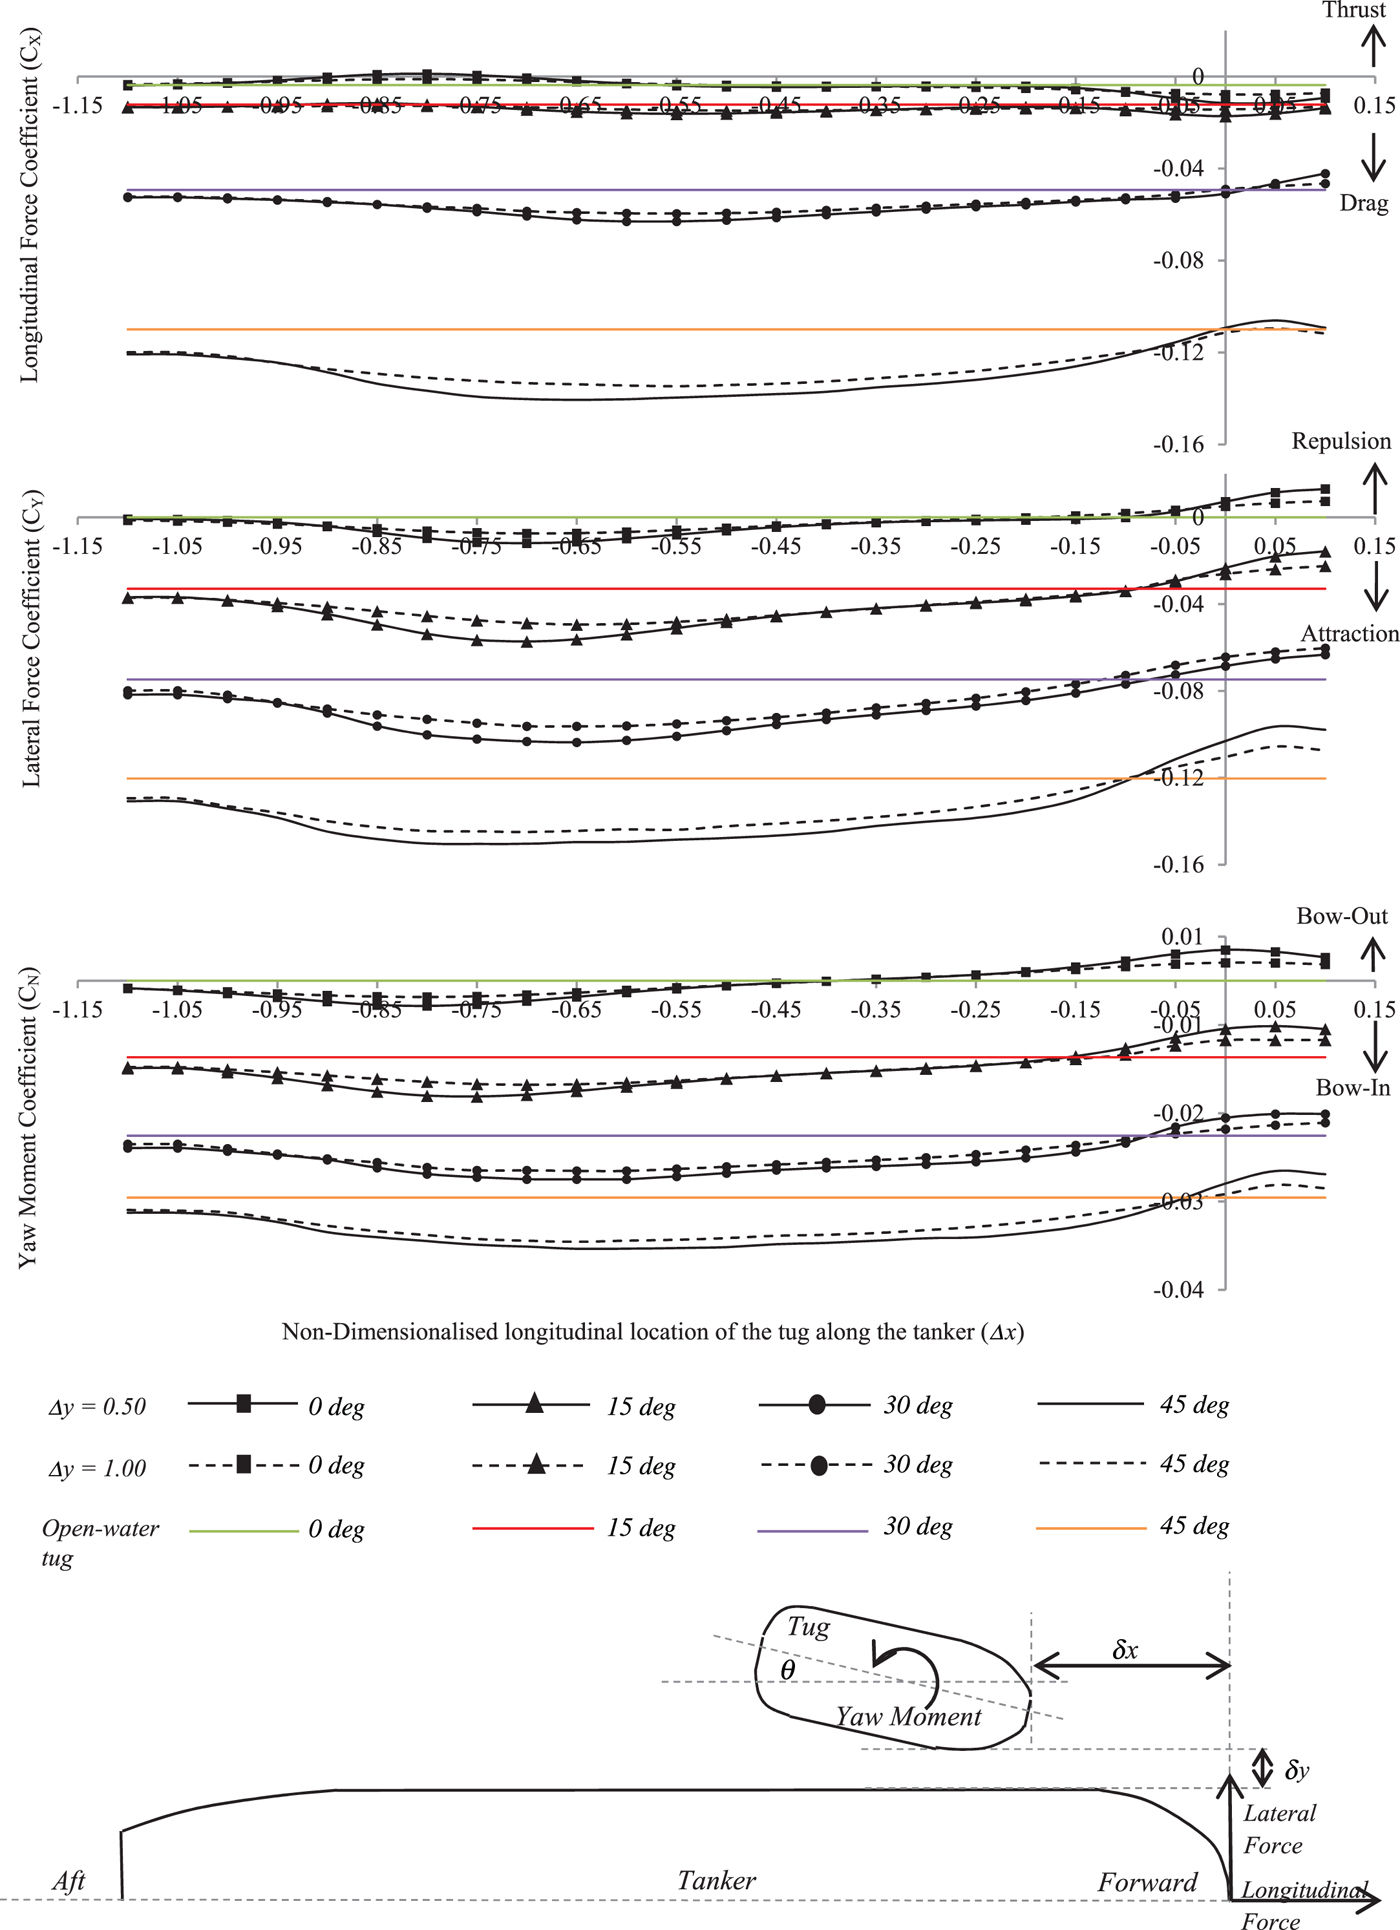
The force and moment coefficients on the tug when it is at non-dimensionalised lateral distances (Δ y) of 0·50 and 1·00 and at a drift angle between zero and 45° are presented in Figure 4. From the figure it is seen that when the tug is within the forward  $\lpar -0\cdot10 \lt \Delta x \lt 0\cdot00\rpar $, midships
 $\lpar -0\cdot55 \lt \Delta x \lt -0\cdot45\rpar $, and aft
 $\lpar -1\cdot00 \lt \Delta x \lt -0\cdot90\rpar $ regions of the tanker, there are significant changes in the result trends.
CFD predicted forces and moment coefficients for a tug operating at the non-dimensionalised lateral separations (Δ y) of 0·50 and 1·00 from the tanker, at tug drift angles (θ) of 0°, 15°, 30° and, 45°, in comparison to an open-water tug. Δ x is the non-dimensionalised longitudinal separation.

As seen in Figure 4, when the tug is in the forward region of the tanker  $\lpar -0\cdot 10 \lt \Delta x \lt 0\cdot00\rpar $, the longitudinal force coefficients are slightly greater than the coefficients of the open-water tug. This is because the tug is in the ‘resistance barrier’ (Dand, Reference Dand and Troup1975) created by the tanker's bow pressure region, where the pressure on the windward side of the tug is increased. Thus, there is an increase in its longitudinal force. At the forward region of the tanker, when the tug is drifted, it experiences a reduction in lateral force and yaw moment in comparison to the open-water tug, due to the tanker's high bow pressure region that ‘pushes’ the forward section of the tug away from the tanker.
When the tug is forward of the tanker's bow, that is,  $\Delta x \gt0\cdot00$, its longitudinal force is slightly reduced at 30° and 45° drift angles compared to the open-water condition. However, the lateral force and yaw moment are similar to those on a tug located in the
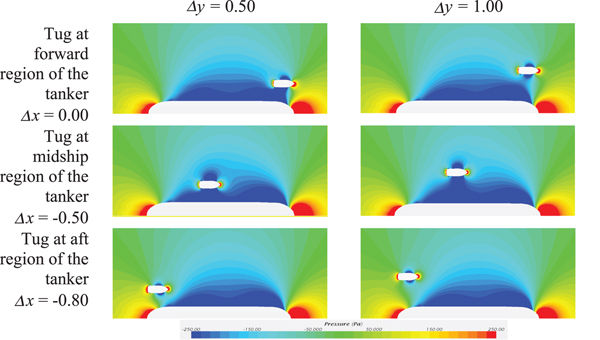
 $-0\cdot10 \lt \Delta x \lt0\cdot00$ region. As the tug moves toward the midships region of the tanker, the longitudinal force, the lateral attraction force and the bow-in yaw moment coefficients are gradually increased. At all of the drift angles, the magnitudes of the coefficients are higher than for the open-water tug. These effects are due to the low-pressure field around the tanker's midships region, which attracts the tug. However, the attraction force distribution along the tug is biased towards the forward section due to the significant difference in pressure in that region, thus resulting in a bow-in yaw moment (see Figure 5).
CFD pressure plots for the tug operating at the non-dimensionalised lateral separation (Δ y) of 0·50 and 1·00 from the tanker, at tug drift angles (θ) of zero degrees. Δ x is the non-dimensionalised longitudinal separation.

When the tug reaches the aft region of the tanker, there is a gradual decrease in the longitudinal force, lateral attraction force and bow-in yaw moment coefficients, due to the tug's interaction with the tanker's aft pressure recovery region (see Figure 4). As seen in Figure 4, at zero and 15° drift angles the longitudinal drag force coefficient on the interacting tug is lower than for the open-water tug when Δ x is between 0·7 and 0·9. This is mainly due to the influence of the pressure recovery region at the stern of the tanker, which creates a reduction in pressure gradient along the tug's length. When the tug moves past this region, the coefficients at all the angles gradually recover to the magnitudes of the open-water condition as it moves away from the region of the tanker's pressure influence. In summary, as shown in Figure 4, the trends in the force and moment coefficients at all longitudinal locations are found to be similar between the drift angles examined. Thus, although the influence of the interaction increases over larger drift angles, the trends in the force and moment coefficients remain fairly consistent. It is also noted that the difference in the force and moment coefficients between open-water and interacting tugs are fairly small when the drift angle is less than 15°.
5.2. Interaction effects at a tug drift angle between 60° to 90°
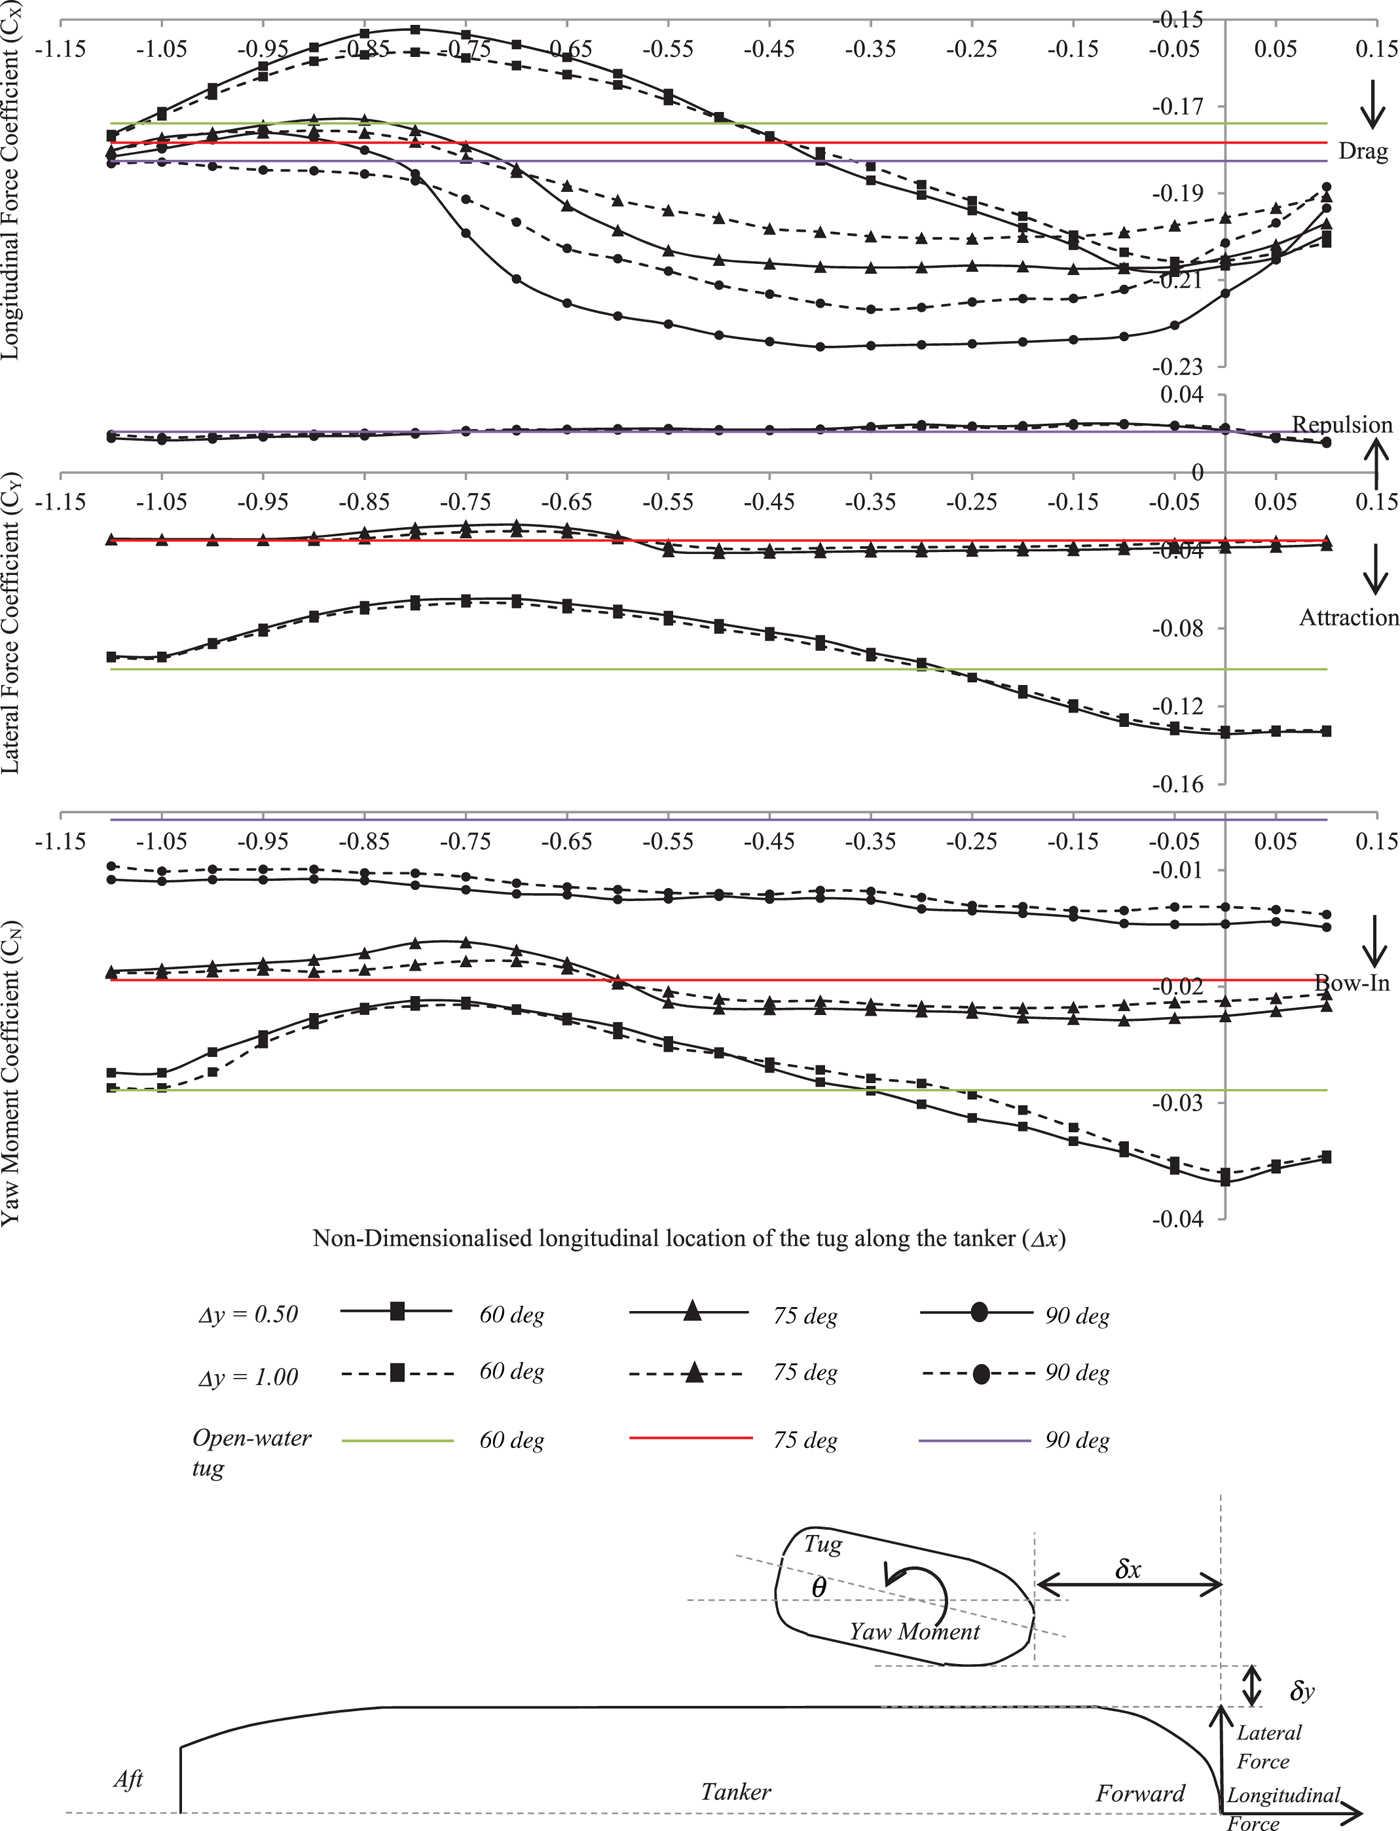
Figure 6 shows the forces and moment coefficients for an open-water and an interacting tug when it is at non-dimensionalised lateral distances (Δ y) of 0·50 and 1·00 and at drift angles of 60°, 70° and 90°. At the tanker's forward region  $\lpar -0\cdot10 \lt \Delta x \lt 0\cdot00\rpar $, the tug experiences significantly higher longitudinal force to that experienced in the open-water condition. The lateral attraction force and bow-in yaw moment coefficients are also higher compared to the open-water tug condition, although the differences are significantly less than the longitudinal force coefficient.
CFD predicted forces and moment coefficients for a tug operating at the non-dimensionalised lateral separation (Δ y) of 0·50 and 1·00 from a tanker, at tug drift angles (θ) of 60°, 75°, and 90° in comparison to an open-water tug. Δ x is the non-dimensionalised longitudinal separation.

When the tug is at the tanker's midships region, a tug drift angle of 60° has the largest variation in forces and moment coefficients between the open-water and interacting tugs. At drift angles of 75° and 90° the forces and moment coefficients of the tug in the midships region are more consistent. When the tug is located in the tanker's aft region (that is,  $-1\cdot00 \lt \Delta x \lt -0\cdot90$), a relatively large variation in the forces and moment coefficients is observed compared to the open-water tug condition. The reason for these significant variations is the tanker's pressure recovery region that affects the pressure distribution around the tug, similar to the observation discussed in Section 6.1 for the lower drift angles. Another significant observation is that the lateral force on the tug at a drift angle of 90° is a repulsion force, contrary to the other angles that generate an attraction force. Interestingly, comparing the lateral force coefficient, in Figures 4 and 6, shows that the attraction force increases as the drift angle increases to about 45° and it then reduces culminating as a repulsion force when the drift angle is close to 90°. This change of direction of forces has to be investigated at small increments of drift angles and lateral separations in future studies.
5.3. Effect of the Froude number on interaction effects
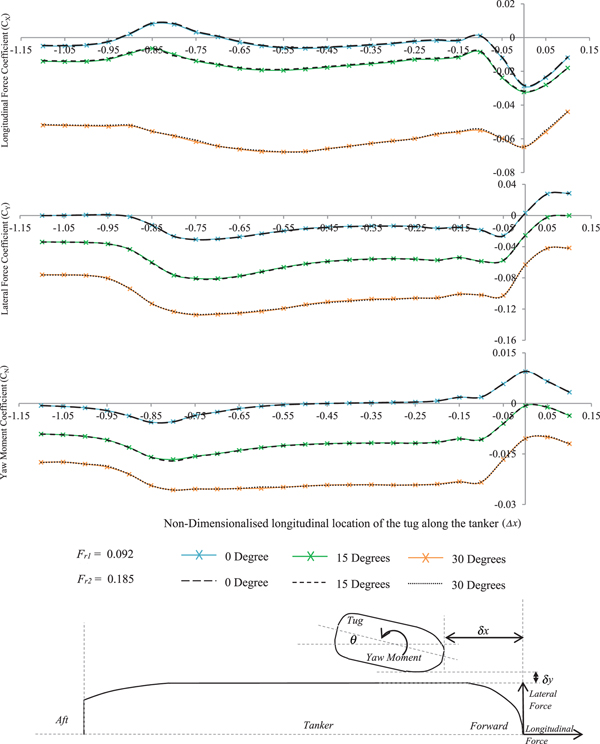
In order to investigate the Froude number effects on the induced interaction on the tug during ship-assist manoeuvres, two full-scale speeds of 3 knots and 6 knots (tug length-based Froude numbers of 0·092 and 0·185 respectively) were investigated. The speeds represented the usual tug speed range during such manoeuvres (Hensen, Reference Hensen2003). Figure 7 shows the predicted forces and moment coefficients on the tug operating at these two Froude numbers, at drift angles of 0, 15° and 30°, and at a non-dimensionalised lateral separation (Δ y) of 0·03. The overall results indicate that the respective force and moment coefficients predicted for the two Froude numbers are within 2·7% of each other, thus establishing reasonable Froude number independence within the operational speed range. Although the results at  $\Delta y = 0\cdot50$ and 1·00 are not presented here, they too show a similar trend thus confirming the Froude number independence.
CFD predicted forces and moment coefficients for the interacting tug operating at Froude numbers (F r) 0·092 and 0·185 at tug drift angles (θ) of 0, 15° and, 30°. Non-dimensionalised lateral separation from the tanker is Δ y = 0·03. Δ x is the non-dimensionalised longitudinal separation.

5.4. Effect of the lateral separation on interaction effects
In this section, the interaction effects on the tug operating within the forward, midships and aft regions are investigated in detail by changing the lateral separation from 0·03 to 2·00 times the tanker's breadth. The interaction effects are calculated using Equation (6) by subtracting the forces and moments acting on the same tug operating in open-waters (that is, X o, Y o and N o) from the forces and moment acting on the interacting tug (that is, X I, Y I and N I) at each speed and drift angle:
 $$A=A_{I}-A_0 $$
where the variable A represents the forces X and Y, and the moment N in turn.
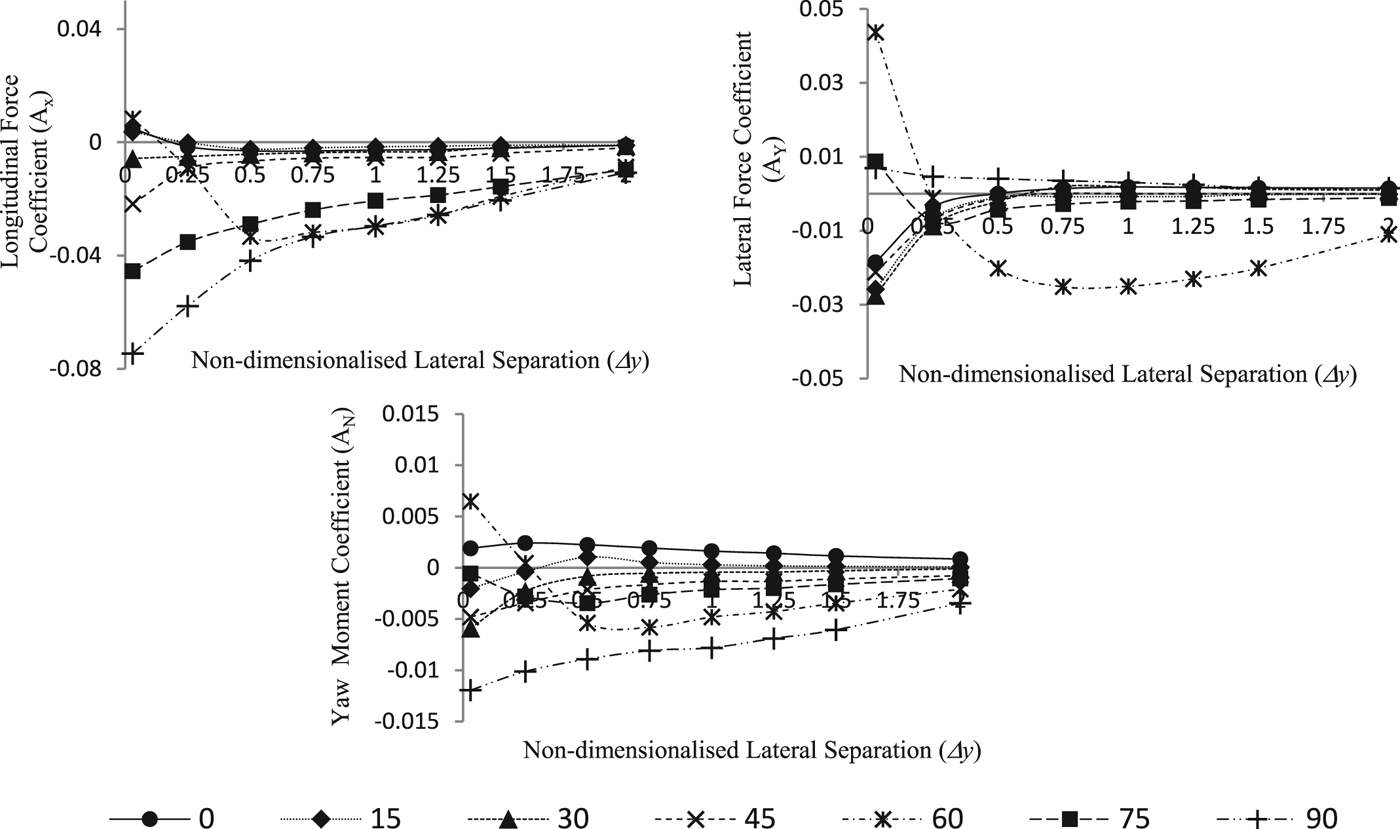
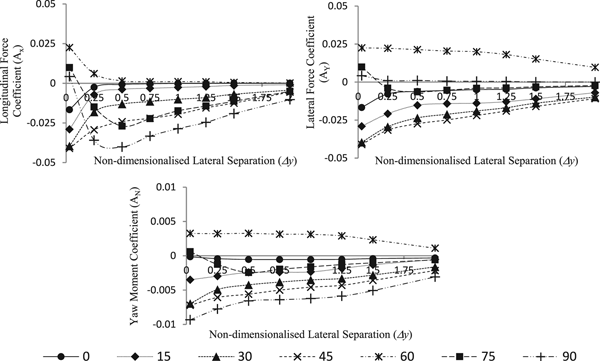
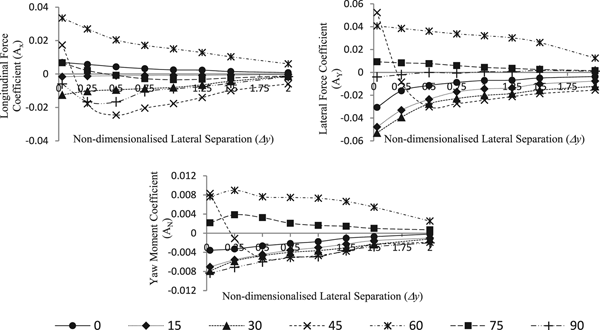
Figures 8, 9 and 10 show the interaction forces and moment coefficients for the tug located at  $\Delta x = -0\cdot10$,
 $\Delta x = -0\cdot50$ and
 $\Delta x = -0\cdot75$ longitudinal locations along the tanker respectively. As seen in the figures, irrespective of the tug's longitudinal location, the interaction coefficients decline as the lateral separation is increased for all drift angles. It is further noted that when the non-dimensionalised lateral separation is greater than
 $\Delta y = 1\cdot00$, the decline in the interaction coefficients is clearly apparent at all of the drift angles and locations. From Figures 8 and 9 it is seen that when the tug is at the
 $\Delta x = -0\cdot10$ and −0·50 locations, the interaction longitudinal force and yaw moment coefficients have their maximum magnitudes when the drift angle is 90°.
Interaction effect coefficients for a tug operating at Δ y = 0·03 to 2·00 non-dimensionalised lateral separations with a tanker at zero to 90° drift angles (θ) at Δ x = −0·10 non-dimensionalised longitudinal location along the tanker.

Interaction effect coefficients for a tug operating at Δ y = 0·03 to 2·00 non-dimensionalised lateral separations with a tanker at zero to 90° drift angles (θ) at Δ x = −0·50 non-dimensionalised longitudinal location along the tanker.

Interaction effect coefficients for a tug operating at Δ y = 0·03 to 2·00 non-dimensionalised lateral separations with a tanker at zero to 90° drift angles (θ) at Δ x = −0·75 non-dimensionalised longitudinal location along the tanker.

The interaction lateral force coefficient is a maximum for the 60° drift angle at Δ x = −0 · 10, and for the 45° angle at  $\Delta x = -0\cdot50$. When the tug is at the
 $\Delta x = -0\cdot75$ location, the 60° drift angle shows the maximum interaction longitudinal force and yaw moment coefficients. The magnitudes of the interaction lateral force coefficient are at a maximum at the 45° drift angle for most of the lateral separations. For the majority of tug drift angles, it is seen from Figures 8, 9 and 10 that the interaction force and moment coefficients have the smallest magnitudes at a drift angle of 15° among the drift angle range investigated. However, when the tug is at Δ x = −0 · 10 location and at 75° and 90° drift angles, the lateral force and yaw moment coefficients experience their lowest magnitudes for a lateral separation
 $\Delta y = 0\cdot03$. At a few tug drift angles and locations, for example, 60° when the tug is at
 $\Delta x= -0\cdot10$ and 90° when the tug is at
 $\Delta x = -0\cdot50$ and −0·75, the interaction force and moment coefficients vary in a different manner in comparison to the majority of the conditions investigated. In order to understand the reason for the variation, additional simulations at small increments of drift angles and lateral separations are required. However, such a detailed analysis was not the aim of the current study and it is therefore left to be addressed in future work.
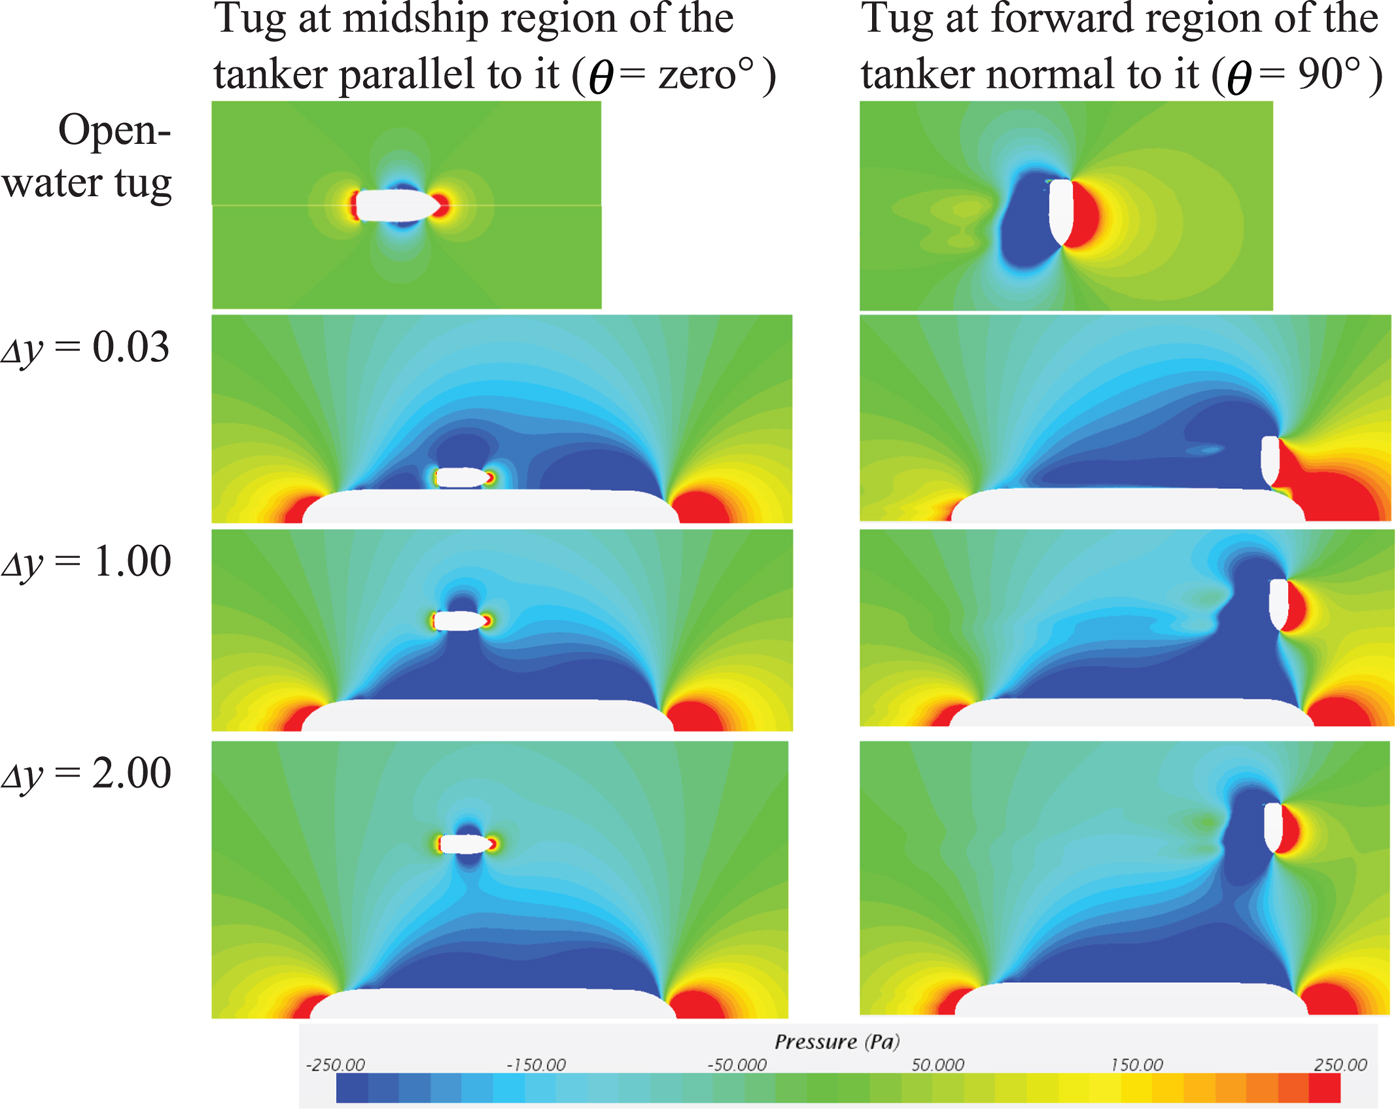
Figure 11 illustrates the CFD pressure plots for the tug at the tanker's forward and midships regions at drift angles of zero and 90°. The figure shows that with the increasing lateral separation, the tug moves away from the tanker's pressure field, thus reducing the interaction effects as expected. Furthermore, between  $\Delta y = 0\cdot03$ and 1·00 lateral separations, it is seen that the pressure field around the interacting tug is significantly affected by the tanker's presence compared to the open-water tug. This creates a large deviation of the pressure around the interacting tug, thus making it difficult to safely manoeuvre the tug within that region of the tanker. At
 $\Delta y = 2\cdot00$, the pressure around the tug settles to a magnitude and distribution similar to the pressure field of the open-water tug. Thus, as seen in Figures 8, 9 and 10, at
 $\Delta y = 2\cdot00$, the effects of the interaction are negligible, providing a safe region for the tug to operate within.
CFD Pressure Plots for the tug operating at Δ y = 0·03, 1·00 and 2·00 non-dimensionalised lateral separations with drift angles of zero and 90° at the midships and forward regions of the tanker respectively.

6. SAFE TUG OPERATIONS
6.1 Safe tug operational envelope
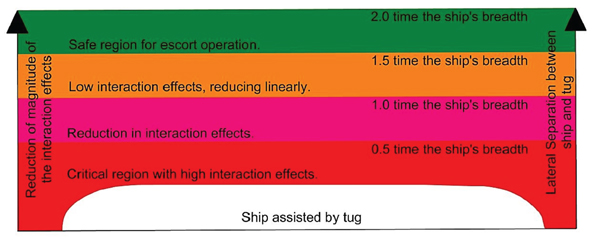
Figure 12 shows critical lateral regions that tug operators should be aware of during ship-assist manoeuvres, which is developed based on the results discussed in Section 5. As seen in the figure, when the lateral separation between the vessels is less than 0·5 times the ship's breadth (that is,  $\Delta y \lt 0\cdot50$), the interaction effects induced on the tug become critical with significant influence on the tug's behaviour. As most ship-assist manoeuvres require tugs to operate within this region, it is essential that tug operators are aware of the interaction effects and the resulting behaviour at the various longitudinal locations (Δ x) in order to ensure safe operations. The region between
 $\Delta y = 0\cdot50$ and 1·00 shows a reduction in the interaction effects, while beyond
 $\Delta y = 1\cdot00$ the interaction effects reduce significantly as discussed in Section 5.4. Beyond
 $\Delta y = 2\cdot00$, the interaction effects become almost negligible, and it is thus relatively safe for the tugs to operate here during ship escort manoeuvres. Although the length of the tow lines used between the two vessels during tug escort operations is generally around 100 m to 150 m, that is, Δ y = 2 · 70 and 4·10, some tug operators use shorter tow-lines of around 60 m to 80 m, that is,
 $\Delta y = 1\cdot60$ and 2·10, (Hensen, Reference Hensen2003). Based on the findings of this study, it is prudent to maintain a gap of at least 2·00 times the larger ship's breadth between the vessels, thus requiring a sufficiently long tow line.
Regions around a ship showing the interaction effects induced on a tug operating in close proximity during ship-assist manoeuvres.

6.2. The safest paths for tugs to approach large ships
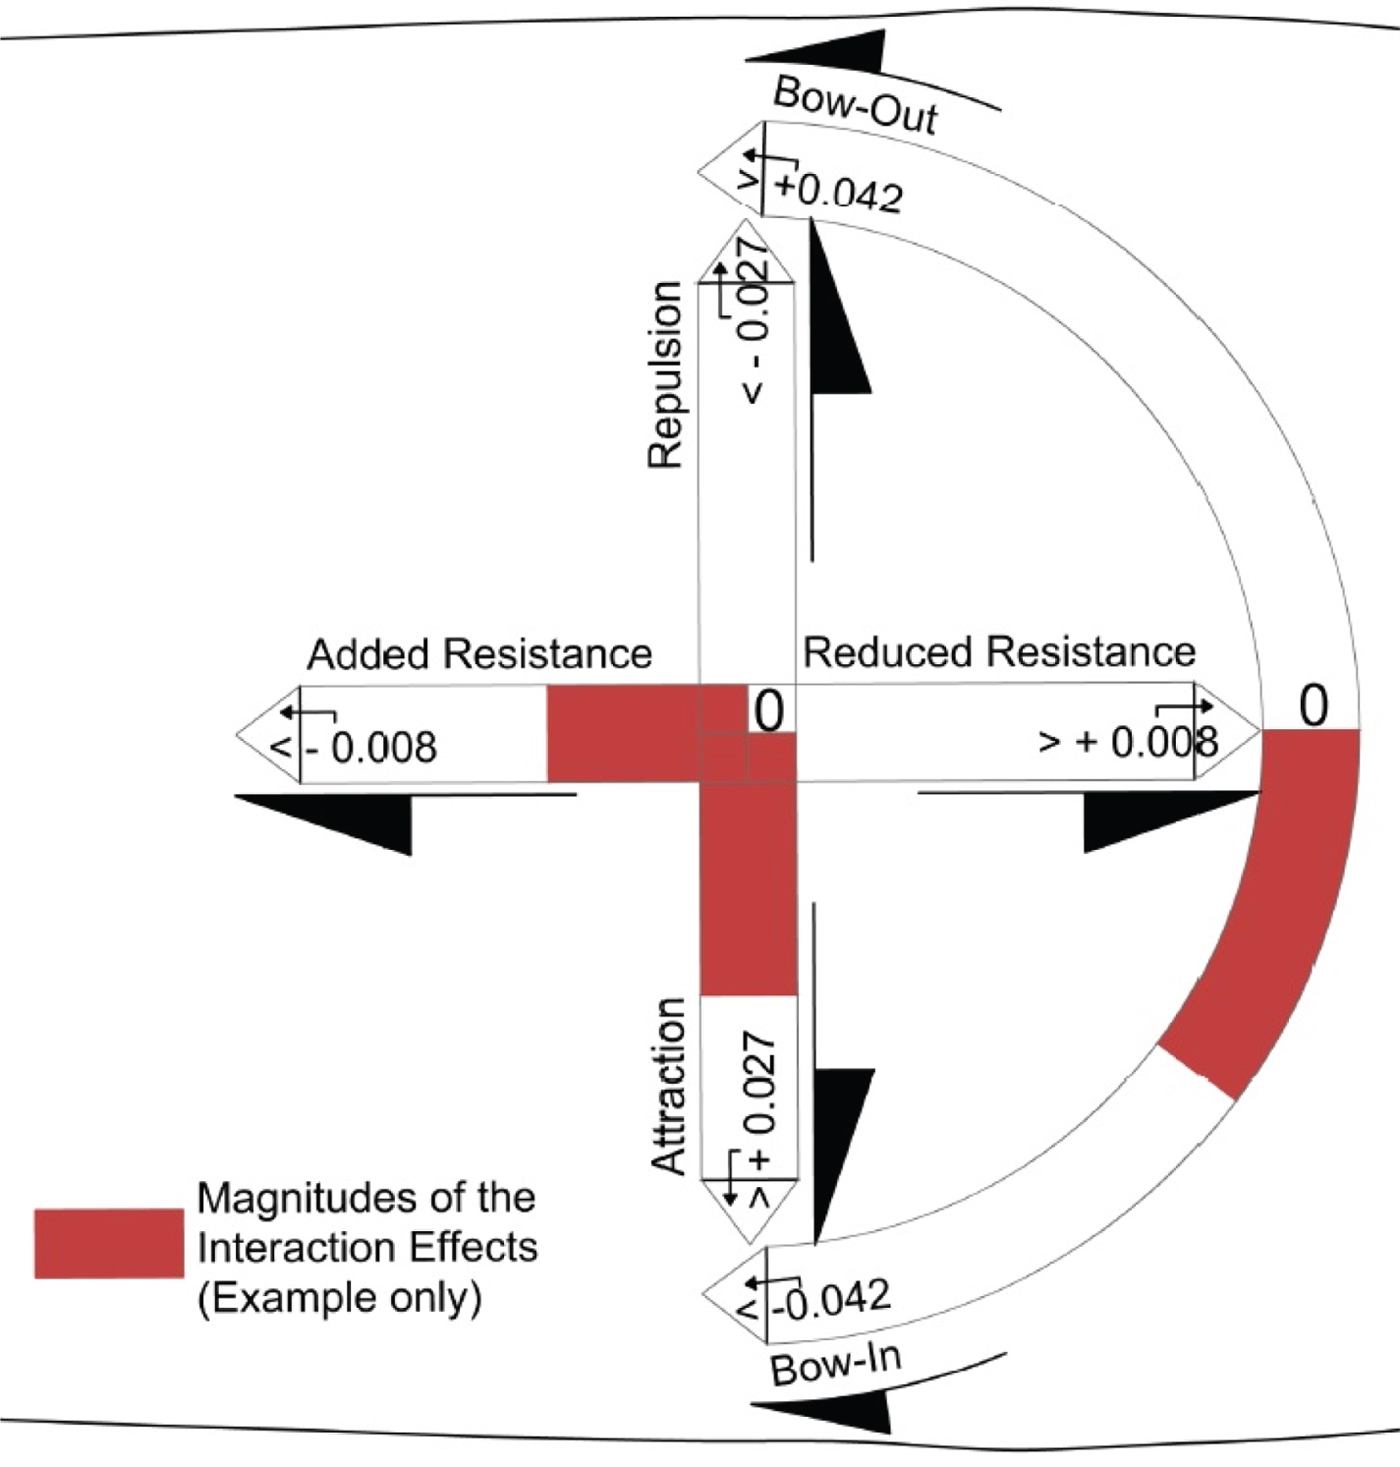
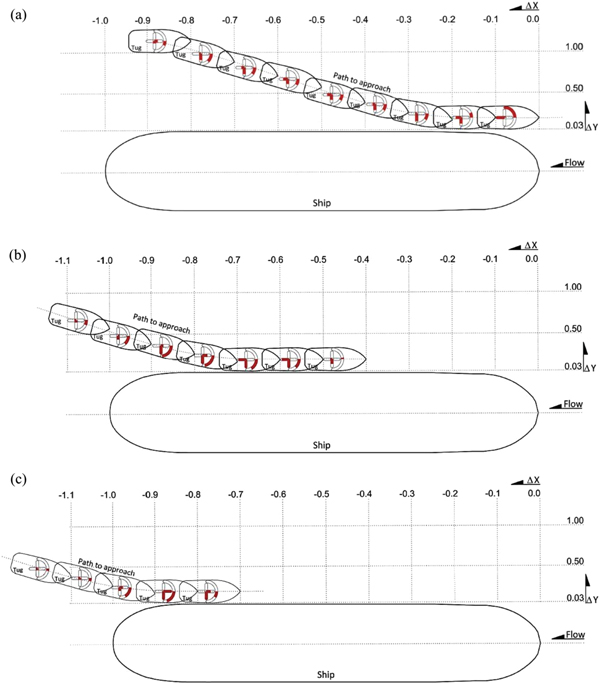
Based on the findings presented in this study, it is possible to identify safe paths for a tug to take in order to approach the forward, midships and aft regions of a larger ship. For each location, the interaction forces and moment coefficients (see Equation (6)) acting on the tug will be presented using the sign convention shown in Figure 13, which is based on that used in this study. The magnitudes of the coefficients are highlighted in red within the corresponding axis bars (see Figures 13 and 14).
Interaction scale used to represent the interaction forces and moment coefficients and their magnitudes (see Figure 14).

Interaction effect on the tug when approaching the larger ship: (a) forward region; (b) midships region; and (c) aft region. The figure is to scale.

In Section 5.1, it was shown that the interaction effects induced on the tug during ship-assist manoeuvres are at their lowest when the drift angle is less than 15°. Thus, it is advisable for tugs approaching larger ships to maintain their drift angles at less than 15° to reduce the adverse effects due to interaction. Taking this into consideration, Figure 14 shows possible safe paths for a tug to approach a larger ship at the forward, midships and aft regions. The figure includes the interaction effect coefficients acting on the tug at each location using the scale introduced in Figure 13. This will provide tug operators with information to better understand the adverse effects on their tug due to the interaction experienced during ship-assist manoeuvres.
As seen in Figure 14(a), the safest path for a tug to enter the forward region of a large ship is to approach the latter just aft of its shoulder  $\lpar {\sim}\Delta x = -0\cdot2\rpar $ with a low drift angle (<15°). When sufficiently close to the larger vessel, the tug can straighten to 0° drift, that is, parallel to the ship, and move forward into the required position. Throughout this path in the figure, the longitudinal force experienced by the tug due to the interaction increases, progressively becoming a maximum when the tug reaches the
 $\Delta x = 0\cdot00$ location. Therefore, tug operators should be prepared to encounter higher longitudinal forces due to interaction as they approach the bow of the vessel. From Figure 14(a) it is also seen that the interaction lateral (attraction) force on the tug significantly increases as the tug moves forward and inwards, until it reaches the
 $\Delta x = -0\cdot10$ location. This lateral force ‘sucks’ the tug towards the larger ship requiring corrective action from the operator, until it reduces to a negligible value at
 $\Delta x = 0\cdot00$. The interaction yaw moment on the tug shows a steady bow-in pattern until the
 $\Delta x = -0\cdot20$ location, where it begins to reverse and yaw the bow-out and away from the larger ship. This change in interaction effect will require the tug operator to change the tug's yaw control to counter the two different conditions as the tug moves along the length of the ship.
Considering the entry to the midships region (Figure 14(b)), a similar approach is required where the operator should maintain a low drift angle (<15°). As the tug moves forward past the stern region of the larger ship and towards it, the tug will experience an increased suction force and an excessive bow-in yawing moment due to the interaction. Thus, the tug operator will have to counter these effects as the tug moves towards the midships region. However, once the tug reaches the midships region, the interaction effects will diminish enabling the tug to maintain position as required.
A tug approaching the aft region of the larger ship (Figure 14(c)) will also encounter similar interaction forces as described for the previous two cases. It is thus recommended that the tug should follow the path shown in the figure to minimise the interaction forces and moment. As the tug approaches the ship, the low-pressure region between the two vessels will result in a suction force and a yaw moment towards the ship. Therefore, as the tug nears the ship the tug operator should expect the suction effect and take appropriate action to maintain separation and heading. It is also not advisable to increase the thrust of the tug as it would accelerate the flow between the vessels, reducing the pressure and further increasing the suction force. Due to the strong suction force and bow-in yaw moment, it is harder to maintain position around the stern region of the ship for tasks such as rope handling. This is exacerbated due to the presence of the ship's propellers in that region. Therefore, it is essential that tug operators are aware of these interaction forces and their locations and be trained on the action required to avoid putting the tug in a dangerous situation.
7. CONCLUSION
The aim of this study was to investigate the interaction effects induced on a tug during a ship-assist operation at different lateral and longitudinal distances from a larger ship and at different tug drift angles. A CFD simulation model validated through model-scale experimental measurements was used to determine the interaction effects at full-scale for a range of relative locations between a tug and a larger ship (tanker), at a number of tug drift angles. The results presented in this paper and the preceding discussion provides the following conclusions with respect to the interaction effects between the two vessels and the safe operating envelope for the tug.
• During ship escort manoeuvres, it is important that the tug maintains a lateral separation of at least 2·0 times the larger ship's breadth to minimise the dynamic (fluctuating) interaction forces and moments. The best location to operate is within the midships region of the larger ship, where the magnitudes of the interaction effects are relatively constant.
• Lateral separations of less than 0·5 times the larger ship's breadth will result in hard to counter fluctuations in the interaction effects at all drift angles. Thus, if possible, it is advisable to avoid such small separations during ship-assist manoeuvres.
• Tug drift angles between 45° and 60° have the highest magnitudes and fluctuation in the interaction effects, and thus are best avoided if possible.
• In order to minimise interaction effects, it is best to maintain the smallest possible tug drift angle (less than 15°) and approach the larger vessel close to its midships region.
• Regardless of the speed of the two vessels, the qualitative pattern of the interaction effects is similar. Thus, tug operators should be aware that the forward and aft regions of larger ships remain critical areas for interaction effects at most vessel speeds.
• Equations used for non-dimensionalising interaction forces and moment can be used along with the interaction effect plots to calculate the magnitudes of forces and moments that tugs experience during ship-assist manoeuvres.
It is important to inform tug operators on the interaction effects at various locations alongside a large ship during ship-assist manoeuvres and provide them with the required training to deal with such effects. This will include the use of appropriate ship handling simulators that can accurately replicate the interaction effects encountered during such manoeuvring. The findings presented in this paper will provide the required data to develop Hydrodynamic Interaction Region Plots (HIRPs) for use by tug operators to understand safe tug operational envelopes during ship-assist manoeuvres. Furthermore, the findings provide data to develop algorithms using techniques such as non-linear regression analysis to predict interaction effects, which in turn can be programmed to better represent interaction effects within ship handling simulators.