I. INTRODUCTION
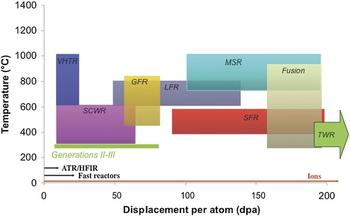
The promise for developing new, advanced nuclear reactor concepts that significantly improve the safety, economics, waste generation, and nonproliferation security of commercial nuclear power reactors, as well as extension of existing light water nuclear reactors rests heavily on understanding how radiation degrades materials that serve as the structural components in reactor cores. In high dose fission reactor concepts such as the sodium fast reactor, lead fast reactor, molten salt reactor, and the traveling wave reactor (TWR), structural materials must survive up to 200 dpa (A dpa (displacement per atom) is a unit of damage that represents the number of times an atom is displaced from its lattice site.) of damage at temperatures in excess of 400 °C. The TWR pushes that limit to 600 dpa, Fig. 1. At such high damage levels, numerous changes occur in the microstructure that can affect physical and mechanical properties. Void swelling Reference Lee, Maziasz, Rowcliffe, Holland, Mansur and Potter2 occurs at homologous temperatures of 0.35–0.55TM, which for steels (325–650 °C) overlaps the temperature range of the reactor core for these high-temperatures, high-dose concepts. Exacerbating the problem is phase instability due to radiation-induced or -enhanced solute segregation Reference Okamoto and Rehn3,Reference Nelson, Hudson and Mazey4 and ballistic dissolution of precipitates Reference Nelson, Hudson and Mazey4 by energetic displacement cascades. Irradiation can nucleate or dissolve phases, changing the solute composition of the matrix and enhancing void growth. Reference Lee, Maziasz, Rowcliffe, Holland, Mansur and Potter2 Further, dissolution of precipitates can cause softening and a loss of high-temperature strength and creep resistance. For example, γ′ precipitates that provide strength to nickel-base alloys used in high-temperature applications are unstable under irradiation. Reference Okamoto and Rehn3–Reference Marwick7 Radiation can induce the formation of brittle phases along grain boundaries and other defect sinks, reducing ductility, and degrading fracture toughness. Reference Boothby5,Reference Sklad, Clausing, Bloom and Shober6,Reference Rowcliffe, Mansur, Hoelzer and Nanstad8 Light water reactor core components have been plagued by irradiation assisted stress corrosion cracking (IASCC), which is one of the most life-threatening degradation modes in light water reactors (LWRs), and will be exacerbated in the supercritical water reactor. Thus, virtually all existing LWRs and advanced reactor concepts require a solution to the radiation damage problem. As materials degradation due to irradiation is both a life limiting and a concept-validating phenomenon, it is truly the grand challenge for the growth and vitality of nuclear energy worldwide.
Schematic of the temperature–dpa requirements for various reactor concepts and the achievable annual damage rates in different test reactors and with ion irradiation. Reference Guerin, Was and Zinkle1

II. CONTRIBUTIONS OF ION IRRADIATION TO OUR UNDERSTANDING OF RADIATION EFFECTS IN MATERIALS
Ion irradiations have been critical to the development of both our fundamental and applied understanding of radiation effects. It is the flexibility of such irradiations and our firm understanding of atomic collisions in solids that afford them their utility. Principally, ion irradiations have enabled focused studies on the isolated effects of the primary recoil spectrum, defect displacement rate, and temperature. In addition, they have provided access to the fundamental properties of point defects, defect creation, and defect reactions. This section, summarized from Ref. Reference Was, Averback and Konings9, highlights a few key experiments that illustrate the broad range of problems that can be addressed using ion irradiations. The focus is on past ion irradiation studies that have provided key information required by modelers in their attempts to predict materials behavior in existing and future nuclear reactor environments and particularly information that is not readily available from neutron irradiations.
Electron irradiation, in comparison to ions and neutrons, has the unique attribute of creating defects in very low energy recoil events in which nearly all Frenkel pairs are produced in isolation. This has been of foremost importance in developing our understanding of radiation damage, since it made possible studies on defect creation mechanisms as well as the fundamental properties of Frenkel pairs. Recall that the properties of vacancies and vacancy clusters, e.g., formation and migration energies, stacking fault energies, etc., could be determined from quenching studies. It is not possible, however, to quench in interstitials in metals. Very little was thus known about this intrinsic defect prior to ≈1955 when irradiation experiments became widely used. This section highlights some of the key findings derived from these past studies.
A. Displacement threshold surfaces
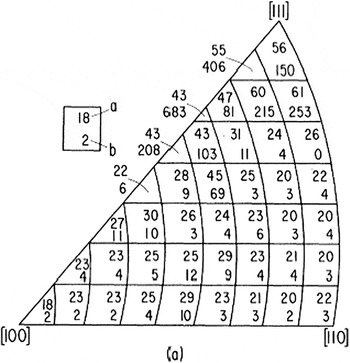
The creation of a stable Frenkel pair requires a lattice atom that receives energy greater than T m, which is the minimum displacement energy. Since a crystal is not homogeneous, the threshold energy depends on the crystallographic direction in which the knock-on atom recoils. The anisotropy of the threshold energy surface has been mapped out in various crystals by measuring the production rate of defects as a function of both the electron energy, near threshold, and the orientation of single crystalline specimens with respect to the electron beam direction. Reference Jung, Chaplin, Fenzl, Reichelt and Wombacher10,Reference Vajda11 By measuring the production rate for many sample orientations and energies, the damage function can be obtained, the results of which are illustrated in Fig. 2 for Cu. Reference King, Merkle and Meshii12 The anisotropy reflects the basic mechanism of defect production, viz, replacement collision sequences (RCS), which had been identified by molecular dynamics simulations as early as 1960. Reference Gibson, Goland, Milgram and Vineyard13 The primary knock-on atom (PKA) in a RCS recoils in the direction of its nearest neighbor, <110> in face centered cubic (fcc) crystals, and replaces it, with the neighbor recoiling also in the <110> and replacing its neighbor. A vacancy is left at the primary recoil site, and an interstitial is created at the end of the sequence. Replacement sequences are the most efficient way to separate the interstitial far enough from its vacancy, ≈ 2–3 interatomic spacings, for the Frenkel pair to be stable. While the lengths of these sequences are still debated, it is clear that the mechanism results in both defect production and atomic mixing. For neutron irradiations, higher energy recoils are numerous, and the average displacement energy, E d, becomes more relevant for calculations of defect production. Reference Lucasson, Robinson and Young14
Displacement energy threshold surface for Cu. The general anisotropy is typical of all fcc metals, although specific values vary. Body centered cubic (bcc) metals show similar behavior of minima along close-packed directions, after Ref. Reference King, Merkle and Meshii12.

B. Point defect properties
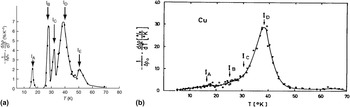
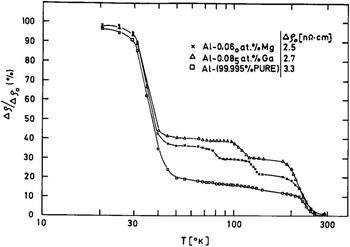
Since Frenkel pairs are produced in isolation during electron irradiation, the properties of single point defects and their interactions with impurities and sinks can be systematically investigated. An example is shown in Fig. 3(a), where the results of low-temperature isochronal annealing of Cu are shown following 1.4 MeV electron irradiation at 6 K. Reference Corbett, Smith and Walker15 Recovery is observed to occur in “Stages.” These studies have revealed that interstitial atoms become mobile at very low temperatures, always below 100 K, in so-called Stage I, while vacancies become mobile at higher temperatures, Stage III. The various substages I A–I E seen in Fig. 3(a) arise from the interaction between interstitial–vacancy pairs, which are produced in close proximity. Stage I E refers to the free migration of interstitials in the lattice, away from its own vacancy, and annihilation at distant vacancies. For comparison, Stage I annealing of Cu following neutron irradiation is shown in Fig. 3(b). Reference Burger, Isebeck, Volkl, Schilling and Wenzl16 Notice that the close pair substages are suppressed during neutron irradiation, illustrating the dramatic difference in the defect production process for these types of irradiation. Similarly, annealing studies on electron-irradiated Al doped with Mg or Ga impurities are shown in Fig. 4. Reference Garr and Sosin17 For these, it is observed that Stage I recovery is reduced as interstitials are trapped at impurities and do not recombine. The recovery at higher temperature, in Stage II, reveals distinct subannealing stages. These annealing stages are generally attributed to either the interstitial dissociating from the impurity or the interstitial–impurity complex, migrating to a vacancy or a defect sink. Migrating interstitial–solute complexes lead to segregation. A compilation of the properties of point defects for many metals and their interactions with impurities can be found in Ref. Reference Ehrhart and Ullmaier18. This information has played a crucial role in developing an understanding of radiation damage in more complex engineering alloys and under more complex irradiation conditions.
Low-temperature isochronal annealing of Cu following (a) electron Reference Corbett, Smith and Walker15 or (b) fast neutron irradiation. Reference Burger, Isebeck, Volkl, Schilling and Wenzl16

Recovery of electrical resistivity in Al and Al–0.06 at.% Ga, Al–0.085 at.% Ga following 1 MeV electron irradiation, after Ref. Reference Garr and Sosin17.

Ion irradiations are the most flexible method for irradiating materials because the primary recoil spectrum can be shifted from near threshold energies for low energy protons to tens of keV for MeV self-ions. In addition, defect production rates can be varied over many orders of magnitude, reaching values over ≈0.01 dpa s−1. Moreover, by using more than one ion beam, the primary recoil spectrum can be tailored to closely match that produced by an arbitrary fission neutron spectrum.
C. The damage function
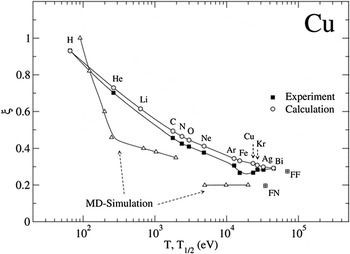
The calculations of defect production require knowledge of the damage function, ν(T), the number of displacements per PKA of kinetic energy, T. While it is not possible to measure this function directly, as no irradiation creates monoenergetic recoils except near the surface, it can be obtained by measuring defect production for a wide range of ion irradiations. Low energy light ions, for example, weight the recoil spectrum near the threshold energy, ≈ 25–100 eV, while more energetic heavy ions weight it at high energies. Results are shown for Cu in Fig. 5. Here, electrical resistivity measurements are used to monitor the absolute number of Frenkel pairs produced per unit dose of irradiation. Included in this figure is the damage efficiency function, ξ(T 1/2), deduced from the experiments and ξ(T) calculated using molecular dynamics computer simulation. The good agreement between experiment and simulations illustrates that the damage function in Cu is now well understood. This is now true for many other pure metals as well. Reference Averback and de la Rubia19 In alloys and ceramic materials, however, the damage function remains poorly known.
Damage function efficiency factor of Cu showing the decrease in efficiency versus cascade energy. The experimental data (solid squares) represent efficiencies for different ion irradiations plotted versus the characteristic cascade energy for the irradiation, T 1/2. The open triangles represent the efficiency versus cascade energy, T, obtained by MD simulation. The open circles represent the calculated efficiencies for the different irradiations using the MD damage function, after Ref. Reference Averback and de la Rubia19.

D. Freely migrating defects
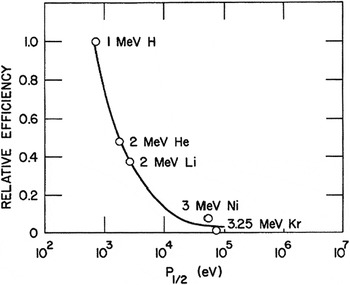
The damage function, ν(T), refers to the number of Frenkel pairs created within the first several picoseconds of the primary recoil event. At longer times, defects migrate from their nascent sites and interact with other defects and microstructural features. As noted earlier, many radiation effects, such as radiation enhanced diffusion, segregation, and void swelling, depend more strongly on the number of defects that escape their nascent cascades and migrate freely in the lattice before annihilating, trapping, or forming defect clusters. The same general approach used to determine the damage function has been used to determine the relative fraction of freely migrating defects, as illustrated by Fig. 6. Here, the relative number of Si atoms segregating to the surface during irradiation, per dpa, is plotted versus a characteristic energy of the recoil spectrum, T 1/2. It is seen that the fraction decreases rapidly with increasing recoil energy.
Relative efficiencies for producing freely migrating defects plotted as a function of the characteristic recoil energy, P 1/2, after Ref. Reference Rehn, Okamoto and Averback20.

While ion irradiation has proved extremely useful in illustrating the spectral effects on freely migrating defects, extracting quantitative information about freely migrating defects from such experiments is difficult. These measurements, unlike the damage function, require very high doses, several dpa, and the buildup of the sink structure must be adequately taken into account. It is also difficult to estimate, for example, how many interstitials are required to transport one Si atom to the surface. Experiments performed using ordering kinetics in order–disorder alloys have provided a more direct measure of the number freely migrating defects (vacancies in this case), as these experiments require doses less than ≈10−7 dpa so that no damage build-up can occur. Reference Wei, Lang, Flynn and Averback21 These experiments show similar effects of primary recoil spectrum on the fraction of freely migrating defects, although the fractions of such defects were found to be somewhat higher in these experiments, ≈0.05–0.10. These fractions are in good agreement with radiation-enhanced diffusion experiments using self-ions on Ni, when the effect of sink strength was taken into account. Reference Fielitz, Macht, Naundorf and Wollenberger22
E. Alloy stability under ion irradiation
Irradiation of materials with energetic particles drives them from equilibrium, and in alloys, this becomes manifest in a number of ways. First concerns nonequilibrium segregation. The creation of large supersaturations of point defects leads to persistent defect fluxes to sinks. In many cases, these point defect fluxes couple to solutes, resulting in either the enrichment or depletion of solutes at these sinks. This effect was first discovered by using in situ electron irradiations in a high voltage electron microscope, Reference Fielitz, Macht, Naundorf and Wollenberger22 and it has been systematically investigated subsequently using ion irradiations, Reference Okamoto, Harkness and Laidler23,Reference Okamoto and Wiedersich24 as the surface sink provides a convenient location to measure composition changes. Unlike neutron irradiation, moreover, the damage created by ions is generally inhomogeneous, reaching a peak level at some depth in the sample. In consequence, point defect fluxes emanate from these regions. An example of this effect is a Ni–12.7 at.% Si alloy irradiated with 75 keV Ni+ ions. Reference Rehn, Picraux and Choyke25 Since the alloy is supersaturated with Si prior to irradiation, Ni3Si precipitates form in the sample. At the location of peak damage, the concentration of interstitials is the highest, and hence these defects flow outward from this region. These interstitials form interstitial–solute complexes with Si, resulting in a Si flux out of this area as well, depleting the region of Si. As a consequence, a region depleted of Ni3Si precipitates is observed at the peak damage depth. Note too that the surface sink for interstitials leads to enrichment of Si, resulting in a surface layer of Ni3Si. The region just below the surface accordingly becomes depleted of Si, leaving a zone depleted of Ni3Si precipitates.
While irradiation induced segregation can lead to nonequilibrium segregation and precipitation in single phase alloys, irradiation can also lead to dissolution of precipitates in nominally two-phase alloys. An interesting example of this behavior concerns Ni–12 at.% Al alloys irradiated with 75 keV Ni+ ions. Reference Rehn, Picraux and Choyke25 These alloys were first annealed at high temperatures to develop a two phase structure of Ni3Al (γ′) and Ni–10.5 at.% Al (γ). The initial precipitate size depending on the annealing time was 2.5 or 4.6 nm. The precipitates disorder during irradiation at room temperature, owing to atomic mixing in cascades. The rate of disordering depends on the size of the precipitates, being slowest for a homogeneous Ni3Al sample and fastest in the alloy with the smallest precipitates. The authors suggest that the reason for this dependence on precipitate size is that atomic mixing reduces the concentration of Al in the precipitates, which thereby accelerates the disordering. When the same irradiation is performed at higher temperatures, and radiation enhanced diffusion takes place, the system does not completely disorder, but rather remains partially ordered, owing to a competition between disordering in the displacement cascades and re-ordering by radiation-enhanced diffusion. Noteworthy, however, is the size of the precipitate, where it is observed that the precipitates initially shrink in size, but then reach a steady state radius. Unlike thermal aging, therefore, precipitates in irradiated alloys can reach a stable steady state size that is a function of irradiation intensity and temperature. Similar behavior has been observed in two-phase immiscible alloys in which case a steady state size of precipitates is formed. Reference Schmitz, Ewert, Harbsmeier, Uhrmacher and Haider26 This so-called “patterning” phenomenon has been explained on the basis of a competition between disordering by atomic mixing in energetic collision events and reordering during thermally activated diffusion. For patterning, however, it is required that the atomic relocation distances during collisional mixing are significantly larger than the nearest neighbor distance. An interesting consequence of this requirement in regard to the present discussion of using ion irradiation to simulate neutron damage is that electron and proton irradiations, which do not produce energetic cascades or long relocation distances, should not induce compositional patterning, but heavy ions and fast neutron irradiation, which do produce cascades, will cause patterning. Further details can be found in Refs. Reference Enrique, Nordland, Averback and Bellon27 and Reference Enrique and Bellon28.
III. USE OF ION IRRADIATION TO STUDY RADIATION EFFECTS IN REACTORS
Radiation effect research is traditionally conducted in test reactors, followed by comprehensive postirradiation characterization. Predictive modeling of the radiation damage process helps to reduce the need for a full suite of experiments covering the entire parameter space. Several increasingly serious barriers are impeding the advancement of our understanding of radiation effects. The first is a worldwide paucity of accessible test reactor capability, especially in the U.S., for addressing the unknowns in advanced reactor concepts. The U.S. has only two test reactors capable of producing damage at a maximum rate of 8 dpa/yr. Available reactors worldwide can only reach 20 dpa/yr, making access to the required damage levels prohibitively time-consuming and expensive. Second, test reactors cannot create radiation damage significantly faster than commercial reactors, meaning that radiation damage research cannot “get ahead” of problems discovered during operation. Both of these factors conspire to create the third barrier; the extremely high cost of irradiation and postirradiation characterization of highly radioactive samples. It is the high cost and long irradiation and analysis times that are major causes of the slow progress in the development of materials for reactor systems.
A. The case for ion irradiation
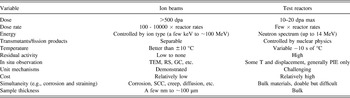
A promising solution to the problem is to use ion irradiation as a surrogate for neutron irradiation. Ion irradiation can yield high damage rates with negligible (proton irradiation) or no (heavy ion irradiation) residual radioactivity and at very low cost. The advantages of ion irradiation are many: damage rates 104 times that of reactor irradiation can be attained, which means that 200 dpa can be reached in days instead of decades. Because there is little or no activation, the samples are not radioactive, reducing the cost associated with postirradiation characterization. Further, ion irradiation experiments can be conducted with ions in the low MeV range, which is achievable by accelerators commonly found in ion beam laboratories. Above all, control of ion irradiation experiments (temperature, damage rate, and damage level) is much better than irradiations in reactor and damage can even be observed in situ. Instrumented tubes with active temperature control for in-reactor experiments are expensive to design, build, and operate. Frequent power changes can cause problems as the flux–temperature relationship will control the microstructure, and significant changes in either can result in artifacts in the irradiated microstructure. “Rabbit” tube irradiations are cheaper, but use passive gamma heating and temperatures are known with even less certainty. Similarly, doses and dose rates are most often determined by neutronic models and are not often verified. The net result is that ion irradiation is 100–1000x less costly, 100–10000x quicker than test reactor irradiation and better controlled. Table I summarizes the attributes of ion and test reactor irradiation for radiation damage studies.
Comparison of attributes of irradiation using ion beams and test reactors.

While the use of ion beams for the study of radiation damage dates back to the 1950s and includes numerous significant contributions to our understanding of radiation effects, as described in the previous section, the idea of using ion irradiation as a surrogate for neutron irradiation is relatively new. Successful application of ion irradiation to the reactor environment requires both a high degree of experiment control and a systematic approach to accounting for the differences between reactor- and accelerator-based irradiations. Capturing the full extent of the entire irradiated microstructure created in-reactor has rarely been attempted. In fact, there are many challenges facing ion irradiation experiments that are aimed at emulating reactor irradiation.
B. Unique challenges faced by ion irradiation
Since the properties of irradiated materials are governed by the irradiated microstructure, it is imperative that ion irradiation mimics the reactor-generated microstructure if it is to emulate the properties of neutron irradiated materials. The evolution of the irradiated microstructure is believed to be governed by the way in which energy is imparted to the lattice by the incoming particle (neutron or ion). There is a clear difference in the PKA energy spectrum between ion and neutron irradiation. As reviewed in Refs. Reference Was, Averback and Konings9 and Reference Averback29 for equivalent energies, neutron irradiation produces a higher average PKA energy and a PKA energy spectrum that extends over a much narrower energy range than that for light ion irradiation. The PKA energy spectrum has strong implications for the formation of defect clusters, which evolve into dislocation loops, voids, etc. However, a recent study Reference Souidi, Hou, Becquart, Malerba, Domain and Stoller30 has shown that the cluster size distribution at low dose (0.1 dpa) was nearly independent of the cascade energy. The same result was reached over a range of damage rates (10−8 to 10−5 dpa/s) and doses (0.01–0.3 dpa). The cascade energy independence of the long-term size distribution suggests that those cascade properties that are energy-dependent, such as their spatial extension, subcascade formation or radial pair correlation functions between point defects, do not play a role in long-term cluster evolution. These results provide a basis for exploring the use of proton irradiation as a surrogate for neutron irradiation.
Among the most significant challenges in emulating reactor irradiation is the effect of the accelerated damage rate on the microstructure. The damage rate difference is addressed using invariance theory derived by Mansur. Reference Garner, Powell, Keefer, Pard, Garr, Nakata, Lauritzen, Bell, Johnston, Appleby, Diamond, Baron, Chickering, Bajaj, Bleiberg, Sprague, Smidt and Westmoreland31–Reference Mansur34 In this theory, a change in the value of an irradiation variable from a reactor irradiation is accommodated by a shift in other variables with the goal of preserving the aggregate behavior of defects during ion irradiation. Such shifts were constructed for specific microstructure processes such as radiation induced segregation or void growth. The higher dose rate in an accelerator relative to a reactor requires a corresponding increase in temperature to achieve the same result. The analysis assumes a steady state and that the irradiation is either in the recombination- or sink-dominant regime. Damage rate differences may also result in a change in the dose at which nucleation of defect clusters occurs, but there is little theoretical or computational modeling guidance for the nucleation process.
Transmutation reactions that result in the production of gas can have a sizable impact on microstructure evolution, especially for voids. Gas production by transmutation can be emulated by preinjection, or better still, by simultaneous gas implantation with damage creation. If the neutron spectrum of the reactor is known, the He/dpa ratio can be determined and imitated in a dual beam experiment in which one accelerator creates the damage with self-ions and a second accelerator injects gas at the prescribed rate.
The effect of the ion used to create radiation damage also needs to be considered as it will be incorporated into the target. Self-ion irradiation avoids chemical effects associated with the introduction of foreign atoms. But while self-ion irradiation does not significantly alter the composition of the target, it does inject an additional interstitial atom. This effect can be significant and is well documented in suppressing the nucleation of voids at the depth to which the ion comes to rest. This will not be the case for proton irradiation, however, because the mobility of hydrogen is high and most will escape the shallow implantation layer at the irradiation temperature.
The surface can also create difficulty in emulating the irradiated microstructure. Because it acts as a strong sink, the microstructure will evolve differently in the vicinity of the surface. Irradiation experiments in transmission electron microscopes have revealed strong effects of surface proximity on microstructure evolution (see Sec. IV. A). So analysis must be conducted beyond the surface region yet short of the injected interstitial to avoid extrinsic effects on microstructure evolution. This places a constraint on the volume of material available for both microstructure analysis and mechanical property determination.
Another issue in the use of ion beams is that they can be applied to samples in either a defocused or a raster-scanned method. Defocused irradiations use a stationary beam but one in which the current varies within the beam. While defocusing the beam spreads the beam to minimize the intensity variation, a significant fraction of the total beam current will be unusable. Further, there will always be a variation in damage with location on the target, and the beam intensity profile must be measured to know the damage profile. Raster-scanning sweeps a focused beam across an area to ensure a uniform damage rate. In raster-scan mode, any volume element of the target is exposed to the beam for only a fraction of the raster-scan cycle. For typical raster-scanning parameters, the fraction of time that any particular volume element in the solid is being bombarded is ∼0.025. Thus, the instantaneous dose rate during the beam-on portion of the cycle is 40 times that of the average. The result is that the defect production rate is very high and defects may anneal out in the remaining 0.975 portion of the cycle before the beam again passes through the volume element. As such, the effective defect production rate in raster-scanned experiments will be less and must be accounted for.
IV. ION IRRADIATION OPTIONS
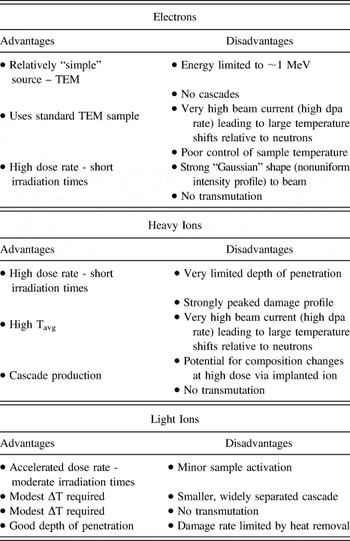
Ion irradiation can be categorized according to the types of particles used: electrons, heavy (or self) ions, and light ions (H, He). In all cases, a major objective of ion irradiation is the rapid accumulation of damage compared to reactors. Each particle type has its advantages and disadvantages for emulating neutron irradiation damage. The merits of each are discussed next and a summary is provided in Table II. Electrons are discussed first because of their unique feature of producing only single Frenkel pairs, while heavy ions produce dense cascades and light ions fall between the two.
Advantages and disadvantages of irradiations with various particle types, from ref. [Reference Was, Averback and Konings9].

A. Electrons
Electron irradiation is easily conducted in a high voltage transmission electron microscope (HVEM) using either a hot filament or a field emission gun as an electron source. An advantage is that the same instrument used for irradiation damage can be used to image the damage. Another advantage is that the high dose rate requires very short irradiation time, but will also require a large temperature shift. Electron irradiation can also be conducted on bulk samples using an electron accelerator that can provide a more uniform, defocused beam, and much lower damage rates that are more typical of reactor application.
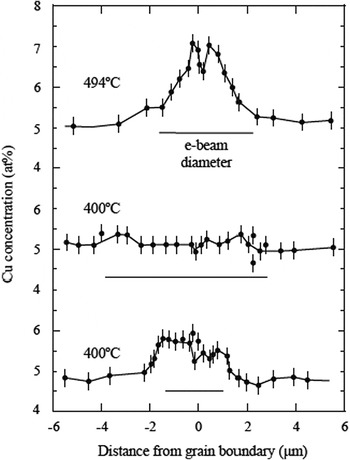
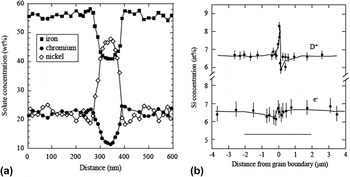
There are several disadvantages to the use of electrons to induce radiation damage. First, energies in HVEMs are generally limited to 1 MeV. This energy is sufficient to produce an isolated Frenkel pair in transition metals, but not cascades. (Note that this feature is an advantage in studying point defect behavior.) The beam currents from HVEMs result in a high dose rate that requires compensation with high temperatures that must be closely monitored and controlled, which is difficult to do precisely in a typical transmission electron microscopy (TEM) sample stage. Another drawback is that since irradiations are often conducted on thin foils, defects are created in close proximity to the surface and their behavior may be affected by its presence. Perhaps, the most serious drawback is the Gaussian shape to the electron beam that can give rise to strong dose rate gradients across the irradiated region. Figure 7 shows the composition profile of copper around a grain boundary in Ni–39% Cu following electron irradiation. Note that while there is local depletion at the grain boundary (as expected), the region adjacent to the minimum is strongly enriched in copper due to the strong defect flux out of the irradiated zone defined by the horizontal line below the spectrum. This outward-directed defect flux causes a reversal in the direction of segregation from that caused by a defect flux to the sink. This may also be related to a common artifact in electron irradiation which is very broad grain boundary enrichment and depletion profiles. Figure 8(a) shows that the enrichment profile for Ni and the depletion profiles for Fe and Cr in stainless steel have widths on the order of 75–100 nm, which is much greater than the 5–10 nm widths observed following neutron irradiation under similar conditions and model simulations of radiation-induced segregation. A similar effect was observed by Wakai Reference Wakai37 using electron and D+ irradiation of the same alloy in which the segregation profile was much greater and narrower around the grain boundary in the deuteron-irradiated sample as compared to the electron irradiation, Fig. 8(b).
Enrichment of copper surrounding a local depletion at the grain boundary in Ni-39% Cu. The enrichment is caused by the high defect flux away from the irradiated region defined by the horizontal line [from Ref. Reference Ezawa and Wakai35].

(a) Broad grain boundary enrichment and depletion profiles in Fe–20Cr–25Ni–0.75Nb–0.5Si following irradiation with electrons at 420 °C to 7.2 dpa [from Ref. Reference Ashworth, Norris and Jones36], and (b) comparison of (a) deuteron and (b) electron irradiation showing the greater amount of segregation and the narrower profile for the deuteron irradiation [from Ref. Reference Wakai37].

B. Heavy ions
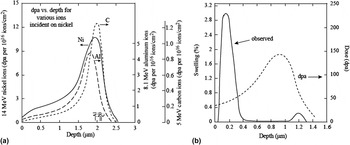
Heavy ions enjoy the benefit of high dose rates resulting in the accumulation of high doses in short times. Because they are typically produced in the energy range of a few MeV, they are very efficient at producing dense cascades, similar to those produced by neutrons. The consequence of high dose rates is large temperature shifts. Another drawback is the short penetration depth and the continuously varying dose rate over the penetration depth. Figure 9(a) shows the damage profile for several heavy ions incident on nickel. Note that the damage rate varies continuously and peaks sharply at only 2 μm below the surface. As a result, regions at a very well-defined depth from the surface must be isolated and sampled to avoid dose or dose rate variation effects from sample to sample. Small errors (500 nm) made in locating the volume to be characterized can result in a dose that varies by a factor of two from the target value. Similar to the case with electron irradiation, care must be taken to avoid the effect of the surface on the evolution of the microstructure.
(a) Damage profiles for C, Al, and Ni irradiation of a nickel target at energies selected to result in the same penetration depth [from Ref. Reference Whitley38], and (b) subsurface swelling resulting from 5 MeV Ni+ ion irradiation of Fe–15Cr–35Ni at 625 °C [from Ref. Reference Garner39].

A problem that is rather unique to self-ion irradiation is that in addition to the damage they create, each bombarding ion constitutes an interstitial. Figure 9(b) shows that 5 MeV Ni++ irradiation of a Fe–15Cr–35Ni alloy resulted in high swelling in the immediate subsurface region compared to that near the damage peak. Reference Garner39 The Ni++ ions come to rest at a position just beyond the peak damage range. So even though the peak damage rate is about 3x that at the surface, swelling at that location is suppressed by about a factor of 5 compared to the surface. Reference Garner39 As discussed earlier, the bombarding Ni++ ions constitute interstitials and the surplus of interstitials near the damage peak results in a reduction of the void growth rate. Reference Lee, Mansur and Yoo40,Reference Brailsford and Mansur41 In the dose rate–temperature regime where recombination is the dominant point defect loss mechanism, interstitials injected by Ni++ ion bombardment may never recombine since there is no corresponding vacancy production. Therefore, injected interstitials comprise a larger fraction of the point defects absorbed at sinks whenever the fraction of point defects recombining is large, such as in the peak swelling regime.
C. Light ions
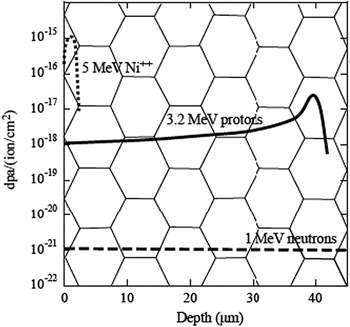
In many ways, proton irradiation overcomes the drawbacks of electron and neutron irradiation. The penetration depth of protons at a few MeV can reach tens of micrometers and the damage profile is relatively flat such that the dose rate varies by less than a factor of two over several tens of micrometers. Further, the depth of penetration is sufficient to assess such properties as irradiation hardening through microhardness measurements, and stress corrosion cracking through crack initiation tests such as the slow strain rate test. Figure 10 shows the schematics of 3.2 MeV proton and 5 MeV Ni++ damage profiles in stainless steel. Superimposed on the depth scale is a grain structure with a grain size of 10 μm. Note that with this grain size, there are numerous grain boundaries and a significant irradiated volume over which the proton damage rate is flat. The dose rate for proton irradiations is 2–3 orders of magnitude lower than that for electrons or ions, thus requiring only a modest temperature shift, but since it is still 102–103 times higher than neutron irradiation, modest doses can be achieved in reasonably short irradiation time.
Damage profiles for 1 MeV neutrons, 3.2 MeV protons, and 5 MeV Ni++ ions in stainless steel [from Ref. Reference Was, Allen, Sickafus, Kotomin and Uberuaga42].

The disadvantages are that because of the small mass of the proton compared to heavy ions, the recoil energy is smaller and the resulting damage morphology is characterized by smaller, more widely spaced cascades than with ions or neutrons. The smaller mass also results in a lower attainable damage rate. The number of displacements per proton is much less than that for a heavy ion, requiring higher fluxes of protons to achieve the same damage level in the same amount of time. However, the higher beam currents and greater depth penetration result in larger heat loads and require the removal of the heat to control the irradiation temperature. This puts a limit on the damage rate achievable by proton irradiation, which is approximately 100x lower than that for heavy ion irradiation. Also, since only a few MeV are required to surmount the Coulomb barrier for light ions, there is also a small amount of sample activation that increases with proton energy.
V. EXPERIENCE WITH ION IRRADIATION IN EMULATING NEUTRON IRRADIATION
As noted earlier, ion irradiation has been used to study radiation effects for decades, but its use in emulating neutron irradiation effects is newer and presents greater challenges. Thus, while still small, there is a growing body of evidence for low dose (<10 dpa) proton irradiation, and a much smaller body for high dose (>100 dpa), self-ion irradiation showing that the microstructural features (dislocation loops, precipitates, voids, radiation induced segregation) and properties (hardness, stress corrosion cracking susceptibility) are in excellent agreement with those from reactor irradiation. This section reviews the most recent examples of the use of ion irradiation to emulate reactor irradiation microstructures and properties, first with protons because of the much larger body of work conducted with these ions, and then with heavy ions.
A. Proton irradiation
1. Dislocation microstructure
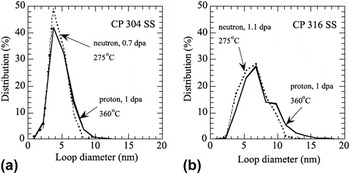
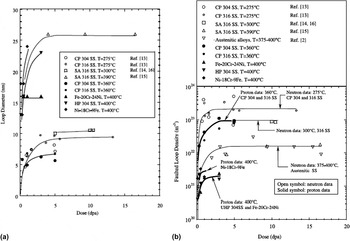
Gan and Was Reference Gan and Was43 conducted proton irradiation of austenitic stainless steels at 360 °C and a dose rate of about 7 × 10⁻⁶ dpa/s and found that the resulting dislocation loop microstructure was in good agreement with that from the same heats irradiated in the reactor at 275 °C. Figure 11 shows the loop size distributions for commercial purity, CP 304 SS and CP 316 SS following irradiation to about 1 dpa. The agreement was excellent in both cases and the proton irradiation accurately captured the longer tail of the distribution in the 316 alloy compared to the 304 alloy. The evolution of the loop size and number density as a function of dose is shown in Figs. 12(a) and 12(b), respectively. The loop sizes were in agreement and both responded to irradiation temperature as expected. The loop density was about a factor of 3 lower than that in-reactor.
Comparison of loop size distribution between neutron-irradiated (275 °C) and proton-irradiated (360 °C) CP 304 SS and CP 316 SS. Reference Gan and Was43 Neutron data were taken from Ref. Reference Bruemmer, Edwards and Simonen44.

Dose dependence of (a) faulted loop size and (b) faulted loop density between neutron-irradiated (open symbols) Reference Bruemmer, Edwards and Simonen44–Reference Greenwood48 and proton-irradiated (closed symbols) Reference Gan and Was43 austenitic stainless steels.

The results can be understood as follows. Loop nucleation is driven by in-cascade interstitial clustering. Neutron irradiation produces large cascades while proton irradiation produces smaller, spatially separated cascades. In proton irradiation, the fraction of interstitials in clusters is lowered by a factor of 20 compared to neutron irradiation. Reference Gan, Was and Stoller49 But the higher dose rate and cascade efficiency and the lower sink strength at the higher temperature in proton irradiation result in a higher nucleation rate of tetra-interstitials. These somewhat compensating effects result in rough equivalence of the dislocation loop density and size between neutron and proton irradiation under conditions relevant to LWR core materials.
Sencer et al. Reference Sencer, Was, Sagisaka, Isobe, Bond and Garner50 irradiated solution annealed 304 SS and cold-worked 316 SS with 1 MeV protons between 1 and 10 dpa at 300 °C in both the He preimplanted and nonimplanted conditions. Preimplanted samples were also irradiated at 340 °C. The preimplanted steels irradiated at 340 °C exhibited homogenous void formation, suggesting the effects of both helium and irradiation temperature on void nucleation. Voids developed sooner in the SA304 alloy than the CW316 alloy at 300 and 340 °C, consistent with the behavior observed at higher temperatures (>370 °C) for similar steels irradiated in the EBR-II fast reactor. The results indeed confirmed that at 340 °C solution annealed 304 SS swelled earlier than cold-worked 316, with a relative delay of ∼3.5 dpa, indicating that the trend in relative swelling behavior extends throughout the temperature range of pressurized water reactor (PWR), fast reactor, and charged particles. The current data also confirmed that the difference in swelling arose primarily from differences in void nucleation as opposed to void growth, a very general observation for austenitic steels Reference Garner and Frost51 where the primary effects of microstructure, composition, and environment appear to lie only in the incubation or transient regime of swelling.
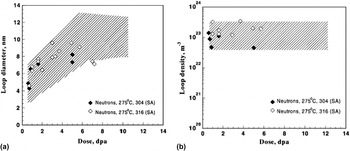
They also found that the proton-induced loop evolution in the two steels appeared at 300 °C to be independent of both cold working and composition. Figure 13 shows that the neutron-induced loop characteristics were very similar to those for proton irradiation in the absence of helium, although in this case the comparisons were being made for different heats of steel. However, a similar independence of composition was observed by Edwards et al. Reference Edwards, Simonen and Bruemmer53 in neutron-irradiated 304 and 316 under the annealed condition, irradiated under conditions where the helium generation was relatively low and was produced continuously during irradiation.
A comparison of (a) loop diameter and (b) loop density of proton and neutron irradiation of 304 and 316. Reference Sencer, Was, Sagisaka, Isobe, Bond and Garner50 The irradiation temperature for the neutron study was 275 °C. Reference Fujii, Fukuya, Furutani, Torimaru, Kohyama, Kotah, Ford, Was and Nelson52 Shaded regions in graphs show the range of the proton data from Ref. Reference Sencer, Was, Sagisaka, Isobe, Bond and Garner50.

Tournadre et al. Reference Tournadre, Onimus, Bechade, Gibon, Cloue, Mardon, Feaugas, Toader and Bachelet54 showed for the first time that c-component dislocation loops can be created in recrystallized and annealed Zircaloy-4 using 2 MeV proton irradiations in the temperature range 573–623 K. Recrystallized zirconium alloys, used as structural materials for the PWR fuel assembly, underwent neutron irradiation induced stress free growth which accelerated for high irradiation doses. This acceleration was correlated with the formation of c-component vacancy dislocation loops in the basal plane. Since these defects were responsible for breakaway growth of recrystallized zirconium alloys, it is of prime importance to know the various factors that can affect their nucleation and growth.
The samples of Zr-4 were irradiated with 2 MeV protons to 11.5 dpa at 350 °C, after which the macroscopic deflection of the proton irradiated specimens was analyzed for radiation-induced growth. Proton irradiation induced stress–free strain in Zr-4, which was consistent with the irradiation-induced growth of recrystallized zirconium alloys. Preferential nucleation of loops near precipitates was observed after proton irradiation, which also occurred during neutron irradiation. Thus, proton irradiation appears to reproduce the results of neutron irradiation with regard to <c> loop formation. The differences in the morphology of the damage (size of the displacement cascade) seemed to play a minor role in the <c> loop microstructure. Self-ion irradiation also reproduced the formation of c-component loops in Zr-4. TEM observations on Zr ion irradiated specimens showed that c-component loops started to nucleate and grow only above a threshold dose, in good agreement with TEM observations performed after neutron irradiation.
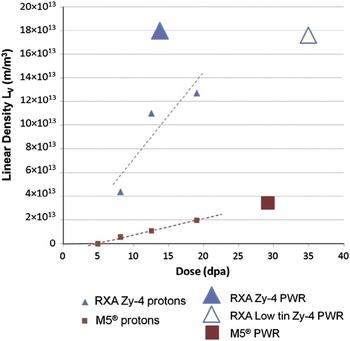
In another study, Tournade et al. Reference Tournadre, Onimus, Bechade, Gibon, Cloue, Mardon and Feaugas55 conducted 2 MeV proton irradiations on as-fabricated M5@, recrystallized Zircaloy-4, and 350 wppm prehydrided M5@. TEM observations conducted on as-fabricated RXA Zy-4 and M5@ thin foils after proton irradiations showed that <c> loops are present in both alloys for irradiation doses above 8 dpa. The <c> loop density increased with irradiation dose for both alloys. However, for equivalent irradiation doses, the <c> loop density was lower in M5@ than in RXA Zy-4. Thus, the difference in densities between the two grades is consistent with neutron irradiation. Moreover, for both grades, a higher <c> loop density was observed around some precipitates. This preferential nucleation, frequently discussed in the literature for neutron irradiated recrystallized Zircaloy-4, could be due to iron depletion from Laves phase precipitates Zr(Cr,Fe)2. Reference Griffiths, Bruce and Magnus56,Reference De Carlan, Gilbon, Griffiths, Lemaignan, Regnard, Bradley and Sabol57 TEM observations with diffraction conditions B = <1120> and g = 1010 attested that the <c> loops obtained by using 2 MeV proton irradiations were faulted as after neutron irradiations. Reference Griffiths and Gilbert58,Reference Griffiths, Gilbert, Fidleris, Tucker and Adamson59 These results confirmed that 2 MeV proton irradiations at 623 K on RXA Zy-4 and M5@ led to <c> loop microstructures representative of neutron irradiated materials. Reference Tournadre, Onimus, Bechade, Gibon, Cloue, Mardon, Feaugas, Toader and Bachelet54 The authors concluded that proton irradiation reproduced both qualitatively and quantitatively, the <c> loop microstructures obtained under PWR operating conditions for the two studied grades: M5@ and RXA Zy-4. Other phenomena revealed by proton irradiation included the alloying effect (<c> loop densities are less important in M5@ than in RXA Zy-4) and preferential <c> loop nucleation around some precipitates. The authors also showed that proton irradiation was instrumental in proving for the first time that prehydriding led to an increase of the <c> loop densities after irradiations of M5@ in agreement with in-pile behavior, Fig. 14.
Linear density of c-component loop evolution with irradiation dose for RXA Zy-4 and M5@ after 2 MeV proton irradiations at 623 K and under PWR conditions. Thickness is considered equal to 150 nm, from Ref. Reference Tournadre, Onimus, Bechade, Gibon, Cloue, Mardon and Feaugas55.

2. Radiation induced segregation
Fukuda et al. Reference Fukuda, Aoki, Isobe, Hasegawa and Abe60 conducted 3 MeV proton irradiation of 304 SS and XM-19 steel at 300 °C and measured radiation induced segregation (RIS) after a dose of 1 dpa. They found that RIS induced by proton irradiation corresponded to RIS induced by neutron irradiation qualitatively. After accounting for the formation efficiency of freely migrating defects and the damage rate difference, the amount of RIS agreed quantitatively with that by neutron irradiation. Reference Was and Allen61,Reference Asano, Fukuya, Nakata, Kodama, Cubicciotti, Simonen and Gold62
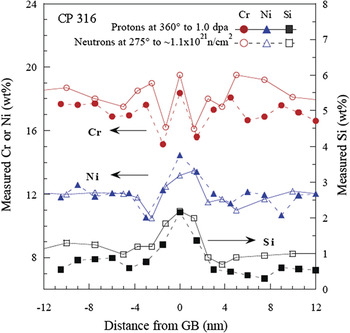
Was et al. Reference Was, Busby, Gan, Kenik, Jenssen, Bruemmer, Scott and Andresen63 conducted proton irradiation on archive samples of CP 304 and CP 316 SS heats that were also irradiated in the Barsebäck 1 BWR in Sweden. Of significance was that the comparison between proton and neutron irradiation was made on the same alloy heats, eliminating potential sources of discrepancy caused by heat-to-heat variations. Processing of the CP 316 alloy resulted in enrichment in the grain boundary Cr concentration. Irradiation with protons or neutrons caused the Cr enrichment profile in the as-received condition to develop into a “W” shaped profile after about 1 dpa. Figure 15 shows a detailed comparison of the grain boundary profiles for Cr, Ni, and Si in the 316 SS alloy following ∼1 dpa for neutrons and protons. The “W” shaped Cr concentration profile at this dose provided, perhaps, the most difficult test of the capability of proton irradiation to emulate the neutron irradiation in terms of radiation-induced segregation. The data show that in all aspects of comparison, including trend, spatial extent and magnitude, the composition profiles resulting from the two types of irradiation were virtually indistinguishable (any differences are within experimental uncertainty). Further, while Cr formed a distinct “W” profile, both Ni and Si showed rather normal grain boundary enrichment.
Comparison of Cr, Ni, and Si segregation profiles following proton and neutron irradiation of commercial purity 316 SS to 1.0 dpa. Reference Was, Busby, Gan, Kenik, Jenssen, Bruemmer, Scott and Andresen63

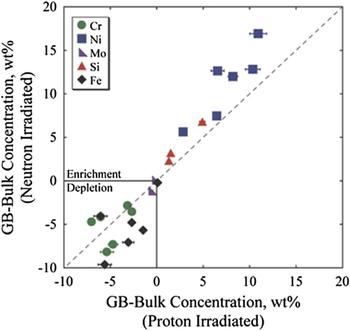
In a study covering 11 solute addition alloys and 3 commercial alloys as part of the Cooperative IASCC Research (CIR) Program, Reference Scott64 the microstructure and properties of both proton and neutron irradiation were analyzed in which the latter was conducted in the BOR-60 reactor to doses between 4 and 47 dpa. Solute addition alloys were controlled-purity heats of Fe–18Cr–12Ni to which single solute additions were made to test their effect on IASCC. Within this program, the grain boundary RIS of 6 solute addition alloys and 3 commercial alloys was measured following proton irradiation to 5.5 dpa (360 °C) or neutron irradiation to between 5.4 and 11.8 dpa (320 °C). Figure 16 shows the agreement in grain boundary enrichment or depletion of Cr, Ni, Fe, Si, and Mo for these alloys. Proton and neutron irradiation under the selected conditions resulted in nearly identical elemental segregation behavior at grain boundaries. Reference Stephenson and Was65 The slightly higher temperature during proton irradiation was sufficient to increase diffusion kinetics and compensate for the increased damage rate.
Comparison of elemental enrichment and depletion from the bulk composition as a result of neutron and proton irradiation. Reference Stephenson and Was65 RIS measurements reproduced from Refs. Reference Busby and Was66–Reference Edwards69 .

3. Phase stability/amorphization
Irradiation of the solute addition alloys in the CIR program included an alloy with increased Si content, alloy HS. Irradiation induced precipitation was observed after both proton and neutron irradiation of the alloy, with several distinct differences. After proton irradiation, γ′ was observed in the matrix, Reference Busby and Was67 consistent with observations by Jiao et al. in proton irradiated SS with added Si. Reference Jiao, Was, Busby, Allen, Busby and King70 Periodic segregation of Cr, Ni, and Si within grain interiors provided supplementary evidence for secondary phase formation. Reference Busby and Was67 No precipitation was observed at grain boundaries. After neutron irradiation, fine scale precipitates were observed in the matrix along with a few ∼20 nm diameter Ni-Si rich precipitates at grain boundaries. Reference Edwards, Schemer-Kohrn and Bruemmer68
Cann et al. Reference Cann, So, Styles and Coleman71 conducted proton irradiation of α-phase Zr–2.5Nb annealed at 970 K for 1 h. A fine dispersion of precipitates was observed within the α-grains in annealed Zr–2.5Nb alloy following 3.6 MeV proton irradiation for 18 h at 770 K and for 264.5 h at 720 K to a total damage of 0.94 dpa. Electron diffraction analysis of these precipitates found that they were consistent with the bcc Nb-rich β-phase. These β-phase precipitates were similar to those observed following neutron irradiation. Reference Urbanic and Gilbert72,Reference Coleman, Gilbert, Carpenter, Weatherly, Holland, Mansur and Potter73 This result showed that proton irradiation provided an accurate simulation of neutron irradiation with respect to the enhanced precipitation of β-phase precipitates in α-grains in Zr–2.5Nb.
Shen et al. Reference Shen, Peng, Xiang, Naab, Sun and Zu74 studied the behavior of precipitates in a Zr–1.6Sn–0.6Nb–0.2Fe–0.1Cr alloy under a 2 MeV proton irradiation using TEM. They confirmed that the major secondary phase, the Zr(Fe,Cr,Nb)2 precipitate with the hexagonal close packed (hcp) structure, started to amorphize following proton irradiation to 3.9 dpa at 360 °C and was completely amorphized at 8.2 dpa. The mechanism for the Zr(Fe,Cr,Nb)2 precipitate amorphization under proton irradiation was attributed to Fe diffusion from the Zr(Fe,Cr,Nb)2 phase to the zirconium alloy matrix. A comprehensive analysis of the phase instability, decomposition, and redistribution of precipitates in Zircaloy-2 and Zircaloy-4 during neutron irradiation confirmed that Zr(Fe,Cr)2 particles become amorphous in reactors. Reference Griffiths75
Zu et al. Reference Zu, Sun, Atzmon, Wang, You, Wan, Busby, Was and Adamson76 also studied proton-induced amorphization of precipitates in Zircaloy-4. They found that the partial amorphization of Zr(Fe,Cr)2 precipitate in Zircaloy-4 was achieved by 2 MeV proton irradiation to 5 dpa at an irradiation temperature of 310 °C. However, the amorphization of the Zr(Fe,Cr)2 precipitate in Zircaloy-4 was not observed after 2 MeV proton irradiation at 350 °C even up to 7 dpa. It is believed that irradiation temperature is one of the critical conditions for the precipitate amorphization, the higher the temperature the higher the critical dose needed for the amorphization.
Most recently, Francis et al. Reference Francis, Harte, Frankel, Haigh, Jadernas, Romero, Hallstadius and Preuss77 investigated the effect of irradiation on the composition of second phase particles (SPPs) in low tin ZIRLO using an aberration-corrected field-emission gun scanning transmission electron microscope capable of high resolution energy dispersive x-ray (EDX) spectrum imaging. The alloy was irradiated for five cycles in the Oskarsham 3 reactor to a dose of ∼18 dpa at 288 °C. Proton irradiation of the same alloy was conducted to 7 dpa with 2 MeV protons at a temperature of 350 °C. Precession nanobeam electron diffraction patterns from β-Nb SPPs after neutron irradiation to 18 dpa and proton irradiation to 7 dpa indicated that the SPP retained its crystallinity and was indexed as the bcc β-Nb phase with no evidence of amorphization. For both neutron and proton irradiated samples, segregation of iron to the interface of β-Nb SPPs found prior to irradiation was dispersed from the interface during irradiation. A loss of Fe from the Zr–Nb–Fe(–Cr) SPPs was observed for both irradiations. Proton irradiation to 2.3 and 7 dpa showed an increasing loss of Fe with dose. After neutron irradiation to 18 dpa, Fe was no longer found in the SPPs. The difference between proton and neutron irradiation results was attributed to the different doses, as results were consistent with the effect of dose on Fe loss. Similar to neutron irradiated material, the distribution of Cr also changed during proton irradiation.
4. Radiation hardening
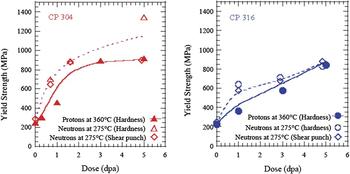
For the same alloy heats (CP304 and CP316) for which the dislocation microstructure was characterized earlier (Figs. 12 and 13), the hardening resulting from proton- and neutron-irradiation is presented in terms of yield strength increase, Reference Was, Busby, Gan, Kenik, Jenssen, Bruemmer, Scott and Andresen63 Fig. 17. The yield strength was calculated from hardness measurement (protons and neutrons) Reference Higgy and Hammad78 using the relation: Δσy = 3.55 ΔHv, where Δσy is the increment in yield strength (MPa), and ΔHv is the increment in hardness (kg/mm2), or from shear punch measurement (neutrons) Reference Hamilton, Garner, Hankin, Faulkner, Toloczko, Hamilton, Kumar, Rosinski and Grossbeck79 using the relation: σy = m(τmeas − τo), where σy is the tensile yield strength (MPa), τmeas is the measured shear yield strength (MPa), τo is the offset parameter (MPa), and m is a constant. The Busby relation between hardness and yield strength Reference Busby, Hash and Was80 yielded similar agreement. Both sets of data showed that in CP304, initial rapid hardening was followed by saturation by ∼3 dpa, and in CP316, hardening continued to increase with dose through 5.0 dpa. The yield strength determined from hardness measurements of neutron irradiated samples agreed well with those from shear punch tests on neutron-irradiated samples and hardness on proton-irradiated samples with the exception of the 5.0 dpa sample of CP304, which showed considerably higher hardness.
Dose dependence of yield strength as determined from hardness (proton- and neutron-irradiated) and shear punch (neutron-irradiated) measurements on (a) CP 304 SS and (b) CP 316 SS irradiated up to 5.0 dpa. Reference Was, Busby, Gan, Kenik, Jenssen, Bruemmer, Scott and Andresen63

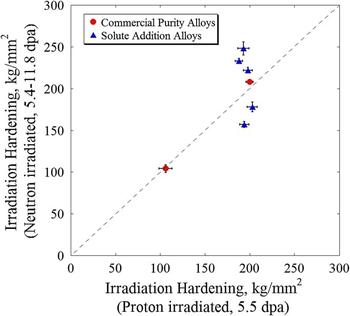
A comparison of hardening of solute addition alloys and commercial alloys, described earlier for their RIS behavior (Fig. 16), is shown in Fig. 18. Reference Stephenson and Was65 Note that proton irradiation resulted in very similar hardening among all solute addition alloys, while neutron irradiation showed larger variation, due in part to the spread in the dose. The point at the lower left is from a solution annealed 316 alloy.
Comparison of irradiation hardening after neutron irradiation to 5.4–11.8 dpa at 320 °C and proton irradiation to 5.5 dpa at 360 °C. Reference Stephenson and Was65

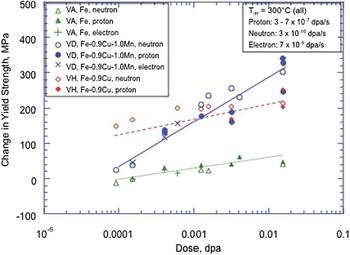
Irradiation hardening in ferritic steels was investigated using a series of three iron-based RPV model alloys subjected to neutron, proton, and electron irradiation at a temperature of approximately 300 °C. Reference Was, Hash and Odette81 The series consisted of a simple ferritic alloy with no solute additions (VA), a ferritic alloy containing 0.9 wt% Cu (VH), and a simple ferritic alloy containing 0.9 wt% Cu and 1.0 wt% Mn (VD). Figure 19 shows hardening versus dose for proton and neutron irradiations, as well as electron irradiations reported previously, all at different dose rates. Reference Odette, Yamamoto and Klingensmith82,Reference Alexander, Rehn, Odette, Lucas, Klingensmith, Gragg, Bruemmer, Ford and Was83 The hardening in unalloyed VA is on average slightly less than for proton irradiations, but overall the results are remarkably consistent between the three types of irradiations. The same is true for the VH and VD alloys.
Dose dependence of hardening in alloys VA, VH, and VD irradiated with protons, neutrons, and electrons over a wide range of damage rates. Reference Was, Hash and Odette81,Reference Odette, Yamamoto and Klingensmith82,Reference Alexander, Rehn, Odette, Lucas, Klingensmith, Gragg, Bruemmer, Ford and Was83

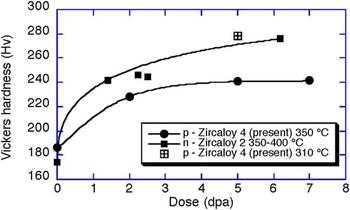
Finally, the irradiation hardening of Zr-4 was investigated by proton irradiation at 310 and 350 °C to doses between 2 and 7 dpa. Reference Zu, Sun, Atzmon, Wang, You, Wan, Busby, Was and Adamson76 Results are shown in Fig. 20 and compared favorably both in magnitude and rate of increase to those from neutron irradiation of Zr-2 between 350 and 400 °C. Reference Shimada and Nagai84
Vickers hardness for proton irradiated Zircaloy 4 Reference Zu, Sun, Atzmon, Wang, You, Wan, Busby, Was and Adamson76 and data for neutron-irradiated Zircaloy 2. Reference Shimada and Nagai84

5. Localized deformation
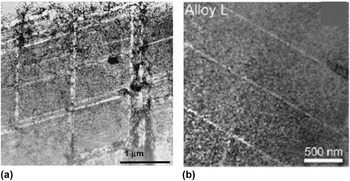
A consequence of irradiation in most all metals and alloys is a change in plastic deformation mode from homogeneous slip to highly localized deformation. Farrell et al. Reference Farrell, Byun and Hashimoto85 conducted tensile testing of irradiated 316 SS, A533B steel, and Zircaloy-4 and found that irradiation encourages planar deformation leading to dislocation channeling, which contributes to changes in the tensile curve, particularly reduced work hardening and diminished uniform ductility. The same is true for proton-irradiated steels. Jiao et al. Reference Jiao, Busby and Was86–Reference Jiao, Was, Miura and Fukuya91 have shown that very similar effects are observed in proton-irradiated stainless steels and ferritic–martensitic steel. As shown in Fig. 21, straining to 32% 316L stainless steel irradiated in reactor resulted in dislocation channels, similar to those produced in a Fe–18Cr–12Ni steel irradiated with protons and strained to 7%.
(a) Dislocation channels in 316 stainless steel irradiated to in-reactor to 0.78 dpa at 60–100 °C and strained 32% at room temperature, Reference Farrell, Byun and Hashimoto85 and (b) in Fe–18Cr–12Ni irradiated with 2 MeV protons to 5.5 dpa and strained to 7% at 288 °C. Reference Jiao, Busby and Was86

Fournier et al. Reference Fournier, Serres, Auzoux, Leboulch and Was92 conducted proton irradiation (2 MeV, 305 °C) on full recrystallized Zircaloy-4 in the form of tensile bars. Channeling in Zircaloy-4 proton-irradiated to 2 dpa and strained in the transverse direction to 0.5% macroscopic plastic strain at a strain rate of 10−5 s−1 was investigated following the method proposed by Onimus et al. Reference Onimus, Monnet, Bechade, Prioul and Pilvin93 Basal channels were predominant, in good agreement with the observations of Onimus et al. on neutron irradiated Zircaloy-4. A strong correlation between high basal Schmid factor and the occurrence of basal channeling was observed in seven grains containing basal channels out of 22 well-oriented grains for basal slip. In contrast, prismatic channeling was found to occur in only 1 out of the 9 grains with a maximum prismatic Schmid factor. These results were in good agreement with the observations of Onimus et al. Reference Onimus, Monnet, Bechade, Prioul and Pilvin93 on neutron-irradiated Zircaloy-4 and also suggested that the basal critical resolved shear stress (CRSS) was lower than the prismatic CRSS after proton irradiation to 2 dpa, and that irradiation induced a change in the hierarchy of CRSS. The mean loop diameter and density determined in the study were consistent with that determined by Northwood et al. Reference Northwood, Gilbert, Bahen, Kelly, Blake, Jostsons, Madden, Faulkner, Bell and Adamson94 for Zircaloy-2 neutron irradiated to 1 × 1025 n/m2 at 342 °C. Basal channels were observed, in good agreement with the observations of Onimus et al. Reference Onimus, Monnet, Bechade, Prioul and Pilvin93 on neutron irradiated Zircaloy-4.
6. Irradiation creep and stress relaxation
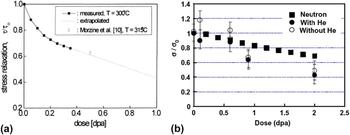
Scholz and Matera Reference Scholz and Matera95 conducted torsional creep tests on Inconel 718 in the precipitation hardened condition under 17 MeV proton irradiation at 300 °C up to a dose of 0.35 dpa. The creep rate showed the expected linear dependence for applied shear stresses between 150 and 450 MPa. Stress relaxation was also measured and amounted to about 30% after a dose of 0.35 dpa, in good agreement with in-pile irradiation at 315 °C, Fig. 22(a). Reference Baicry, Mardon, Morize, Adamson and Van Swam96
Stress relaxation for (a) Inconel 718 after proton irradiation using 17 MeV protons at 300 °C Reference Scholz and Matera95 and compared with in-pile measurements at 315 °C, Reference Baicry, Mardon, Morize, Adamson and Van Swam96 and (b) 304 SS irradiated with 3.2 MeV protons at 288 °C Reference Sencer, Was, Yuya, Isobe, Sagisaka and Garner97 and compared with neutron irradiation predictions. Reference Garner and Frost51

Sencer et al. Reference Sencer, Was, Yuya, Isobe, Sagisaka and Garner97 conducted stress relaxation of shot peened 304 SS to induce a compressive stress, followed by irradiation at 288 °C using 3.2 MeV protons to a dose of 2.0 dpa. Depth-dependent measurements of internal stress were conducted using successive steps of x-ray line broadening measurement and electropolishing. The results showed that the compressive stress state was progressively relaxed throughout the dose range and that preinjection of helium did not significantly affect the relaxation, Fig. 22(b). A comparison of the results from proton irradiation and predictions based on neutron-induced relaxation of externally applied stresses Reference Garner and Frost51 showed good agreement.
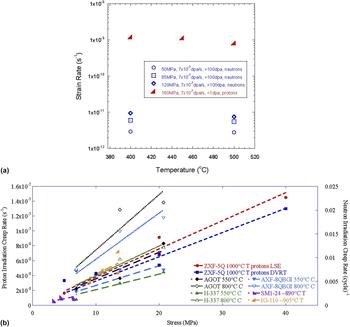
Xu and Was Reference Xu and Was98 conducted irradiation creep experiments on ferritic–martensitic steel T91 using 3 MeV protons at doses up to 1 dpa and under stress ranging between 100 and 200 MPa and temperature between 400 and 500 °C. They observed that there was no significant effect of temperature on the creep rate in this regime, and below 160 MPa, the creep rate was proportional to the stress. The parametric dependences were in good agreement with in-reactor creep measurements on the same alloy in-reactor, and Fig. 23(a) shows a comparison of the temperature dependence of creep rates. The rates were higher in the proton irradiation experiment due to the thinness of the samples and the different creep regimes in which the experiments were conducted, but the dependence was the same. Cheng showed that the creep rate was likely governed by a combination of stress assisted preferential absorption and preferential absorption glide. Reference Xu and Was98
Proton irradiation creep compared to reactor creep: (a) Temperature dependence in T91 ferritic–martensitic steel, Reference Xu and Was98 and (b) stress dependence in ultra-fine grain graphite. Reference Campbell, Campbell and Was99

Campbell et al. Reference Campbell, Campbell and Was99 conducted irradiation creep experiments on ultra-fine grain graphite in the temperature range 900–1200 °C with stresses between 5 and 20 MPa and to a maximum dose of 1.0 dpa. Irradiation creep rate exhibited a linear dependence on the applied tensile stress, the dose rate and the temperature, and no dependence on the dose up to 1.0 dpa. Results were in excellent agreement with reactor creep experiments in the stress dependence of irradiation creep in graphite, Fig. 23(b). Both proton and neutron irradiation data show little dependence on temperature and dose rate, but the creep rates for proton irradiation were higher than those for reactor data by about an order of magnitude. The changes in the lattice parameters compared favorably with those after neutron irradiation at similar temperature and dose.
7. Corrosion and irradiation assisted stress corrosion cracking
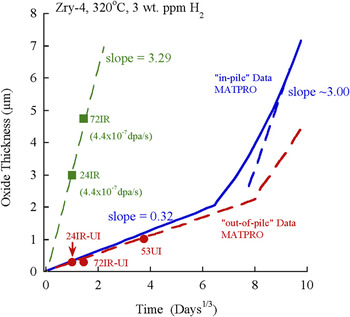
Irradiation of alloys in aqueous environments is known to enhance the corrosion rate. In particular, the oxidation rate of zirconium alloys in-pile can be a factor of 5 or more than that out-of-pile. Wang and Was Reference Wang and Was100 conducted proton irradiation of Zircaloy-4 in situ in simulated PWR primary water (320 °C, 3 appm H2, without addition of B and Li) in which the 50 mm thick Zr-4 sample served as both the window between the high vacuum beamline and the high temperature, high pressure primary water through which 3.4 MeV protons penetrated to doses of 0.04–0.12 dpa at a dose rate of 4.4 × 10⁻⁷ dpa/s. The morphology of the oxide formed during proton irradiation was similar to the oxide formed under neutron irradiation and consisted of equiaxed monoclinic ZrO2, with a preferential grain orientation. A large volume fraction of cracks and fine pores was present throughout the thickness of the oxide. SPPs underwent accelerated oxidation after being consumed by the oxide. Unirradiated areas of the proton-irradiated samples exhibited corrosion kinetics that were in good agreement with out-of-pile test results, indicating that water radiolysis had negligible effects on the corrosion rate of zirconium.
The corrosion kinetics of Zircaloy-4, both in-pile and out-of-pile, has been studied extensively. Figure 24 shows oxide thickness data from the in situ irradiation-corrosion experiment compared with in-pile data generated from MATPRO. Reference Allison101 The unirradiated oxide growth rate of the reference sample was in good agreement with out-of-pile data. Reference Allison101 The proton irradiation data are also shown and the growth rate was about a factor of 10 higher than in the unirradiated case. Note that the growth rate was similar to that for in-pile behavior in the post-transition regime. In this regime, the oxide growth rate should be proportional to the dose rate. Therefore, equating the ratio of oxide growth rate to dose rate for protons to that for neutrons yields a neutron dose rate of ∼4.4 × 10⁻⁸ dpa/s, in good agreement with the range of values in the literature; 3.2–6.5 × 10⁻⁸ dpa/s [see Ref. Reference Wang and Was100]. This relationship suggested that oxidation under proton irradiation follows post-transition growth kinetics.
Plot of oxide thickness as a function of corrosion time for in-pile and out-of-pile data Reference Allison101 and in situ proton irradiation-corrosion data.

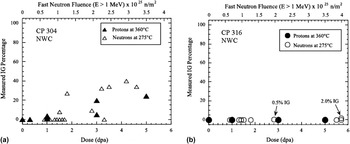
One of the most pressing technological problems to which proton irradiation has been applied is IASCC. This is in many ways the ultimate “test” of an emulation technique as IASCC is believed to be due to a combination of irradiation induced changes in the alloy, including RIS, radiation hardening, and the inducement of localized deformation. Two experiments were conducted using the same heats of alloys that were irradiated in reactor and with protons and subsequently tested to assess the effect of irradiation on initiation of stress corrosion cracking. In the first experiment, CP 304 SS and CP 316 SS were irradiated in the Barsebäck BWR in Sweden to doses up to 6 dpa. Reference Was, Busby, Gan, Kenik, Jenssen, Bruemmer, Scott and Andresen63 Archive material of the same heats was irradiated with 3.2 MeV protons to doses up to 5 dpa. Neutron irradiated samples were subsequently strained in 288 °C simulated BWR normal water chemistry (NWC) for 168 h followed by straining to failure in air. Proton irradiated samples were strained to fracture in the same environment and temperature and the %IG on the fracture surfaces was measured. Analysis of %IG in the proton-irradiated samples was limited to the depth of penetration of the proton beam. Despite the difference in the test procedures, comparison of results [Figs. 25(a) and 25(b)] showed excellent agreement between proton and neutron irradiated results in three respects. First, both showed [Fig. 25(a)] that intergranular stress corrosion cracking (IGSCC) in CP 304 SS begins to occur at a damage level of ∼1 dpa. Second, the %IGSCC for both proton- and neutron-irradiated samples was comparable [Fig. 25(a)] in magnitude and rises slowly through 5 dpa of damage. Third, the data were in excellent agreement that CP 304 SS was considerably more susceptible to IGSCC compared to CP 316 SS [Fig. 25(b)].
IG cracking susceptibility of proton- and neutron-irradiated CP 304 SS (a) and CP 316 SS (b), strained in simulated BWR-NWC. Reference Was, Busby, Gan, Kenik, Jenssen, Bruemmer, Scott and Andresen63

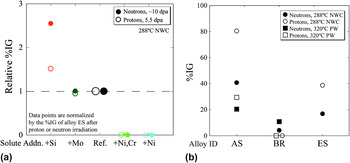
In another experiment, a set of solute addition alloys from the CIR program with base composition Fe–18Cr–12Ni and containing single solute additions was irradiated in the BOR-60 reactor at 320 °C to doses between 5.4 and 11.8 dpa, and archive material was also irradiated with 3.2 MeV protons at 360 °C to a fixed dose of 5.5 dpa. Constant extension rate tensile tests on both sample sets were conducted in simulated BWR NWC at 288 °C in the same laboratory. Reference Stephenson and Was65 The %IG cracking on the fracture surfaces was measured on both sample sets and the results are shown in Fig. 26(a) as %IG relative to the reference Fe–18Cr–12Ni alloy without solute addition (heat ES). As shown in this figure, the agreement is remarkable. Relative to the reference heat, the addition of either Ni (heat KS) or Ni and Cr (heat LS) completely suppressed cracking in both neutron- and proton-irradiated samples. The addition of Mo (heat GS) produced no discernable effect on IG cracking in either of the irradiated samples. Finally, the addition of Si resulted in a substantial increase in %IG for both irradiations. This agreement was perhaps the most notable of all of the existing data in that IASCC incorporates so many features in the irradiated microstructure. It also emphasized the importance of conducting experiments on the same heat of material to obtain a valid comparison by eliminating heat-to-heat variations. A comparison of IASCC of commercial 304 SS (AS) and 316 SS (BR) to the reference high purity heat ES was also conducted and the agreement is shown in Fig. 26(b).
Comparison of %IG after CERT testing of neutron- and proton-irradiated alloys; (a) high purity solute addition alloys tested in simulated BWR NWC and (b) commercial purity alloys tested in BWR NWC and simulate primary water. Reference Stephenson and Was65

It is worthy of note here that the CIR program that focused on the comparison of proton and neutron irradiation of CP 304 SS and CP 316 SS included the assessment of multiple microstructure and property responses to irradiation including RIS, dislocation microstructure, precipitation, void formation, hardening, deformation mode, and IASCC. Reference Was, Busby, Gan, Kenik, Jenssen, Bruemmer, Scott and Andresen63 While, there exist differences between neutron and proton irradiation due to test technique or measurement uncertainties, in all cases, there is agreement. The significance of this outcome is that all characterized features resulting from irradiation were found to be in agreement, not just one.
B. Self-ion irradiation
Very few experiments have been performed in which the microstructure or properties of heavy- or self-ion irradiations have been benchmarked against those from reactor irradiation. A study Reference Was, Jiao, Beckett, Sun, Monterrosa, Maloy, Anderoglu, Sencer and Hackett102 recently published compared the full extent of the entire irradiated microstructure created in-reactor to that produced by self-ion irradiation designed to emulate that microstructure. Ferritic–martensitic alloy HT9 (Fe–12Cr–1Mo) heat 84425 was used in the hexagonal fuel bundle duct labeled ACO-3, in the fast flux test facility (FFTF). It was heat treated at 1065 °C/30 min/air cooled followed by 750 °C/60 min/air cooled. The fuel bundle was irradiated in several locations in FFTF over the time period 1985–1992 during which it accumulated a total damage of about 155 dpa at an average temperature of 443 °C. Reference Sencer, Kennedy, Cole, Maloy and Garner103 Pieces from an archival section of this same duct were irradiated in a 1.7 MV tandem accelerator with self-ions (Fe++) at 5 MeV at a temperature of 460 °C and to a dose of 188 dpa determined using SRIM Reference Ziegler, Ziegler and Biersak104 in the Kinchin–Pease mode. Reference Stoller, Toloczko, Was, Certain, Dwaraknath and Garner105 At this energy, Fe++ ions come to rest at a depth of approximately 1.6 µm below the surface. The ion irradiation temperature represents a 17 °C increment above the neutron irradiation temperature, as predicted by invariance theory. Reference Mansur32 Temperature was closely monitored throughout the irradiation using a two-dimensional infrared thermal imager and ion beam current was monitored before and during the experiment. To emulate transmutation in reactor, helium was implanted prior to ion irradiation to a concentration of 1 appm over a depth range of 300–1000 nm by varying the implantation energy over five different values. This amount of He was set below that generated in reactor to compensate for the initially high He/dpa ratio in the ion irradiation experiment.
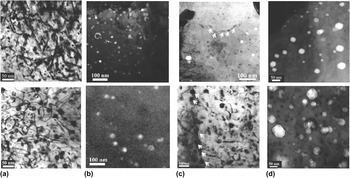
Figures 27(a)–27(d) show pairs of images of each microstructure feature (dislocation loops, precipitates, and voids) characterized in both ion- and reactor-irradiated samples of HT9 heat 84425. Qualitatively, the microstructures showed all the same radiation-produced features. In both cases, the dislocation microstructure consists of dislocation line segments (a<100> and (a/2)<111>) and loops, predominantly a< 100> type, of similar diameter (∼20 nm) and number density (5–9 × 10²⁰ m−3) [Fig. 27(a)]. Radiation-induced precipitates were primarily G-phase as shown in the dark field TEM image [Fig. 27(b)] and a Cr-rich phase (not shown). The composition of the G-phase was confirmed by APT to be close to Mn6Ni16Si7. G-phase precipitates also appeared along grain boundaries in both cases, as shown in the TEM bright field images in Fig. 27(c). The Cr-rich phases under reactor irradiation contained only Cr, and those irradiated with Fe++ consisted of Cr with a few percent carbon. Void formation was very heterogeneous in both reactor and Fe++ irradiated samples, with large variations between grains and laths. However, the size and number density were similar [Fig. 27(d)].
Comparison of irradiation microstructure in HT9 following Fe++ irradiation (460 °C:188 dpa with 1 appm helium, top images) and following reactor irradiation in FFTF (443 °C:155 dpa, bottom images): (a) bright field TEM images of line dislocations and loops, (b) dark field TEM images of G-phase precipitates in the matrix, (c) bright field images of G-phase precipitates along grain boundaries, and (d) voids, from Ref. Reference Was, Jiao, Beckett, Sun, Monterrosa, Maloy, Anderoglu, Sencer and Hackett102.

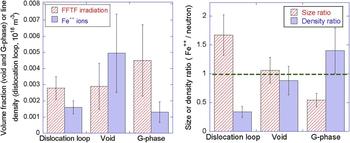
A quantitative comparison showed the volume fraction of swelling and precipitates and the total loop line length for the ion irradiation relative to reactor irradiation [Fig. 28(a)], and a comparison of defect size and number density as a ratio of ion irradiation to reactor irradiation [Fig. 28(b)]. The void swelling was nearly identical between the two irradiations, and the size and density of precipitates and loops following ion irradiation were within a factor of two of those for reactor irradiation. Results indicated that, as predicted by invariance theory, the reactor-irradiated microstructure can be emulated by ion irradiation with only a modest temperature increment (17 °C). The damage increment (33 dpa) over the reactor irradiation was also small. These results indicate that an Fe++ irradiation at 460 °C with a preinjection of 1 appm He emulates the irradiated microstructure, both qualitatively and quantitatively (within a factor of two), created by fast reactor irradiation at an average temperature of 443 °C and to a similar damage level.
Comparison of (a) volume (voids, precipitates) fraction or line density (loops), and (b) size and number density ratios for ion and neutron irradiation under similar conditions, from Ref. Reference Was, Jiao, Beckett, Sun, Monterrosa, Maloy, Anderoglu, Sencer and Hackett102.

A set of experiments similar to that for F–M steel was conducted on solution annealed 304L SS from a core shroud, and cold worked 316 SS from a baffle bolt. Reference Was, Jiao, Van der ven, Buremmer and Edwards106 Both steels were irradiated in the BOR-60 reactor to doses of 5.4, 10.3, and 46 dpa. Archive material from both heats was irradiated with 5 MeV Ni++ ions at temperatures and doses of 380 °C:46 & 260 dpa, 500 °C:46 dpa, and 600 °C:46 dpa. Ni++ ion irradiation at 380 °C produced a dislocation loop microstructure close to that by neutron irradiation at 320 °C in terms of loop size and density for the 304L SS. For the 316L SS, the dislocation loop density was a factor of 4 lower than that in reactor and no SFTs were observed.
Ni/Si-rich clusters were observed in self-ion irradiated 304L SS (5 MeV Fe++) at 380 °C:46 dpa and they were likely precursors of G-phase. Some of the Ni/Si-rich clusters reached the composition of G-phase at 260 dpa. Reference Jiao and Was107 However, the precipitate size was smaller and the density was lower compared to neutron irradiations at 320 °C to 46 dpa, indicating that a temperature shift larger than 60 °C may be needed for SA 304L SS to produce comparable G-phase morphology. G-phase precipitates were observed in cold worked 316 SS following self-ion irradiation to 46 dpa at 380 °C, although most of the Ni/Si-rich clusters were still in the precursor stage. Considering only the G-phase particles, the average size was ∼4 nm and the number density is estimated to be 0.1 × 10²³ m−3. The average size of precipitates by self-ion irradiations at 380 °C:46 dpa was slightly smaller than those found in neutron irradiated samples at 320 °C:46 dpa (∼5 nm) but at higher density (number density in neutron irradiated samples was reported to be <0.1 × 10²³ m−3). The temperature shift for cold worked 316 SS appeared to be smaller than that of solution annealed 304L SS probably due to the high density of dislocations, which served as defect sinks and mitigated the effect of high dose rate.
Radiation induced segregation in cold worked 316 SS by heavy ion irradiation at 380 °C was comparable to that by neutrons at 320 °C. The small temperature shift for RIS in this alloy may be due to the highly deformed microstructures, which consist of high density of defect sinks. There was substantial difference in the magnitude of segregation between ion and neutron irradiation to similar doses in the SA 304L SS alloy with less segregation in ion irradiation than in neutron irradiation. Increasing the temperature to 500 °C increased the magnitude of segregation but the widths of the enriched or depleted zones were much larger at the higher temperature. Results appear to follow the invariance relations, which predict that larger temperature shifts are required to match RIS than the loop or void microstructure.
VI. SUMMARY
Ion irradiation has been used for many years to understand the basic elements of radiation damage in materials, yet it is only recently that ion irradiation has been considered as a surrogate for neutron irradiation with the goal of substituting for neutron irradiations in determining how materials will respond in reactor. While ion irradiation enjoys many advantages over reactor irradiation such as high damage rates, excellent control over irradiation conditions, minimal activation, and very low cost, it also faces several challenges such as differences in the PKA spectrum, accelerated damage rates, lack of transmutation products, the effect of the injected interstitial, and the shallow penetration depth giving rise to surface effects and a limited analysis volume.
The number of well-controlled studies that provide direct comparison of the effect of ion irradiation versus neutron on microstructure and properties of materials are few. More work has been done with proton irradiation and the results provide substantial encouragement. There is now a growing body of evidence that shows that proton irradiation can emulate numerous features of the irradiated microstructure both qualitatively and quantitatively such as dislocation network and loop structure, precipitation/phase stability and amorphization, void formation, radiation-induced segregation, etc., and properties of irradiated materials such as hardening, deformation mode, irradiation creep and stress relaxation, irradiation accelerated oxidation, and IASCC. In fact, several studies have shown that by conducting well-controlled experiments in which reactor irradiation and proton irradiation are performed on the same alloy heats, the full suite of irradiation-induced microstructural features and resulting properties compare favorably both qualitatively and quantitatively.
Self-ion irradiation studies are much less common. However, a recent study on a ferritic–martensitic steel shows that well-controlled experiments combined with an account of the differences between reactor- and accelerator-based irradiations can create all of the same radiation-produced defect or defect-solute clusters (loops, voids, precipitates) with similar sizes and number densities as those created in-reactor.
While a comprehensive theoretical framework is still lacking, these results provide optimism that ion irradiations can be tailored to emulate the full suite of radiation effects in a reactor environment, thus greatly speeding the development of new materials to enable both the introduction of advanced reactor concepts and the extension of the current LWR fleet.