INTRODUCTION
From the first global ocean survey of radiocarbon (14C) by the GEOSECS in the 1970s to the most recent oceanic survey as part of CLIVAR, both natural and anthropogenic 14C (T1/2=5700 yr) have been proven to be an extremely valuable tool in oceanography (Östlund and Stuiver Reference Östlund and Stuiver1980; Broecker et al. Reference Broecker, Sutherland, Smethie, Peng and Ostlund1995; Key Reference Key and Steele2001). The primary application of early radiocarbon results was to estimate the fluxes of CO2 between the atmosphere and ocean and the average residence time of dissolved CO2 in the surface ocean (Broecker Reference Broecker1991). Yet its potential to become an important tracer of deep ocean circulation and water mixing was successively proved by Östlund and Stuiver from the multiple GEOSECS sections (Östlund and Stuiver Reference Östlund and Stuiver1980; Stuiver Reference Stuiver1980). Since then, several oceanographic surveys (TTO, WOCE, CLIVAR, GO-SHIP) have included 14C as one of the key parameters (i.e. other than temperature, salinity, nutrients, etc.) and more than 28,000 radiocarbon analyses have been done by the world leading laboratory in Woods Hole Oceanographic Institution (WHOI) alone (McNichol et al. Reference McNichol, Quay, Gagnon, Burton, Hood, Sabine and Sloyan2010).
The analysis and measurement of 14C in seawater has significantly improved over the years. Samples taken during the first expeditions for the radiocarbon determination consisted in 250 L that were stored in the so-called Gerard barrels. Samples were pre-treated onboard to extract CO2, which was then stored in sodium hydroxide solutions in 500-mL bottles (Östlund and Stuiver Reference Östlund and Stuiver1980) and processed later in land-based laboratories. Briefly, the CO2 was extracted from the hydroxide solution by adding concentrated phosphoric acid, and then collected in cryotraps (–196ºC) using N2 as a carrier gas. Subsequently, the CO2 was passed through a purification system, which consisted of traps to condense water vapor (at −80ºC), and copper-silver (Cu-Ag) ovens (at 600ºC) to remove gaseous electronegative impurities (final yield of 99.9%). After completion of the purification phase, a small aliquot was branched off for a subsequent 13C analysis. The remaining sample was stored for three weeks in 50 cm3 stainless steel containers before counting 14C decays using traditional beta counting techniques (Östlund and Stuiver Reference Östlund and Stuiver1980; Stuiver and Östlund Reference Stuiver and Östlund1980; McNichol et al. Reference McNichol, Jones, Hutton, Gagnon and Key1994).
The first major advance in 14C determination in seawater occurred during the 1990s with the application of accelerator mass spectrometry (AMS) (Linick et al. Reference Linick, Damon, Donahue and Jull1989; Jones et al. Reference Jones, Gagnon, von Reden, McNichol and Schneider1994). This technique measures the number of individual 14C atoms making it comparably faster than traditional methods based on the detection of 14C decays (i.e. about 14 disintegrations/min/g of carbon for modern material) (Linick et al. Reference Linick, Damon, Donahue and Jull1989). The AMS technique therefore allowed to reduce the sample size by a factor of 1000: from 250 L of water to 250 mL (Linick et al. Reference Linick, Damon, Donahue and Jull1989; Key Reference Key and Steele2001) with a precision that quickly improved from 10‰ to <4‰ (Jones et al. Reference Jones, Gagnon, von Reden, McNichol and Schneider1994; Key et al. Reference Key, Quay, Schlosser, McNichol, von Reden, Schneider, Elder, Stuiver and Östlund2002). In these last 3 decades, major efforts have been devoted to optimizing the extraction of dissolved inorganic carbon (DI14C) from seawater, which mostly consists in two main steps: stripping and graphitization (McNichol et al. Reference McNichol, Quay, Gagnon, Burton, Hood, Sabine and Sloyan2010). In the first step, a vacuum system is used to extract the CO2 from the previously acidified seawater samples. The sample is bubbled with N2 to ensure that gaseous CO2 is completely stripped from seawater and subsequently transferred into the cold traps. The gas containing CO2 is stored in manifolds and then moved to the graphitization line to carry out the second step. There, CO2 is transferred to a reactor where it is catalytically reduced to carbon filaments at high temperature (625ºC) using H2 gas as the reducing agent and Fe as the reduced metal catalyst. The stripping and graphitization of samples takes about 45 min and 4 hr, respectively (McNichol et al. Reference McNichol, Jones, Hutton, Gagnon and Key1994). This technique was mainly developed at the National Ocean Sciences Accelerator Mass Spectrometry Facility (NOSAMS) in WHOI and has been applied worldwide as a well-established method for the determination of 14C in seawater. Yet, further developments have been performed in the last decade not only by the NOSAMS, but also by other international laboratories (Wacker et al. Reference Wacker, Fülöp, Hajdas, Molnár and Rethemeyer2013; Gao et al. Reference Gao, Xu, Zhou, Pack, Griffin, Santos, Southon and Liu2014). The headspace extraction of CO2 instead of the conventional stripping method has succeeded in the reduction of extraction times to 15 min (Molnár et al. Reference Molnár, Hajdas, Janovics, Rinyu, Synal, Veres and Wacker2013; Gao et al. Reference Gao, Xu, Zhou, Pack, Griffin, Santos, Southon and Liu2014) with the big benefit of avoiding to clean or to flush the vacuum line (Gao et al. Reference Gao, Xu, Zhou, Pack, Griffin, Santos, Southon and Liu2014). Further reduction of processing times to 20 min has been achieved with the new system implemented in WHOI: the Rapid Extraction of Dissolved Inorganic Carbon System (REDICS). This system utilizes a gas-permeable polymer membrane contactor to extract the DIC from the acidified water samples in the form of CO2, which is then introduced to a helium gas stream and cryogenically isolated before stable and radiocarbon isotope analysis (Gospodinova et al. Reference Gospodinova, McNichol, Gagnon and Shah Walter2016).
One of the latest advances in 14C determination was the development of the Automated Graphitization Equipment (AGE) at the Laboratory of Ion Beam Physics (LIP), ETH Zurich (Wacker et al. Reference Wacker, Němec and Bourquin2010). The AGE system: (1) allowed for the first time to couple the elemental analyzer with the graphitization line; (2) uses He as a CO2 carrier gas; (3) replaces the cryotraps by molecular sieve traps (i.e. zeolite) (Choe et al. Reference Choe, Song, Hoon Lee, Mi Song, Kang, Yun and Chan Kim2013); and (4) couples the headspace extraction of CO2 to a He flow line such that no vacuum system is required (Wacker et al. Reference Wacker, Němec and Bourquin2010, Reference Wacker, Fülöp, Hajdas, Molnár and Rethemeyer2013; Molnár et al. Reference Molnár, Hajdas, Janovics, Rinyu, Synal, Veres and Wacker2013). This system was further developed for the determination of 14C in groundwater samples (Molnár et al. Reference Molnár, Hajdas, Janovics, Rinyu, Synal, Veres and Wacker2013) but had never been tested in seawater samples. The goal of this study is therefore to optimize the AGE system for the radiocarbon determination of dissolved inorganic carbon (DIC) in seawater samples. On the technical side, the motivation behind this study was to: (1) reduce sample volumes (<100 mL); (2) decrease processing times of extraction and graphitization (<5 hr for 7 samples); (3) reproduce the results in subsamples; and (4) get to a precision of ≤2‰ F14C. On the oceanographic context, there is still a lack of sufficient spatial resolution of 14C data to allow for meaningful objective mapping (Matsumoto Reference Matsumoto2007). A precise, fully automated method for small sample volumes is therefore required, that guarantees a high sample throughput. This will allow to infer general large-scale circulation patterns and understand the deep ocean mixing and ventilation rates (Key Reference Key and Steele2001).
METHODS
Seawater Samples
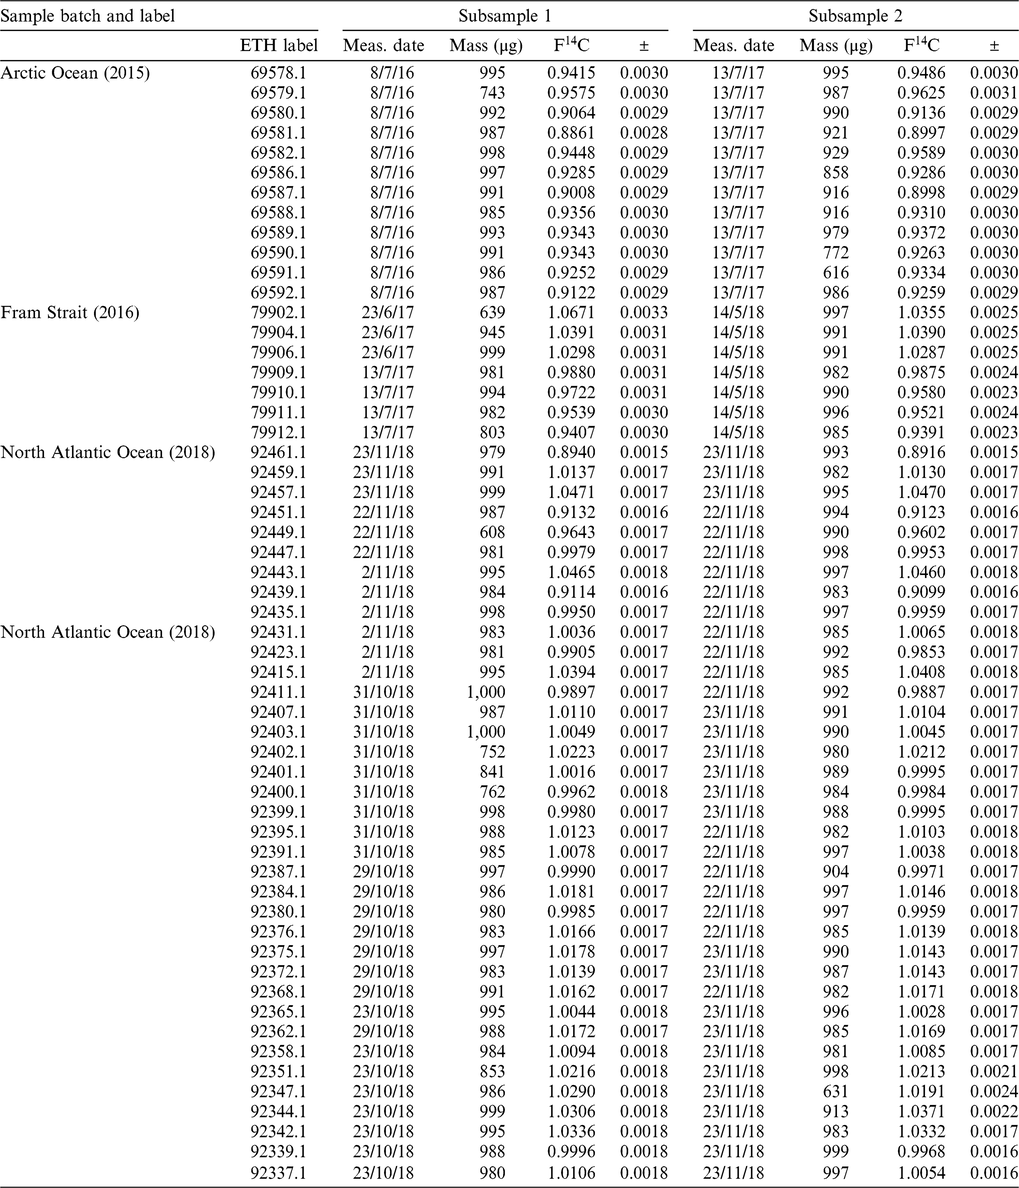
The seawater samples used for the optimization of this method were collected during three different GEOTRACES expeditions. Deep seawater samples were collected in the Arctic Ocean in 2015 (transect GN04). One full depth profile was taken in the Fram Strait in 2016 (GN05) and several more in the North Atlantic Ocean in 2018 (GA01) (Table 1). Seawater samples were collected from the corresponding seawater sampling bottles (i.e. Niskin bottles attached to a CTD rosette) and transferred to serum 100 mL glass bottles (with actual capacity of 120 mL). These glass bottles had been previously cleaned with diluted HCl in the land-based laboratory. Once bottles were filled, samples were poisoned on-site with HgCl2 to stop biological activity and subsequently sealed with a rubber septum. Finally, samples were stored in the fridge (5ºC) before the extraction and graphitization of CO2.
Information on the different sets of seawater samples processed and analyzed in this work. The experimental setups (initial and optimized) are described in the Methods section. For the Cu furnace, “old” refers to the built-in furnace of the Elemental Analyzer, “new” refers to the self-made furnace.

Initial Experimental Setup
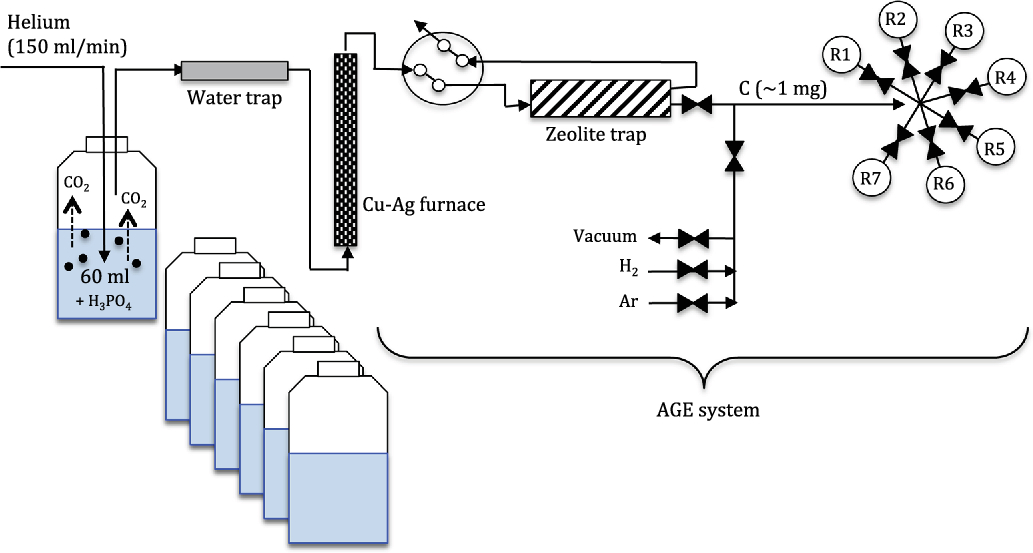
The initial experimental setup consisted in applying the method used in groundwater samples (Molnár et al. Reference Molnár, Hajdas, Janovics, Rinyu, Synal, Veres and Wacker2013) to seawater samples (Figure 1, without Cu-Ag furnace). First, in order to split the sample in two identical subsamples, a total of 60 mL of the original 120 mL sample was transferred to an identical empty and sealed glass bottle that had been previously flushed with He. The transfer of half of the sample was done by flushing the original bottle with a He gas flow which pushed part of the sample to the contiguous bottle using two needles connected with a thin steel tube. The first sample (i.e. remaining half in the original bottle) was then acidified with 1 mL 85% H3PO4 and heated overnight in the oven at 60ºC to allow for a more efficient outgassing of the CO2 from the water phase to the headspace. On the next day, the CO2 was degassed from water with He at a flowrate of 150–180 mL/min during 4–6 min using a double walled needle and flushed over a sicapent trap containing phosphorus pentoxide to remove any residual water. The gas containing He and CO2 was then directly introduced to the automated graphitization system (AGE) where CO2 is trapped in a molecular sieve trap (zeolite X13, 200 mg, mesh 60–80) and later thermally released and transferred to the reactor by gas expansion (Wacker et al. Reference Wacker, Němec and Bourquin2010; Choe et al. Reference Choe, Song, Hoon Lee, Mi Song, Kang, Yun and Chan Kim2013). The sampler was specifically designed to extract DIC from 7 seawater samples in a row. The fully automated method was controlled via a LabVIEW program that runs through all consecutive steps: catalyst preconditioning, CO2 extraction, CO2 trapping, thermal CO2 release from the trap into the reactor and finally, the graphitization reaction which is performed simultaneously in the 7 reactors. DIC is graphitized on 4.5 mg of iron powder as a catalyst and finally samples are pressed into Al targets for the AMS measurements using the MICADAS system (Synal et al. Reference Synal, Stocker and Suter2007).
Schematic setup of the fully coupled extraction line including Cu-Ag furnace, zeolite trap and the 7 reactors (R1-R7). The initial setup did not include the Cu-Ag furnace.

Optimized Experimental Setup
The optimization of the initial setup consisted in adding a Cu-Ag furnace to remove traces of sulfur compounds, nitrogen oxides and halogens (Povinec et al. Reference Povinec, Oregioni, Jull, Kieser and Zhao2000). This was placed between the sicapent water trap and the zeolite trap (Figure 1). At first, the original Cu-Ag tube from the Elemental Analyzer (EA) was used (108 cm3, 24 cm length, 2.4 cm inner diameter and 1 cm of silver wool at both ends). Later, this was replaced by a smaller glass tube (36 cm3, 20 cm length, 1.8 cm inner diameter) filled with copper (Elementar S05000699) in the middle and 1 cm of silver wool (Elementar S2213165) at both ends placed inline within a small tube furnace set to 550ºC. The advantage is a significantly smaller Ag-Cu volume that is flushed more efficiently and therefore reduces the risk of sample contamination as well as cross-contamination between consecutive samples.
Blanks, Reference Material, and Standard
Two types of blanks were prepared. Combustion blanks consisted on Pthalic Anhydride (1.6–2 mg) which were combusted in the EA and graphitized in the AGE system (n=17). A second type of blanks was prepared with 60 mL deionized water (i.e. milliQ) containing 10 mg of dissolved IAEA C1 (n=35). These blanks (hereinafter referred as process blanks) were treated as the seawater samples and were intended to better represent the extraction and graphitization steps. In a later stage the milliQ water used to prepare the process blanks was acidified with H3PO4 and flushed with He before adding the IAEA C1 (n=9/35).
A coral sample was used as a reference material, with a nominal value of 0.9447 ± 0.0002 (G. Dos Santos, personal communication). This reference material (ca. 10 mg) was prepared similar to the process blank and following the method used for the seawater samples. A total of 17 coral reference samples have been processed and measured during the optimization of the method. Finally, NIST SRM 4990C oxalic acid (OXAII) was used for standard normalization and to check the stability of the measurement (Wacker et al. Reference Wacker, Fülöp, Hajdas, Molnár and Rethemeyer2013). OXAII standards (5.2–5.5 mg) (n=51) were prepared by direct combustion in the EA before entering the AGE system.
Reproducibility of the Method
The reproducibility of the method in seawater samples was tested by processing and measuring the second subsample (60 mL) previously transferred to another 100 mL glass bottle and stored in the fridge. Note that: i) samples taken in the Arctic Ocean and Fram Strait were stored for about one year before processing the second replicate and; ii) samples from the Arctic Ocean were processed using two different setups (i.e. initial vs. optimized) (Table 1).
AMS Measurements
The radiocarbon analyses were performed on the MICADAS radiocarbon dating system at ETH Zurich (Synal et al. Reference Synal, Stocker and Suter2007), equipped with permanent magnets (Salehpour et al. Reference Salehpour, Håkansson, Possnert, Wacker and Synal2016) and He stripping (Schulze-König et al. Reference Schulze-König, Seiler, Suter, Wacker and Synal2011). Samples were typically measured until 800,000 14C counts were collected (about 1.5 hr per sample at C- currents of 70µA). The data reduction was subsequently performed with the BATS program using the OXAII for standard normalization and Phtalic Anhydrid for blank subtraction.
RESULTS AND DISCUSSION
Performance of the Experimental Setup
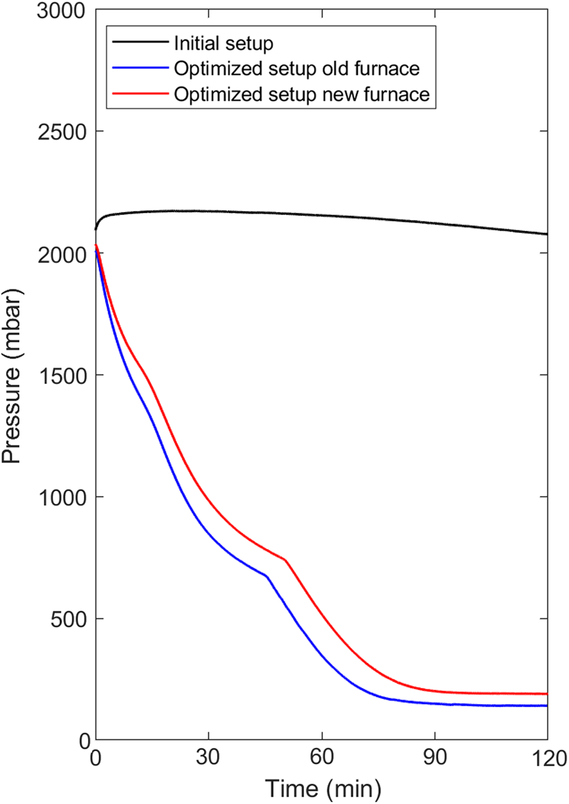
The results of the seawater samples analyzed in this study showed a range of values between 0.8861 ± 0.0021 and 1.0671 ± 0.0033 F14C (Table 2), which is in agreement with the expected values (i.e. between –200 and 100 Δ14C, which corresponds to 0.8–1.1 F14C) in seawater samples (Key et al. Reference Key, Quay, Schlosser, McNichol, von Reden, Schneider, Elder, Stuiver and Östlund2002; Povinec et al. Reference Povinec, Oregioni, Jull, Kieser and Zhao2000). A sample volume of 60 mL was enough to obtain sufficient amount of carbon mass (∼1.7 mg, of which only 1 mg was used for graphitization). The measurement precision was 2.9‰ F14C (1 sigma) using the initial setup and improved to 1.7‰ upon the introduction of the Cu-Ag furnace in the optimized setup. The precision was initially primarily given by the reproducibility of the sample preparation, which was significantly improved. While in the first batch of samples (Arctic Ocean 2015) we frequently noticed small leaks on the septa sealing the bottles, no leaks were later observed after a more careful sealing was applied. Further, the extended graphitization process due to poisoning of the iron resulted in a three-fold reaction time and less reproducible negative ion currents. Only the final setup with a size-optimized Cu-Ag furnace allowed us to reproduce our samples with uncertainties primarily limited by the measured 14C counts. This is probably due to the removal of sulfur and nitrogen oxides, as well as halogens contained in seawater. Here nitrogen oxides are reduced to N2 and excess of oxygen is removed on copper. Silver wool placed at both ends of the furnace traps halogens and sulfur compounds which also may poison the iron catalyst used for the graphitization reaction. As a result, the graphitization step was achieved in less than 2 hr (Figure 2—red and blue lines). This graphitization time was much shorter than the >5 hr required for the initial setup (Figure 2—black line). No differences in reaction time were observed between samples processed with the old and new version of the two Cu-Ag furnaces. Overall, the introduction of a fully automated sampler allowed for the extraction and graphitization of 7 seawater samples in less than 4 hr, therefore allowing for the preparation of 21 samples per day.
Results of the first and second subsample of seawater samples (each 60 mL).

Graphitization performance of three seawater samples with the initial experimental setup without Cu furnace (black) and with the optimized setup including either the old Cu-Ag furnace of the EA (blue) and with the new inline Cu-Ag furnace (red). (Please see electronic version for color figures.)

Blanks and Standards
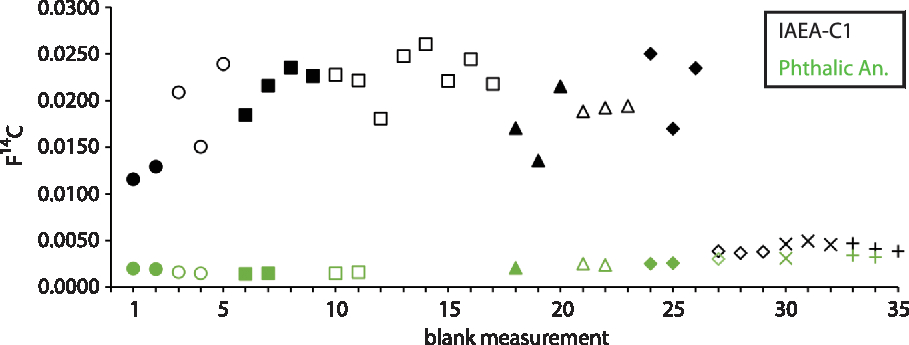
Combustion blanks ranged between 0.0014 ± 0.0001 and 0.0034 ± 0.0001 F14C (Figure 3—green symbols), primarily dependent on the performance of the AMS. Process blanks displayed initially a large range, from 0.0116 ± 0.0002 to 0.0260 ± 0.0003 F14C (Figure 3—black symbols) thus representing up to 2% of the seawater F14C content. As we suspected that variation in the magnitude of the process blank compared to the combustion blank was due to the carbon content in the milliQ water, we acidified, heated overnight and finally flushed the milliQ water with He, before adding the IAEA C1. As a result, the process blank improved by one order of magnitude down to an average value of 0.0042 ± 0.0001 F14C (Figure 3, black symbols, replicates 27-35). The improved process blanks were only slightly above the combustion blanks probably indicating still some residual CO2 in milliQ water (∼10% of the original 14C in the milliQ water). Consequently, only combustion blanks were used for background correction.
Results of the F14C for the combustion blanks (Pthalic Anhydride; green symbols) and the process blanks (IAEA-C1; black symbols). Different symbol shapes represent the 10 different magazines in which blanks were measured.

Results of the 17 replicates of the coral reference material (Figure 4) had a mean value of 0.9447 ± 0.0005 (1 sigma error), agreeing within 1 sigma with the nominal value (0.9447 ± 0.0002, G. Dos Santos, personal communication) and thus proving the high accuracy of the method.
Results of F14C for the coral reference material (n=17; avg. 0.9447±0.0005, 1 sigma error). The grey shaded area represents the 1 sigma error of the mean. Symbols represent the 8 different magazines in which they were measured. The updated nominal value for the coral reference material is 0.9447±0.0002. The previous value based on a smaller number of measurements (0.9440±0.0004, n=21) was reported in (Hinger et al. Reference Hinger, Santos, Druffel and Griffin2010).

Reproducibility of the Method in Seawater Samples
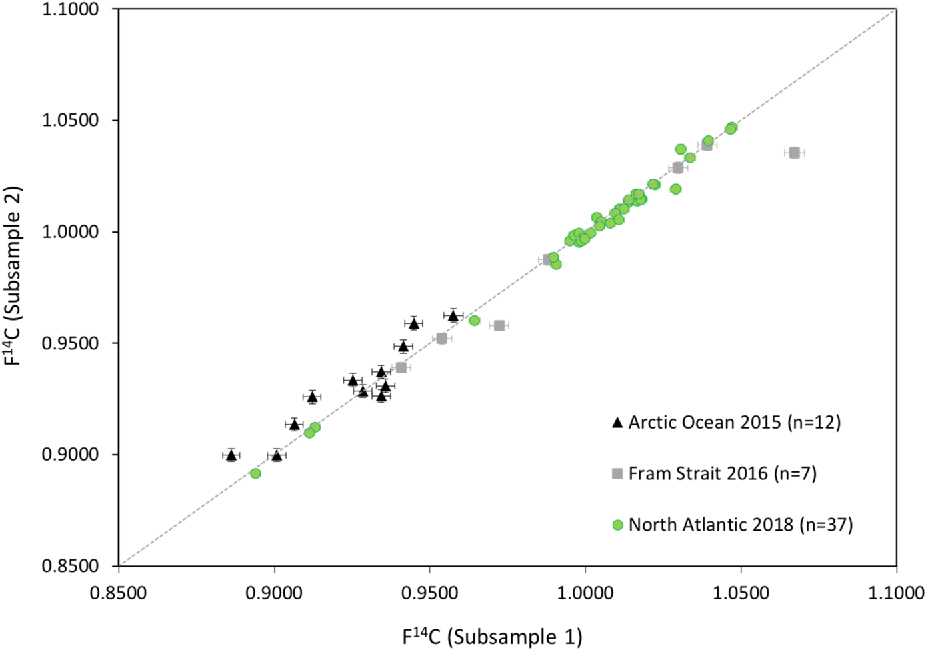
Results of the second replicate of the samples are also presented in Table 2 and the comparison between the initial samples (subsample 1) and the replicates (subsample 2) is presented in Figure 5. Due to the optimization of the method, the reproducibility improved significantly between the three subsets processed between July 2016 and November 2018. Samples taken in the Arctic Ocean show the least consensus among replicates: only 42% of the values statistically agree (p>0.05) within 1 sigma uncertainty, and 75% within 2 sigma uncertainty. The Fram Strait replicates showed a better agreement within 1 sigma uncertainty: 71% of the values are statistically the same (p>0.05). Only one sample remained statistically different even at 3 sigma uncertainty (ETH label 79902.1) probably related to a poor CO2 extraction in the first subsample: 0.639 mg, compared to >0.997 mg in the second subsample (ETH label 79902.1.2). The final optimization of the method (i.e. using the new Cu-Ag furnace), tested with the North Atlantic samples, was the one with the best agreement among replicates: 86% of the samples were statistically identical (p>0.05) at 1 sigma uncertainty, 97% within 2 sigma uncertainty (i.e. only one sample agrees with its replicate at 3 sigma).
Results of F14C of the different sets of replicates. Each replicate corresponds to half of the original sample (60 mL). Subsample 1 of seawater taken in the Arctic Ocean expedition in 2015 (black triangles) was processed using the initial setup (without Cu furnace). Subsample 2 of this set, and both the subsample 1 and the replicate of water collected in the Fram Strait (grey squares) were processed using the optimized setup with the old Cu-Ag furnace. Samples from the North Atlantic Ocean (green circles) were processed with the optimized setup and with the new Cu-Ag furnace.

As already mentioned, the improvement in precision from the first set of samples (Arctic Ocean) to the third one (North Atlantic Ocean) is mostly due to the introduction of the compact Cu-Ag furnace. Beyond the technical optimization of the method, shortening times between both sampling and processing the first and second subsample might have also played a role. Yet, the main limitation of long storage time seems to be related to a poor sealing of the septa bottles: higher F14C values in subsample 2 (Arctic Ocean) could be due to incorporation of 14C by air exchange. While we observed this potential leaking in this initial batch of samples, no leaking was observed in the last batch due to our improved sample handling. Moreover, the replicates of the last set of samples (North Atlantic Ocean) were measured in the same magazine, thus ensuring same measuring conditions. We therefore conclude that the combination of the optimized method using a smaller Cu-Ag furnace, together with a proper sealing of the septa bottle during their storage, ensures the reproducibility of F14C results in seawater samples.
CONCLUSIONS
A new method to extract inorganic CO2 in seawater samples for the determination of F14C has been developed in the Laboratory of Ion Beam Physics, at ETH Zurich. Based on the method described for the groundwater samples (Molnár et al. Reference Molnár, Hajdas, Janovics, Rinyu, Synal, Veres and Wacker2013), this new setup consists in the addition of a Cu-Ag furnace and a fully automated sampler designed to extract DIC from 7 seawater samples in a row, computer controlled via a LabVIEW program. We proved that the CO2 headspace extraction coupled with the graphitization line using He as a CO2 carrier gas and zeolite traps to concentrate CO2, presents several improvements compared to previously used techniques:
Sample volumes are four times lower than the usual sample size (i.e. 60 mL instead of typically 250 mL).
Extraction and graphitization times are less than 4 hr for 7 samples, all coupled in a single line, which avoids having to transfer samples from the water line to the graphitization line, hence minimizing the potential contamination.
High reproducibility within replicates when samples are sealed properly during their storage, avoiding any incorporation of 14C by air exchange.
Improved precision: ∼1.7‰ instead of 3‰ (McNichol et al. Reference McNichol, Jones, Hutton, Gagnon and Key1994).
The high throughput of samples (21 samples per day) allows for coverage of future oceanographic transects with high spatial resolution, therefore fostering the use of 14C as water mass tracer.
ACKNOWLEDGMENTS
The authors acknowledge the chief scientists, colleagues, captain and crew members involved in the sampling activities during the three expeditions: Arctic Ocean, Fram Strait and North Atlantic Ocean onboard R/V Polarstern and R/V Thalassa. N. Casacuberta’s research was supported by the Swiss National Science Foundation (AMBIZIONE PZ00P2_154805) and the ETH Laboratory of Ion Beam Physics. A.-M. Wefing received funding from the ETH Doctoral grant ETH-06 16-1. M. Castrillejo’s research was supported by the ETH Zurich Postdoctoral Fellowship (17-2-FEL-30), co-funded by the Marie Curie Actions for People COFUND Program.