1. Introduction
A modest extrapolation of plasma parameters achieved in the gas dynamic trap (GDT) magnetic mirror experiment (see, e.g. Simonen et al. Reference Simonen, Anikeev, Bagryansky, Beklemishev, Ivanov, Lizunov, Maximov, Prikhodko and Tsidulko2010; Bagryansky et al. Reference Bagryansky, Anikeev, Denisov, Gospodchikov, Ivanov, Lizunov, Kovalenko, Malygin, Maximov and Korobeinikova2015; Ivanov & Prikhodko Reference Ivanov and Prikhodko2017) provides the possibility of building a GDT-based high-fluence fusion irradiation test facility for materials studies (Anikeev et al. Reference Anikeev, Bagryansky, Beklemishev, Ivanov, Kolesnikov, Korzhavina, Korobeinikova, Lizunov, Maximov and Murakhtin2015). The pure gasdynamic confinement has quite large particle and power losses along the magnetic field. A further advance into the fusion energy parameter space requires some special measures for a drastic reduction of the axial losses. Recent visions of a new generation mirror confinement system reckon for a special multiple-mirror magnetic sections for this purpose (Beklemishev et al. Reference Beklemishev, Anikeev, Astrelin, Bagryansky, Burdakov, Davydenko, Gavrilenko, Ivanov, Ivanov and Ivantsivsky2013; Bagryansky, Beklemishev & Postupaev Reference Bagryansky, Beklemishev and Postupaev2019). The efficiency of the multiple-mirror confinement was demonstrated in GOL-3 experiments with sub-fusion plasma (Burdakov Reference Burdakov, Azhannikov, Astrelin, Beklemishev, Burmasov, Derevyankin, Ivanenko, Ivanov, Ivantsivsky and Kandaurov2007; Burdakov & Postupaev Reference Burdakov and Postupaev2018). A combination of a central gasdynamic confinement core with two side multiple-mirror sections will be studied in GOL-NB experiments (see Postupaev et al. Reference Postupaev, Batkin, Beklemishev, Burdakov, Burmasov, Chernoshtanov, Gorbovsky, Ivanov, Kuklin and Mekler2016a, Reference Postupaev, Batkin, Burdakov, Burmasov, Ivanov, Kuklin, Mekler, Rovenskikh and Sidorov2020).
The new idea of the helical mirror confinement was suggested in Beklemishev (Reference Beklemishev2013) as an attempt to significantly improve the efficiency of classical multiple-mirrors at fusion-related parameters. That proposal renewed the idea of a plasma flow control with moving magnetic mirrors (Budker, Mirnov & Ryutov Reference Budker, Mirnov and Ryutov1982). The original idea of moving magnetic mirrors with moderate or high mirror ratio in a fusion-grade system is not feasible for evident technical issues, though recent analysis by Be'ery, Gertsman & Seeman (Reference Be'ery, Gertsman and Seeman2018) discussed the application of this idea to a laboratory plasma. Therefore, an emulation of the moving magnetic mirrors by the stationary magnetic field is still of sufficient interest.
The magnetic system of a helical mirror resembles a straightened stellarator with the same two major components of the magnetic field. The key distinguishing feature of the linear helical confinement system is the possibility of the control of a radial electric field with a set of limiters and sectioned endplates. The applied radial electric field causes plasma rotation similar to vortex confinement (Beklemishev et al. Reference Beklemishev, Bagryansky, Chaschin and Soldatkina2010). Periodical variations of a helicoidal magnetic field moving upstream in the plasma's frame of reference at the axial velocity  $v_{z}$, which is proportional to the helical field period and plasma rotation angular velocity, transfer momentum to the trapped particles and lead to the plasma pumping towards the central trap, or its acceleration. Plasma acceleration in the helical mirror for the case of the downstream direction of the magnetic corrugation movement was described by Beklemishev (Reference Beklemishev2015) and Timofeev (Reference Timofeev2020). In the case of upstream direction, the variations of the magnetic field transfer momentum to trapped particles (Burdakov Reference Burdakov, Azhannikov, Astrelin, Beklemishev, Burmasov, Derevyankin, Ivanenko, Ivanov, Ivantsivsky and Kandaurov2007), and lead to plasma pumping towards the central trap. The helical mirror traps should have two improvements over the classical multiple-mirrors: the exponential (instead of the quadratic) law of the confinement improvement with the system length; and the radial pinch of ions that can counteract the diffusive broadening of the plasma (Beklemishev Reference Beklemishev2016b). The ‘SMOLA’ device is the first concept exploration experimental facility (figure 1) with a helical mirror system that was put into operation in the Budker Institute of Nuclear Physics at the end of 2017 (see Postupaev et al. Reference Postupaev, Sudnikov, Beklemishev and Ivanov2016b; Sudnikov et al. Reference Sudnikov, Beklemishev, Postupaev, Burdakov, Ivanov, Vasilyeva, Kuklin and Sidorov2017). Plasma flux suppression by the helical mirror sections was demonstrated in the first experimental campaign (Sudnikov et al. Reference Sudnikov, Beklemishev, Postupaev, Ivanov, Inzhevatkina, Sklyarov, Burdakov, Kuklin, Rovenskikh and Melnikov2019).
Photograph of the SMOLA helical mirror device in the configuration relevant to the discussed experiments.

In this paper, we report the preliminary experimental scalings of the flow suppression by the helical mirror. The experimental set-up is described in § 2. Then, estimates of the flux suppression based on the analytical model of the radial and axial transport (Beklemishev Reference Beklemishev2016b) will be presented in § 3. In § 4, we present the experimental findings and compare them with the simplified model.
2. Experimental set-up and parameters
The SMOLA helical mirror device consists of three main parts (figures 1 and 2). The entrance tank contains a compact mirror trap, a plasma source with its own magnetic coils and an input limiter. The next part is the transport section that has two independent magnetic systems, a solenoid for a straight field and a bispiral helical winding that forms helical magnetic mirrors. The third part of the device is the exit tank that contains an exit limiter and a radially segmented plasma receiver endplates. Details of the device can be found in Sudnikov et al. (Reference Sudnikov, Beklemishev, Postupaev, Burdakov, Ivanov, Vasilyeva, Kuklin and Sidorov2017).
Layout of the SMOLA device. The plasma source, the vacuum and magnetic systems, limiters and diagnostics are shown. ‘UV’ mark stands for the photodiode ultraviolet sensor. Calculated field tube starts from the edge of the cathode, its colour corresponds to the local field strength.

Hydrogen plasma was generated by the plasma gun, based on the design of Davydenko, Ivanov & Shul'zhenko (Reference Davydenko, Ivanov and Shul'zhenko2015). Plasma is injected from the gun to the entrance tank and then transported through the transport section with the helical magnetic field to the exit expander. The density on axis in the entrance expander in the discussed experiments at  $z = 0.4$ m was
 $n\sim 2\text {--}5 \times 10^{18}$ m
 $^{-3}$ (project range
 $10^{18}\text {--}3\times 10^{19}$ m
 $^{-3}$) and temperatures
 $T_i\sim 2\text {--}3$ eV,
 $T_e \sim 5\text {--}7$ eV. These values correspond to the ion scattering mean free path
 $\lambda =8\text {--}40$ cm in the entrance expander, which is close to the period of the helical winding
 $l = 18$ cm. In experiments at lower bound of the density range the mean free path in the distant half of the transport section becomes an order of magnitude longer than the period of the magnetic field modulations, breaking the applicability of the multiple mirror conditions. The mean free path of the ion-neutral interaction at working neutral pressure
 $p_0\sim 3$ mPa is of the order of the few metres, making neutrals negligible.
Transverse diffusion caused by any kind of the ion scattering results in the broadening of the plasma column in the magnetic flux coordinates. The plasma width observed experimentally in the exit expander is larger by  $\sim$10
 $\%$ compared with the entrance expander.
Solenoidal and helical windings of the transport section are independent of each other. A straight solenoid creates a uniform axial magnetic field. Helical winding adds periodical variation. In this paper, the magnitude of this variation is described by the mean corrugation ratio  $R_\textrm {mean}$, which corresponds to the ratio of the maximal and minimal magnetic field along the field line within the transport section averaged over the plasma cross-section. Magnetic configuration corresponds to the weak magnetic trap in the entrance tank. The mirror ratio to the transport section is
 $R = 3$ and to the plasma gun is
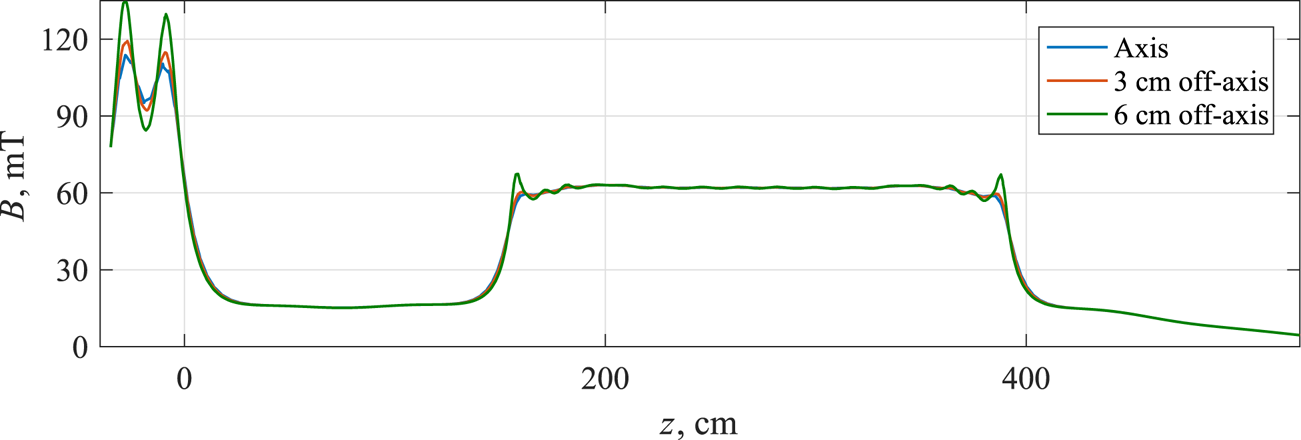
 $R = 6$ (figure 3). Potentials of the plasma are determined by the plasma gun electrodes, a set of limiters on both sides of the transport section and radially segmented endplate in the exit expander.
Guiding magnetic field profiles for different radii.

In these experiments, the scalings of the suppression efficiency on the magnetic configuration at low values of the magnetic field ( $B_z = 25\text {--}70$ mT, project limit 300 mT) and corrugation depth (
 $R_\textrm {mean} = 1\text {--}1.4$, project limit
 $R_\textrm {mean} \sim 2\text {--}2.5$) were studied. Plasma parameters were reproducible during all series of the experiments, providing the same flow. Typical waveforms of the main experimental parameters in the experiment are shown in figure 4. Special long-pulse discharge with switching straight and helical magnetic configurations (figure 4a) is shown. This discharge demonstrates the altering of the plasma outflow with the activation of the helical field. In the main series of the experiments, shorter discharge with a constant helical component of the magnetic fields was used to measure plasma parameters. The stable plasma discharge builds up during the first 40–70 ms (the duration of this stage depends on the magnetic configuration and the discharge current amplitude). Plasma density stays constant after that stage, except the effect of the reionization of the neutral gas accumulated in the exit expander of the device which becomes significant after
 $\sim$400 ms of the discharge (figure 4e,f). Average values on the flattop of the discharge were used to plot the radial profiles of the plasma parameters. These values are averaged over the period between 150 and 250 ms after the discharge initiation. Lower border of this period is at least twice as long as the build-up stage making it possible to neglect any transition effects; the upper border is chosen to avoid the effects of the neutral gas accumulation.
Typical waveforms in a shot with the repetitive switching between straight solenoidal ( $R_\textrm {mean}=1$) and helical mirror (
 $R_\textrm {mean}=1.3$) magnetic configurations. From top to bottom: (a) amplitude of the helical component of the magnetic field; (b) the voltage between the cathode and the anode of the plasma gun; (c) the discharge current (measured on the cathode of the plasma gun); (d) the rotation velocity for the solenoidal (circles) and the helical field mirror (crosses) configurations, measured in the large series of shots; (e,f) the ion saturation current on the axis at
 $z = 0.4$ m and at
 $z = 4.34$ m.

Biasing of the anode, cathode and coaxial rings of the endplate was applied to drive the rotation of the plasma. These potentials stay almost unchanged during the flattop phase of the experiment due to the high electrical capacitance of the plasma power supply system (figure 4b). Potential on the axis is negative (this condition essentially differs between the physics of the neoclassical transport in helical mirror systems compared to stellarators). Unlike the previous experiments (Inzhevatkina et al. Reference Inzhevatkina, Burdakov, Ivanov, Postupaev and Sudnikov2019), the rotation velocity was lower and did not depend strongly on the experimental parameters. The rotation velocity also does not change with time. The velocity of the plasma boundary was routinely measured by the Doppler shift spectrometer in every discharge and did not exceed  $v_{\phi } \sim (1\text{--}2)\times 10^4$ m s
 $^{-1}$, which is comparable to the ion thermal velocity, ion sound velocity or to the rotation velocity in the ambipolar potential for the given electron temperature. The rotation in the discussed experiments was rigid, Doppler shift depended linearly on the radius within the accuracy of the spectrometer. Two stable regimes of the angular velocity were observed at different conditions of the plasma gun electrodes, with
 $\omega \sim 5.8\times 10^5$ s
 $^{-1}$ (shown in figure 4d) and
 $\omega \sim 2.8\times 10^5$ s
 $^{-1}$ in the helical configuration, respectively. Lower angular velocity corresponds to the contaminated cathode surface, which presumably altered the potential of the plasma. The definite reason of the slower rotation and ways to increase angular velocity require further investigations and are outside of the scope of this paper. Independence of the angular velocity on the magnetic field and electrode biases restricts its arbitrary change, therefore the theoretical dependence of the helical mirror effect on the axial velocity of the variations of the magnetic field
 $v_z$ cannot be measured in detail. At the same time, changing the magnetic field amplitude without changing the angular velocity and the axial velocity of the variations of the magnetic field
 $v_z$ enables measurement of the effect of the magnetic field amplitude at constant
 $v_z$.
3. Model estimations
The number of particles passing through the transport section can be estimated from the existing theory for further comparison with the experimental data. Radial and axial transport of rotating ions in a helical mirror was discussed in Beklemishev (Reference Beklemishev2016b) assuming the ion scattering mean free path being close to the period of the magnetic field variations. The continuity equation was reduced to the following form:
 \begin{equation} \frac{\partial}{\partial z}r\left(\frac{1}{\kappa\varLambda} \frac{\partial p}{\partial z}+(1+\kappa)n \zeta \frac{\partial \phi}{\partial r}\right)+ \frac{\partial}{\partial r}r\left(\zeta \frac{\partial p}{\partial z}+D \frac{\partial n}{\partial r}\right)=0,\end{equation}
where  $\kappa$ is the fraction of the trapped particles;
 $\varLambda$ is the ratio of the system length
 $L$ to the ion scattering mean free path
 $\lambda$;
 $p$ and
 $n$ are pressure and density normalized by their maximal values,
 $\zeta = c T_e/(e B_z \alpha a c_s)$;
 $B_z$ is guide magnetic field;
 $\alpha$ is the average inclination of the magnetic field lines to the magnetic axis on the given flux surface;
 $a$ is the plasma radius,
 $c_s=\sqrt {T_e/m_i}$; and
 $D$ describes the cross-field diffusion. Parameters
 $\zeta (r), \alpha (r)$ and
 $\kappa (r)$ depend only on the magnetic configuration (for
 $\kappa (r)$ we assume the mean free path of an ion and the period of the magnetic field variations are close, which is reasonable for the plasma parameters described above), and therefore their dependencies on radius can be calculated for every experiment. The diffusive term may be neglected for high magnetic field and temperature (Sudnikov et al. Reference Sudnikov, Beklemishev, Postupaev, Burdakov, Ivanov, Vasilyeva, Kuklin and Sidorov2017). Transverse diffusion plays an important role for the parameters of the SMOLA device, but the calculations without the diffusive term can be used as a rough estimate. In this case, the solution of the (3.1) gives exponential decrease of the plasma density with the axial coordinate independently on any field line. The characteristic length was calculated in Beklemishev (Reference Beklemishev2017) and is equal to
 \begin{equation} z_0=\frac{1}{\varLambda\kappa\zeta}\left(\frac{1+\kappa}{1+T_i/T_e}\frac{\partial \widetilde{E_r}}{\partial r}+\frac{\partial}{\partial r}\ln{n_{z=0}r\zeta}\right)^{-1}, \end{equation}
where  $\widetilde {E_r}$ is the radial electric field
 $E_r$ normalized by the electron temperature
 $T_e/e$ and plasma radius
 $r_0$. The ratio
 $T_i/T_e$ can be roughly estimated as 1/2 for the particular experiment. For the given magnetic system the fraction of the trapped particles is estimated as
 $\kappa (r)\sim \cos {\theta _{lc}=\sqrt {1-{B_{\min }(r)}/{B_{\max }(r)}}}$ where
 $\theta _{lc}$ is the loss cone angle. The radial density profile at the entrance of the transport section in the SMOLA device is Gaussian (from probe measurements). Therefore, the following form can be used:
 \begin{equation} n(r,z)=n_0\exp{\left(-\frac{z}{z_0(r)}-\left(\frac{r}{r_0}\right)^2\right)}.\end{equation}
Experimentally measured angular velocity was independent of radius (Inzhevatkina et al. Reference Inzhevatkina, Burdakov, Ivanov, Postupaev and Sudnikov2019). In this case the derivative of the electric field  $\partial E / \partial r$ is constant and proportional to the angular velocity of the plasma rotation,
 \begin{equation} \omega=\frac{1}{Bc}\frac{E}{r}=\frac{1}{Bc}\frac{\partial E}{\partial r}. \end{equation}
For these dependences the characteristic length depends on the experimental parameters as follows:
 \begin{equation} z_0(r)=\frac{1}{\varLambda\kappa(r)\zeta}\left(\frac{2\omega eBcr_0(1+\kappa(r))}{3T_e}-2\left(\frac{r}{r_0}\right)^2\right)^{-1}.\end{equation}
One can integrate plasma flux  $nv$ at the end of the transport section over the plasma cross-section. The suppression ratio may be determined as the ratio of the integral flux through the transport section with the straight field over the corresponding integral flux through the section with the helical field, as follows:
 \begin{equation} R_\textrm{eff}(L)=\frac{\displaystyle \int\exp{\left(-\frac{L}{z_0(r)}-\frac{r^2}{r_0^2}\right)}\cdot 2\pi r \, \textrm{d} r}{\displaystyle \int\exp{\left(-\frac{r^2}{r_0^2}\right)}\cdot 2\pi r \, \textrm{d} r}. \end{equation}
The value of the suppression ratio  $R_\textrm {eff}$ can be measured experimentally for the given length of the helical mirror
 $L$ and then directly compared with the prediction of the characteristic length in (3.5).
This suppression ratio, as well as the characteristic length of the suppression determined in (3.5), takes into account only the effects of the radial plasma pinching due to the negative potential on the axis and the different fraction of the trapped particles on different radii. The effect of the diffusion was estimated numerically in the following way. The transport section was split into 768 slices (64 slices in one period of the magnetic field variations). The radial density profile in any sequent slice was modified by the helical mirror,
 \begin{equation} n_{i+1/2}(r)=n_{i}(r)\exp{\left(-\frac{\textrm{d} z}{z_{0}(r)}\right)},\end{equation}
where  $\textrm {d} z$ is the slice width and
 $z_{0}(r)$ is taken from (3.5). Then the diffusive flux was calculated using the simple equation of axially symmetric diffusion,
 \begin{equation} n_{i+1}(r)=n_{i+1/2}(r)+D\cdot\frac{1}{r}\frac{\textrm{d}}{\textrm{d} r} \left( r \frac{\textrm{d} n_{i+1/2}(r)}{\textrm{d} r} \right).\end{equation}
The value of the diffusion coefficient  $D$ was chosen to provide broadening by 10
 $\%$ in the straight configuration of the transport section. A simple diffusion model and arbitrary selection of the diffusion coefficient does not allow a quantitative comparison of the calculated density profiles and the experimentally measured ones. At the same time, one can qualitatively estimate the effect of the diffusion on the integral flux in (3.6).
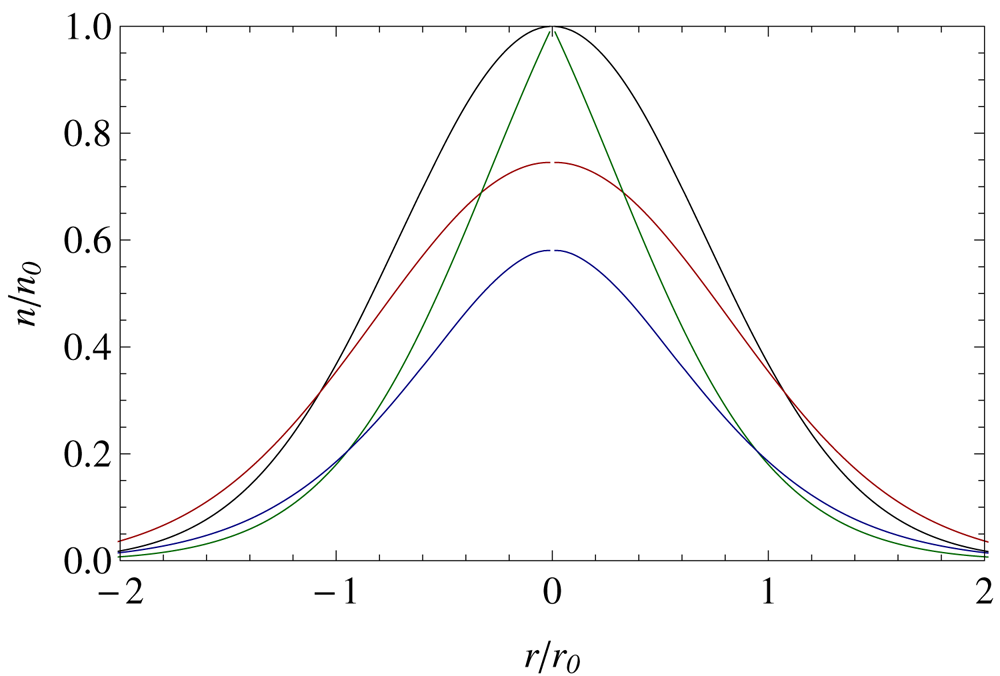
Figure 5 shows sample radial profiles with the effect of the diffusion. The black curve is the initial density profile, which is not modified either by the diffusion, nor by the effects of the helical mirror. The red line corresponds to the diffusion in the straight magnetic field ( $z_0(r)\longrightarrow \infty$). In these cases the number of particles stay unchanged, and
 $R_\textrm {eff}(L) = 1$.
Calculated density profiles after the transport section. Characteristic length of suppression corresponds to the magnetic field  $B = 57$ mT, rotation velocity
 $\omega \sim 5.8\times 10^5$ s
 $^{-1}$, mean corrugations
 $R_\textrm {mean}=1.25$. Straight field, without diffusion (black); straight field, with diffusion (red); helical field, without diffusion (green); helical field, with diffusion (blue).

The density on the axis stays unchanged by the helical magnetic field if we neglect the diffusion (figure 5, green curve). The radial density profile becomes significantly non-Gaussian, and the region of the steep gradient is formed near the axis. The difference in the integral flux is determined mostly by the plasma periphery.
The moderate radial diffusion transports the particles from the axis to the periphery, where they can be pumped by the helical field. In general, it should increase the efficiency of the helical mirror. The blue curve in figure 5 shows the significant difference in the plasma density on the axis. At the same time, the density on the periphery is increased, therefore the difference in the integral flux  $R_\textrm {eff}$ is not as significant. The calculated difference in
 $R_\textrm {eff}$ for the cases with and without the diffusion and the parameters related to the experiment is
 $\sim$2–5
 $\%$. The transport section of the SMOLA device is not long enough to pump out the particles which came from the axis. The radial density profile in the helical field with consideration of the diffusion becomes close to Gaussian. Its height decreases compared to the density profile in the straight field. The width also decreases in the most cases; although, at low angular velocity and high diffusivity it can stay almost unchanged.
Minor effects of the radial diffusion on the integral plasma flux make it possible to use (3.6) for the comparison with the experimental data.
4. Experimental results and discussion
The main task for the reported experimental campaign was the measurement of the radial density profiles at different coordinates along the device. During the experiments, different ratios of the helical to solenoidal field components were used. Some experiments were done with this ratio being fixed during the whole discharge duration, and in some experiments a sequence of helical field activations during a discharge (like that shown in figure 4) were used. As before (see Inzhevatkina et al. Reference Inzhevatkina, Burdakov, Ivanov, Postupaev and Sudnikov2019), we used Doppler spectroscopy for measurements of the plasma rotation rate; such data will be used when required without additional explanation.
Discharges with periodical activation of the magnetic field were used for qualitative observations of the helical mirror effect. The radial density profiles were calculated using the diagnostic data averaged over the period between 150 and 250 ms after the discharge initiation at arbitrary selected magnetic field  $B$, mean corrugations
 $R_\textrm {mean}$ and angular velocity
 $\omega$. Activation of the helical mirror changed the density profiles, while the discharge parameters stayed unperturbed. This can be explicitly seen in discharges with periodical activation of the helical field such as that shown in figure 4.
We observed moderate growth of the plasma density in the entrance region. We should note that this region is an open trap, where one mirror is the helical transport section, and another one is the simple short mirror plug with low mirror ratio. The losses from this trapping region are determined mostly by the simple plug. At the described magnetic configuration, plasma density in this trapping region grew by  $\sim$10
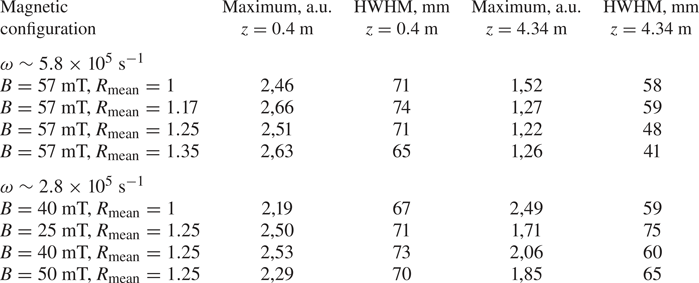
 $\%$ when the transport section was in the helical configuration (figures 6a and 7a, column 2 in table 1). The significance of this effect is limited mainly by the mirror ratio between the trap region and the plasma gun. In the discharges with periodical activation of the helical mirror, the rise of the confined plasma density is directly connected to the switching of the helical field on.
Particle flux density profiles before (a) and after (b–d) the transport section at different mean corrugations  $R_\textrm {mean}$. Magnetic field
 $B = 57$ mT, rotation velocity
 $\omega \sim 5.8\times 10^5$ s
 $^{-1}$. Circles, straight field; crosses, helical field. Dotted line shows fitted Gaussian profile (see table 1 for fitting coefficients). Solid line shows calculated profile for given experimental parameters without diffusion.

Particle flux density profiles before (a) and after (b–d) the transport section at different magnetic field values for fixed rotation velocity  $\omega \sim 2.8\times 10^5$ s
 $^{-1}$ and corrugation ratio
 $R=1.25$. Magnetic configuration was not changed during the discharge. Circles, straight field only; crosses, with helical field added. Dotted lines show fitted Gaussian profiles (see table 1 for fitting coefficients). Solid lines show calculated profiles for given experimental parameters without diffusion.

The main fitting parameters of the particle flux density profiles. Here HWHM is the half width at half maximum of the fited curve.

The plasma density at the exit from the transport section was sufficiently suppressed by switching on the helical field. The experimental density profiles, as well as the profiles calculated from (3.3), are shown in figures 6(b–d) and 7(b–d). The calculated radial density profiles use the experimental profiles at  $z = 0.4$ m as the initial values. The profiles are normalized by the maximum values of the density fitting curves at
 $z = 4.34$ m. At high angular velocity of the plasma rotation, plasma density at the exit significantly decreases. The most pronounced effect was observed in the configuration with strong magnetic field and high mean corrugation ratio
 $R_\textrm {mean}$ on the plasma periphery, where the mirror ratio is the highest (figure 6d). At lower angular velocity the width of the profiles is less affected; at the same time, their height is decreased. The width rises at lower magnetic field, which corresponds to the higher diffusion. All experimental profiles are close to Gaussian in comparison with the calculated ones.
This behaviour (decreasing width at fast rotation, decreasing height at slow rotation and smoothing of the profile) is consistent with the estimations of the profile modification by the diffusion based on (3.7) and (3.8). In all experiments the height and the width of the profile were modified by the helical transport section. Therefore, the numerator in (3.6) and the number of the particles transported through the mirror, were reduced. The effect of the helical mirror strictly depended on the mean corrugation ratio  $R_\textrm {mean}$, guiding magnetic field and rotation velocity.
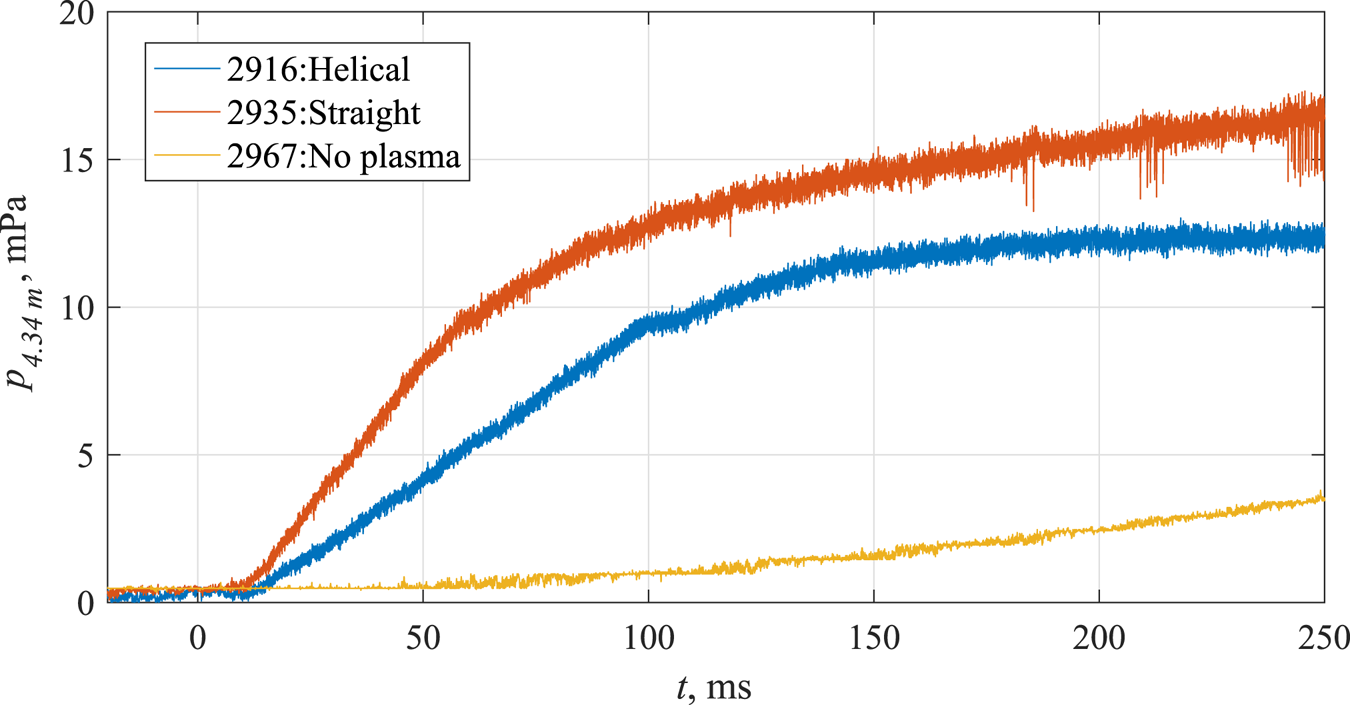
The difference in particle flux transported through the helical section can be also estimated by the neutral gas balance inside the exit expander. The gas pressure was measured by the ionization gauge. Initially the neutral particle flux is determined by the pressure growth rate. At pressures  $\sim$10 mPa, the vacuum pump starts to play a role in the material balance; the particle flux can be calculated from the saturated pressure and the pumping speed. The neutral gas flux through the transport section was approximately an order of magnitude lower in tests with activation of the gas system, only without the discharge triggering during the first 200 ms of the time sequence (see figure 8). The relative difference in the additional gas densities in experiments with plasma corresponds to the change in plasma fluxes at different magnetic configurations.
Gas accumulation in the exit expander for the magnetic field in solenoidal and helical mirror configurations and in the case without the discharge triggering. Rotation velocity  $\omega \sim 5.8\times 10^5$ s
 $^{-1}$, mean corrugation
 $R\sim 1.35$.

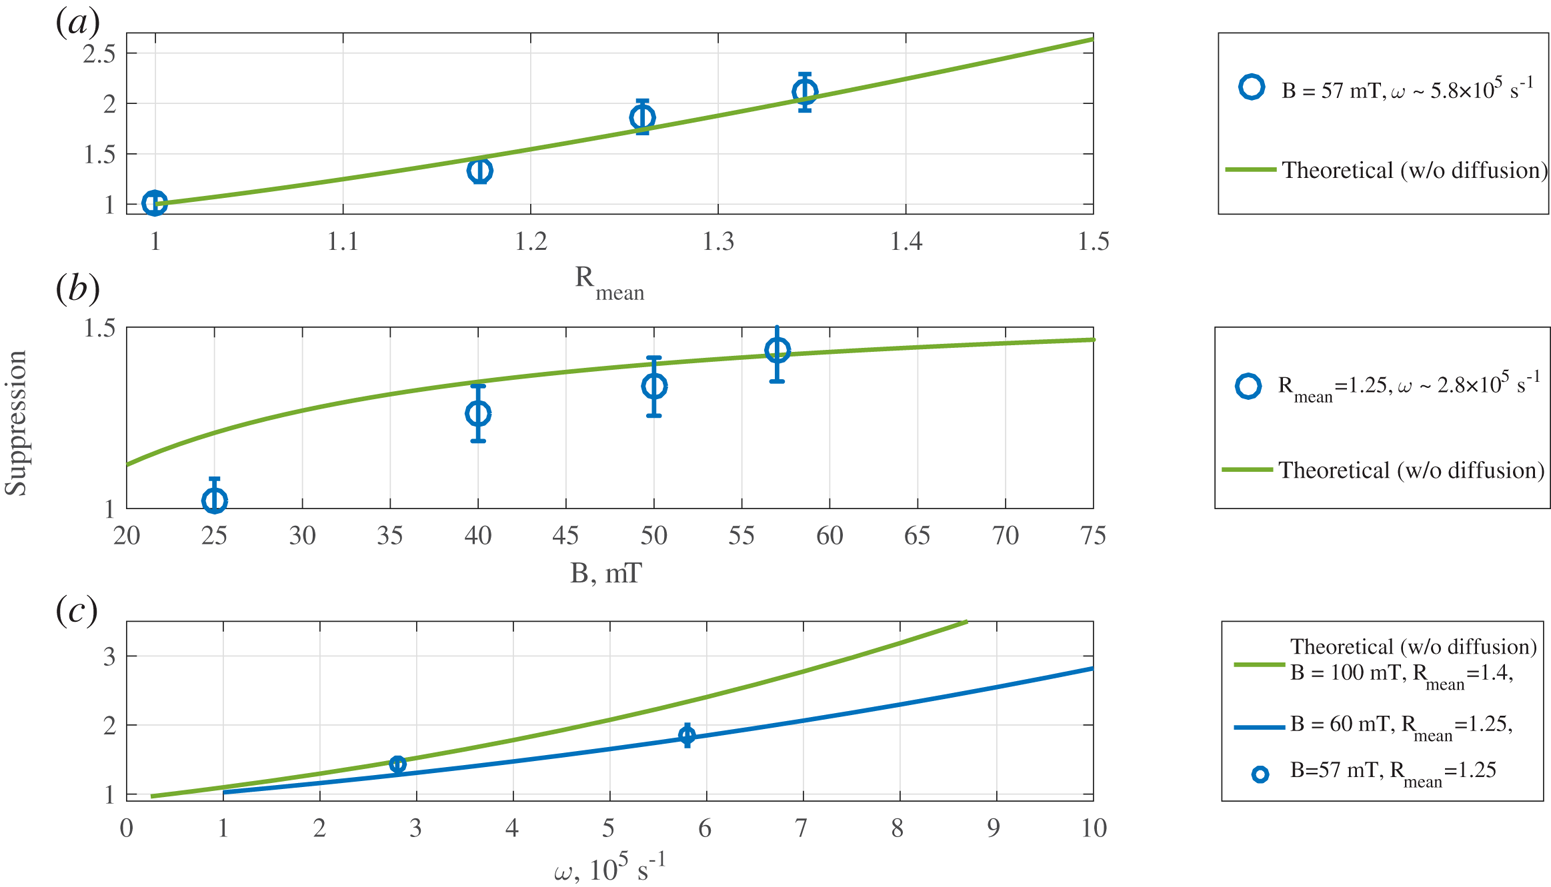
Presumably, in the regime of the slow rotation velocity, the predicted radial pinching is insufficient to counteract diffusion. At lower magnetic fields radial diffusion prevails, thereby causing stronger plasma column broadening. Increase of the magnetic field leads to the significant improvement of the suppression ratio. At higher rotation velocity and high magnetic field (see figure 6), pinching become significant, and plasma radially contracts. Dependence of the suppression ratio on the corrugation ratio averaged over the plasma cross-section, guide magnetic field and rotation velocity was calculated using the experimental data (figure 9).
Suppression ratio dependences on the corrugation ratio (a), guiding magnetic field (b) and rotation velocity (c). Solid lines show the theoretical estimates without diffusion. Green line on panel (c) shows the magnetic configuration proposed for the next experimental series.

Theoretical estimates fit well with the experimental results, except at the region of the lowest magnetic field with high transverse diffusivity. At the same time, this region in the parameter space is not interesting for magnetic mirror systems. This estimate is based on the experimentally measured mean corrugation ratio and rotation velocity, which are known with limited accuracy (20–25  $\%$ for the rotation velocity). Dependence of the estimations on these parameters is quite strong, making it possible for moderate deviation of the experimental points and the calculations
5. Conclusions
The paper presents the basic experimental and theoretical dependencies of the helical mirror efficiency on the experimental parameters in the range of the low magnetic field and low mean corrugation ratio. The results were obtained in the Budker Institute of Nuclear Physics on the SMOLA helical mirror device.
Plasma flux at the exit from the transport section is suppressed in the helical mirror configuration compared with the solenoidal one. With low diffusion the most pronounced effect is observed on the plasma periphery, where the mirror ratio is the highest. If the radial diffusion is high, the helical mirror provides almost equal effect on the different radii. Integral suppression ratio reaches 2–2.5 in the discussed experiments. These values match the simple theoretical estimates. The effect of the transversal diffusion on the integral flux is negligible.
The presented measurements and theoretical estimates show an increase of the suppression ratio with the increase of the magnetic field, corrugation ratio and plasma rotation velocity. Further experiments on the SMOLA device will be directed to the raising of these parameters. Direct comparison of the regimes with the up- and downstream directions of the plasma flow pumping is also planned.
Helical mirrors could expand the existing set of the axial losses suppression methods for linear traps. Even at a moderate efficiency with an enhancement factor of 5–10, they will significantly improve fusion prospects of open traps making them more economically and technically attractive. These values seem feasible at a moderate mirror ratio  $R\sim 2$ and rotation velocity
 $\omega \sim 10^6$ s
 $^{-1}$. The most promising effect for the implementation of the helical sections into the future GDMT and other projects is the enhanced flow suppression on the plasma periphery. Obviously, the helical sections provide better efficiency if the plasma in the high field zones of the linear machine is hollow; e.g. it can effectively counteract higher plasma losses from the transition layer of the diamagnetic trap (for the latter, see Beklemishev (Reference Beklemishev2016a)).
Acknowledgements
This work was supported by the Russian Science Foundation (project no. 18-72-10080). The results related to this project are discussed in chapters 3, 4, 5. The upgrade of power supply systems for the increase of the discharge duration up to one second was supported by the Ministry of Science and Higher Education of the Russian Federation.
Editor Hartmut Zohm thanks the referees for their advice in evaluating this article.
Declaration of interests
The authors report no conflict of interest.