Implications
Consumers are increasingly interested in the origin of the meat they consume. The feedstuffs consumed by animals make a major contribution to the composition of meat. This study utilises potential compositional differences between different animal production systems as an authentication tool. Nuclear magnetic resonance is applied to the bovine muscle and, as a novel approach, to the bovine urine and a panel of easily quantifiable and novel markers for beef authentication has been established. It is a first step towards a metabolomic-based approach to strengthen the current methods for authentication of beef production systems.
Introduction
Consumers are increasingly concerned about the origin and authenticity of the food, including the meat, they consume (Heaton et al., Reference Heaton, Kelly, Hoogewerff and Woolfe2008) and there is now a need for reliable information about animal production systems, particularly animal diets. There is particular interest in the animal products derived from pasture-fed animals because they are considered nutritionally superior as a result of elevated levels of n-3 fatty acids and conjugated linoleic acid arising from the feeding regime (Enser et al., Reference Enser, Hallett, Hewett, Fursey, Wood and Harrington1998; Nuernberg et al., Reference Nuernberg, Dannenberger, Nuernberg, Ender, Voigt, Scollan, Wood, Nute and Richardson2005; Alfaia et al., Reference Alfaia, Alves, Martins, Costa, Fontes, Lemos, Bessa and Prates2009), as well as being more animal welfare-friendly (Prache et al., Reference Prache, Cornu, Berdagué and Priolo2005). Efforts have recently been made to develop analytical tools to quantify specific compounds in animal tissues that can act as markers of animal diet, including carotenoids (Simonne et al., Reference Simonne, Green and Bransby1996; Serrano et al., Reference Serrano, Prache, Chauveau-Duriot, Agabriel and Micol2006), terpenes and phenolic compounds (Young et al., Reference Young, Berdague, Viallon, Rousset-Akrim and Theriez1997) and tocopherols (Röhrle et al., Reference Röhrle, Moloney, Black, Osorio, Sweeney, Schmidt and Monahan2011). Moreover, fatty acids including conjugated linoleic acid (Wood and Enser, Reference Wood and Enser1997; Wood et al., Reference Wood, Richardson, Nute, Fisher, Campo, Kasapidou, Sheard and Enser2003; Elmore et al., Reference Elmore, Mottram, Enser and Wood2000; Aurousseau et al., Reference Aurousseau, Bauchart, Calichon, Micol and Priolo2004), as well as 2,3-octanodione (Priolo et al., Reference Priolo, Cornu, Prache, Krogmann, Kondjoyan, Micol and Berdague2004) and skatole (3-methylindole; Young et al., Reference Young, Berdague, Viallon, Rousset-Akrim and Theriez1997) have been found to be good indicators of the animal diet. Furthermore, the potential of other methods such as stable isotope ratio analysis of bioelements (Piasentier et al., Reference Piasentier, Valusso, Camin and Versini2003; De Smet et al., Reference De Smet, Balcaen, Claeys, Boeckx and Van Cleemput2004; Schmidt et al., Reference Schmidt, Quilter, Bahar, Moloney, Scrimgeour, Begley and Monahan2005) and near-infrared reflectance spectroscopy (NIRS; Cozzolino et al., Reference Cozzolino, De Mattos and Vaz Martins2002a and Reference Cozzolino, Vaz Martins and Murray2002b) to differentiate meat originating from different feeding regimes has been demonstrated. In spite of the success of these approaches, it is important to consider that analytical isotopic and chromatographic methods can be quite laborious and time-consuming. On the other hand, spectroscopic techniques such as NMR (nuclear magnetic resonance) and NIRS are rapid, reliable and non-invasive techniques that are highly reproducible and can be applied to samples without tedious manipulation; they are considered ‘fingerprint’ methods in authentication analysis.
Metabolomics is the study of metabolites (small molecule intermediates and products of metabolism), their dynamics, composition, interactions and responses to interventions or to changes in their environment, in cells, tissues and biofluids (Gibney et al., Reference Gibney, Walsh, Brennan, Roche, German and van Ommen2005; Oresic, Reference Oresic2009). NMR spectroscopy, which uses the magnetic properties of atomic nuclei to yield chemical information (Reid et al., Reference Reid, O′Donnell and Downey2006), is widely applied for metabolomic studies of biofluids, tissues and extracts (Nicholson et al., Reference Nicholson, Lindon and Holmes1999). NMR combined with multivariate analysis techniques has been used to authenticate various foods (Belton et al., Reference Belton, Colquhoun, Kemsley, Delgadillo, Roma, Dennis, Sharman, Holmes, Nicholson and Spraul1998; Brescia et al., Reference Brescia, Caldarola, de Giglio, Benedetti, Fanizzi and Sacco2002; Charlton et al., Reference Charlton, Farrington and Brereton2002) and to detect adulteration in meat products (Al-Jowder et al., Reference Al-Jowder, Casuscelli, Defernez, Kemsley, Wilson and Colquhoun2001). In addition, NMR analysis has been applied to discriminate beef from animals fed different diets. For instance, Renou et al. (Reference Renou, Bielicki, Deponge, Gachon, Micol and Ritz2004) reported that a combination of selected NMR parameters measured in adipose tissue was adequate to distinguish between animals fed on maize silage and pasture grass. However, the current approach focused on alterations in the metabolomic composition of the easily accessible biofluid urine and muscle tissue as a consequence of various production systems based on combinations of pasture, silage and concentrate diets.
The objective of this study was to investigate whether 1H NMR of bovine urine could be used as a rapid and non-invasive technique to discriminate between beef produced under different pasture and concentrate-based production systems.
Material and methods
Animals, diets and sampling
A detailed description of the animals and diets used in this experiment was published previously (Röhrle et al., Reference Röhrle, Moloney, Black, Osorio, Sweeney, Schmidt and Monahan2011). Briefly, 100 Charolais × Limousin crossbred weanling heifers at Teagasc, Animal and Grassland Innovation Centre (Grange, Dunsany, County Meath, Ireland) were assigned at random to one of four production treatments (25 heifers per treatment). The four production treatments were: grazed pasture outdoors (mainly Lolium perenne L., Poa spp. and Trifolium repens L.) from November 2006 to October/November 2007 (treatment P (pasture outdoor)); grass silage offered ad libitum indoors from November 2006 to April 2007, then grazed pasture outdoors from April to October/November 2007 (treatment SiP (silage followed by pasture outdoor)); grass silage offered ad libitum indoors from November 2006 to April 2007, then grazed pasture plus 0.5 of the dietary dry matter as supplementary concentrate from April to October/November 2007 (treatment SiPC (silage followed by pasture outdoor with concentrate)); concentrate and straw indoors from November 2006 to October/November 2007 (treatment C (barley-based concentrate indoor)). The composition of the concentrate was 430 g/kg pelleted beet pulp, 430 g/kg rolled barley, 80 g/kg soyabean meal, 35 g/kg molasses, 20 g/kg mineral/vitamin premix and 5 g/kg lime. The mean (±s.d.) body weights at the end of the trial were 511 ± 38, 501 ± 28, 532 ± 36 and 506 ± 39 kg for animals in the P, SiP, SiPC and C groups, respectively. The mean (±s.d.) carcass weights were 269 ± 19, 264 ± 17, 289 ± 19 and 277 ± 22 kg for animals in the P, SiP, SiPC and C groups, respectively. Mean (±s.d.) carcass fatness scores (based on European Beef Carcase Classification scheme) were 3.16 ± 0.60, 2.74 ± 0.78, 3.52 ± 0.53 and 2.90 ± 0.45 for animals in the P, SiP, SiPC and C groups, respectively.
Animals were slaughtered according to European Union regulations at Meadow Meats Ltd (Rathdowney, County Laois, Ireland). Two out of 100 animals (from the P and SiP groups) died during the study from causes unrelated to the dietary treatments. A urine sample was taken using syringe, after evisceration, from the urinary bladder of each of 68 animals (18 P animals, 19 SiP animals, 16 SiPC animals and 15 C animals). Samples were immediately snap frozen in individual vials and stored at −80°C until processing using NMR. In addition, within 30 min of slaughter 98 muscle samples (∼1 g) were excised from the Longissimus dorsi of each carcass (24 P animals, 24 SiP animals, 25 SiPC and 25 C animals) at the 12th/13th rib region, immediately snap frozen in vials and stored at −80°C until processing using NMR. For statistical analysis, individual muscle and urine samples were considered to be experimental units.
Preparation of samples for NMR analysis
Urine samples
Urine samples were thawed for 1 h at room temperature. Aliquots of 500 μl of urine were transferred into Eppendorf vials and 200 μl of sodium phosphate buffer (0.2 M Na2HPO4/0.04 M NaH2PO4, pH 7.4) was added. Samples were allowed to stand for 10 min and centrifuged at 8000 × g for 5 min. After centrifugation, a 530 μl aliquot was combined with 50 μl of D2O and 10 μl of trisodium phosphate (TSP) solution (7 mmol/l, 3-trimethylsilylpropionic −2, 2, 3, 3-tetradeutero acid).
Muscle samples
In all, 600 mg of frozen tissue was cut and transferred into a mortar placed on ice; 2 ml of perchloric acid (6%) was added to each sample which was ground until the muscle was totally dissolved. The solution was then transferred to a sterile plastic tube (15 ml) on ice; 1 ml of distilled water was used to transfer remaining sample from the mortar to the tube. The tubes were centrifuged at 1750 × g for 15 min at 4°C. The supernatant was transferred to empty (15 ml) tubes on ice. The centrifugation was performed once again after the addition of 1 ml of sterile water to the remaining pellets before centrifugation. The supernatants were combined and pH values were adjusted to pH 7.0 to 7.5 using KOH (0.1, 1.0 and 5.0 M) and HCl (0.1 M). Following centrifugation (2500 × g for 6 min, 4°C), the supernatant was taken and stored at −20°C until freeze-drying.
Freeze-dried samples were dissolved in 1 ml of buffer (0.2 M K2HPO4/0.2 M KH2PO4 in D2O, pH 7.4) and allowed to stand for 20 min. Tubes were then centrifuged at 1500 × g for 5 min. In all, 600 μl of supernatant was combined with 10 μl of TSP (7 mmol/l).
NMR measurements and data processing
Spectra were acquired on a 600 MHz Varian NMR spectrometer using the first increment of a NOESY (nuclear overhauser enhancement spectroscopy) pulse sequence at 25°C. Spectra were acquired with 16 K data points and 128 scans over a spectral width of 9.6 kHz. Water suppression was achieved during the relaxation delay (1 s) and the mixing time (200 ms). All 1H NMR urine spectra were referenced to TSP at 0.0 p.p.m. and processed manually with Chenomx (version 6) using a line broadening of 0.2 Hz. The spectra were integrated into bins consisting of spectral regions of 0.04 p.p.m. and the water region (4.0 to 6.0 p.p.m. for urine spectra and 4.5 to 5.3 p.p.m. for muscle extract spectra) was excluded. The data were normalized to the sum of the spectral integral. The discriminating regions were assigned to metabolites using in-house libraries and the Chenomx library (version 6).
Multivariate analysis
Multivariate data analysis was performed using Simca-P+ software (version 11.0; Umetrics, Umeå, Sweden). Data sets were scaled, using Pareto scaling. Principal component analysis (PCA) was applied to data sets to explore any trends in the data. In addition, the difference between the pre-defined groups was further explored using a supervised technique called partial least squares-discriminant analysis (PLS-DA; Brennan, Reference Brennan2008). The objective with PLS-DA is to find models that allow the maximum separation among classes of objects and help in identifying the best variables that contribute to that separation. In this context, PLS-DA accomplishes a rotation of the projection to latent variables focusing on class separation. The quality of all models was examined using the predictive ability parameter (Q 2), which is calculated by an internal cross-validation of the data and the goodness-of-fit parameter (R 2). R 2 represents the explained variance of a model (R 2X is the explained variation in X), and is used as a measure of the goodness-of-fit of the model. The closer the values are to unity, the better the model. The VIP (variable importance in the projection) value of each variable in the model was calculated to indicate its contribution to the classification of samples. Variables with a VIP value greater than 1.5 were considered important in discriminating between groups.
Results and discussion
Discrimination of production systems using urine samples
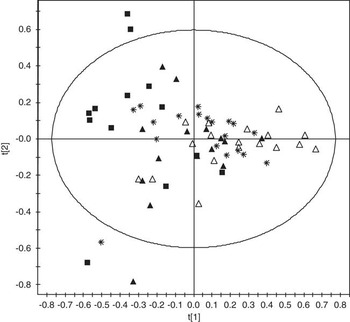
PCA was performed on urine samples (68 observations) from the four groups of animals to detect possible sample separation derived from the spectral NMR data. The PCA plot from the first two components describing 59% of the variation in the data is depicted in Figure 1 and shows a separation between samples from the P and C groups.
PCA scores plot (principal component 1 v. principal component 2) obtained from urine data from animals under treatment C (solid squares), P (hollow triangles), SiP (solid triangles) and SiPC (stars). PCA = principal component analysis; C = barley-based concentrate indoor; P = pasture outdoor; SiP = silage followed by pasture outdoor; SiPC = silage followed by pasture outdoor with concentrate.

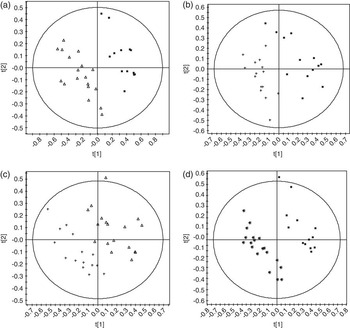
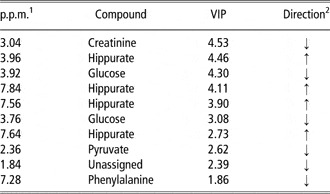
To investigate further the differences between the production systems, pairwise comparisons were performed on the 68 observations. Analysis of samples from dietary regimes P and C resulted in a model with R 2 = 0.6 and Q2 = 0.86 (Figure 2a). The discriminating metabolites are summarized in Table 1: animals fed on a concentrate diet were characterized by lower levels of urinary creatinine, glucose, pyruvate and phenylalanine and higher levels of hippurate.
PLS-DA scores plot obtained from urine data from animals: (a) under treatment C (solid squares) and P (hollow triangles; R 2X = 0.59, Q 2 = 0.86); (b) under treatment C (solid squares) and SiPC (crosses) (R 2X = 0.39, Q 2 = 0.66); (c) under treatment SiPC (crosses) and P (hollow triangles; R 2X = 0.48, Q 2 = 0.76); (d) under treatment SiP (stars) and C (solid squares; R 2X = 0.54, Q 2 = 0.87). PLS-DA = partial least squares-discriminant analysis; C = barley-based concentrate indoor; P = pasture outdoor; SiP = silage followed by pasture outdoor; SiPC = silage followed by pasture outdoor with concentrate.

Urinary metabolites significantly different between animals fed a pasture diet (P) and a barley-based concentrate diet (C)

VIP = variable importance in the projection.
1Refers to the chemical shift of the peak (referenced to trisodium phosphate at 0.0 p.p.m.).
2↑: higher in C group; ↓: lower in C group.
Creatinine is a breakdown product of creatine in muscle, which is an important energy metabolite in muscle (Koutsidis et al., Reference Koutsidis, Elmore, Oruna-Concha, Campo, Wood and Mottram2008). Creatinine levels in the urine are known to reflect muscle mass (Borsook and Dubnoff, Reference Borsook and Dubnoff1947), although no significant differences in the mean carcass weight and fatness between dietary groups P and C were found in this study. The higher amount of creatinine in the P group could also reflect a higher energy demand by the muscles of these animals, as animals fed pasture were not housed and therefore exercised more than those fed on a concentrate diet. Pyruvate is an end product of glycolysis and lies at the intersection of multiple pathways (Mohan et al., Reference Mohan, Hunt, Barstow, Houser and Muthukrishnan2010) including glycolysis, gluconeogenesis and the tricarboxylic acid (TCA) cycle. Increased pyruvate levels in the urine may reflect a decreased demand for synthesis of amino acids and other products from the TCA cycle. Hippurate is a normal component of urine and is formed by conjugation of benzoic acid and glycine. Although rumen microorganisms may synthesize benzoic acid from a variety of sources, benzoic acid is not normally synthesized by animals, and ingested benzoic acid is excreted in herbivorous animal's urine after conjugation, as hippuric acid (Sharma et al., Reference Sharma, Olson and Stowe1972). Higher levels of hippurate in urine samples from the C group indicates a possible higher level of benzoic acid in the ingredients from the concentrate compared with the grass as the concentration of hippuric acid in the bovine urine is strongly linked to diet (Kreula et al., Reference Kreula, Rauramaa and Ettala1978). The higher levels of glucose found in the urine from P animals than those from the C animals could be related to the rate of gluconeogenesis. Pearce and Unsworth (Reference Pearce and Unsworth1976) observed that the rate of gluconeogenesis was higher in sheep given grass diets than the concentrate-fed sheep, concluding that the type of diet can also influence enzyme activities in animal tissues.
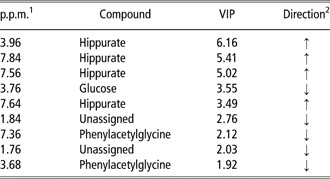
Comparison of the animals from the SiPC and C groups resulted in a robust model (R 2 = 0.39; Q 2 = 0.66) discriminating the urine samples from the two production systems (Figure 2b). Urine samples from the C animals were characterized by lower levels of glucose and phenylacetylglycine compared with SiPC animals (Table 2). Phenylacetylglycine is a glycine conjugate of phenylacetic acid and in the present situation may represent a novel marker of silage-fed animals. In addition, comparison of urine from animals following SiPC and P feeding regimes resulted in a clear discrimination according to feeding regime (R 2 = 0.48, Q 2 = 0.76; Figure 2c).
Urinary metabolites significantly different between animals fed a barley-based concentrate diet (C) and silage followed by pasture with concentrate diet (SiPC)

VIP = variable importance in the projection.
1Refers to the chemical shift of the peak (referenced to trisodium phosphate at 0.0 p.p.m.).
2↑: higher in C group; ↓: lower in C group.
Comparison of feeding regimes SiP and C resulted in clear separation of the groups (Figure 2d; R 2 = 0.54, Q 2 = 0.87). However, pairwise comparison of samples from SiP and P groups resulted in a weak model (R 2 = 0.48, Q 2 = 0.26). This was not unexpected because animals in the P and SiP groups received the same diet (grass at pasture) for the final 6 months before slaughter.
Discrimination of production systems using muscle samples
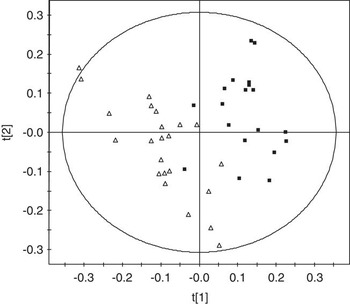
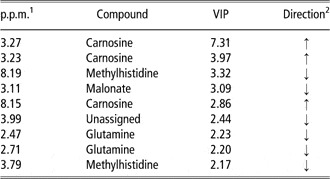
PLS-DA analysis was performed on muscle extracts (96 observations of which 23, 24, 25 and 24 were from the P, SiP, SiPC and C groups, respectively) and the strongest model was obtained for comparison of C animals v. P animals (Figure 3; R 2 = 0.55, Q 2 = 0.53). The metabolites discriminating according to production system are summarized in Table 3 and included higher levels of carnosine, and lower levels of methylhistidine, malonate and glutamine in the C group. Carnosine is a dipeptide of the amino acids β-alanine and histidine and is found exclusively in animal tissues. In contrast to our findings, Koutsidis et al. (Reference Koutsidis, Elmore, Oruna-Concha, Campo, Wood and Mottram2008) found similar carnosine levels in bovine muscle of animals fed a barley-based concentrate and those fed perennial ryegrass silage and also reported no significant differences in the concentration of the amino acid glutamine between these two dietary treatments. The latter results suggest that carnosine and glutamine may not be good markers for the animal production systems. Furthermore, Purchas and Busboom (Reference Purchas and Busboom2005) reported a higher level of carnosine in muscle from pasture-finished cattle compared with concentrate-finished cattle. Methylhistidine is a product of peptide bond synthesis and methylation of histidine of actin and myosin; it becomes available as a free amino acid when these proteins are broken down during proteolysis. The higher amount found in the muscle of the P group could indicate a high rate of skeletal muscle protein breakdown in these animals (Brown et al., Reference Brown, Barnes and Calvert1987; Almeida et al., Reference Almeida, Schwalbach, de Waal, Greyling and Cardoso2008). The identification of methylhistidine as a discriminating metabolite in muscle is also noteworthy because methylhistidine in human urine is considered a potential biomarker of meat intake in humans (Jacobson et al., Reference Jacobson, Newmark, McKeown-Eyssen and Bruce1983). Although the PLS-DA models in muscle were not as strong as in urine, this approach could be used as an alternative approach for authentication purposes in the absence of urine.
PLS-DA scores plot (R 2X = 0.55, Q 2 = 0.53) obtained from muscle data from animals under treatment C (solid squares) and P (hollow triangles). PLS-DA = partial least squares-discriminant analysis; C = barley-based concentrate indoor; P = pasture outdoor.

Muscle metabolites significantly different between animals fed a pasture diet (P) and a barley-based concentrate diet (C)

VIP = variable importance in the projection.
1Refers to the chemical shift of the peak (referenced to trisodium phosphate at 0.0 p.p.m.).
2↑: higher in C group; ↓: lower in C group.
Conclusions
Metabolomic analysis of urine samples from animals raised under different production systems proved capable of discriminating between selected production systems. The use of urinary metabolomic analysis represents a novel tool that could easily be translated into practical use with the major advantage that the sample can be obtained in a non-invasive manner. This study identified several novel markers that could potentially be developed into a panel of markers used for beef authentication. Included in these were creatinine, glucose, hippurate, pyruvate, phenylalanine and phenylacetylglycine. In order to make NMR measurement simpler and automated for implementation as a routine method for authentication of production system two options are suggested: (i) shipment of samples to specialist laboratories for analysis or (ii) development of specific kits for analysis of the metabolites found to be different in this study. Additional support for a metabolomic-based approach for beef authentication came from analysis of muscle samples that again showed differentiation according to the production system (pasture outdoors v. barley concentrate indoors). However, further research is required to validate the method for classification of cattle according to a wider range of potential production systems.
Acknowledgements
This research was funded by the Irish Department of Agriculture, Fisheries and Food under the Food Institutional Research Measure of the Productive Sector Operational Programme of the 2000 to 2006 National Development Plan.