Despite thousands of years of contact across the Bering Strait (Mason Reference Mason2020), the “discovery” of Alaska is generally dated to Vitus Bering’s second Kamchatka Expedition in 1741–1742. Russian claims to the region grew with the presence of the Northeastern Company (1781) and the Russian American Fur Company (1799) with its posts down the coast to California and more established settlements at Kodiak and Sitka. There was also an organized religious presence with Russian Orthodox missionaries. However, retrenchment by the Imperial Russian government in the mid-1800s, declining profitability of the fur company, and the end of its company charter, led to the “sale” of Alaska to the United States in 1867.Footnote 1 Fish canneries, commercial whaling, sealing, and fishing grew in the second half of the nineteenth century, with a European/American presence mainly along the coast. This changed in 1900 with the discovery of gold bringing an influx of Americans and Canadians to the interior. The first four decades of the twentieth century would see more change: further development of commercial fish, canning plants, and commercial mining companies; greater non-Indigenous population; and the introduction of domestic reindeer herds to alleviate presumed food insecurity (Willis Reference Willis2006). Each of these changes, from pressure on food stocks to pressure on land and ocean resources to greater contact with diseases (Bockstoce Reference Bockstoce2009; Burch Reference Burch2006), had direct implications for Indigenous communities and the native economy; yet, with the exception of Demuth (Reference Demuth2019), we know little about the lives of ordinary Indigenous households.
This article uses a novel data set – surveys of Indigenous households and communities conducted between 1938 and 1940. The surveys describe demographic structure, economic variables – both stocks and flows – and provide highly disaggregated detail on the property, livestock, and economic activity for each household in the surveyed communities. These surveys, conducted at a moment of change, represent unique community-level data by household.Footnote 2 The 1940s began a new era in Alaska history with the growth of the military complex during World War II (WWII) and the subsequent Cold War (Sandberg Reference Sandberg2013). Subsequent decades would see the rise of oil and gas exploration with its related pipeline infrastructure and increased in-migration. In 1940, Indigenous peoples comprised 50 percent of the population in Alaska, by 2000 that would fall to roughly 16 percent.
Alaska is physically separate from the contiguous 48 states and is often not included in discussions of American economic growth. It is a large multi-ethnic, multi-cultural region. Reserve lands, the Dawes Act allotment, and its aftermath were not part of the Indigenous Alaska experience as they were for other Indigenous communities. As a result, Alaska natives had greater economic agency in 1940. Our objectives are twofold. First, we describe the choices made by Indigenous households in these 13 villages as shown through the surveys. The surveys describe the demographic and economic structure of Indigenous households, their consumption and production decisions, and household finances. Importantly, these choices detail the interplay of traditional and market activities in 1940. A second objective is to ask whether households and/or communities that chose to take part in Sheldon Jackson’s reindeer program in the early 1900s differ from those households or communities that decided not to take part.Footnote 3
Our analysis finds that by 1940, traditional activities comprised a major source of economic activity with output being used for both home consumption and for the market. Market activity is evident in all communities through sales of fish, furs, arts and crafts, or wage employment. Some communities took advantage of New Deal policies, such as working for the Civilian Conservation Corps (CCC). These activities provided income then used to purchase commodities for domestic use such as stoves and phonographs or for investment in boat motors, rifles, sewing machines, or fuel used in traditional and market production. This balance of traditional and market activities does not differ over reindeer-owning communities and non-reindeer-owning communities with one exception: Reindeer-owning communities had statistically significantly less debt. Regardless, no household was insolvent.
This article contributes to an understanding of Indigenous economic development among Indigenous communities and provides an important counterpoint to Indigenous economies in the contiguous United States (see Anderson and Parker Reference Anderson and Parker2008; Carlos et al. Reference Carlos, Feir and Redish2022; Carlson Reference Carlson1978, Reference Carlson1981; Dippel Reference Dippel2014; Feir, Reference Feir2016; Feir et al. Reference Feir, Gillezeau and Jones2023). We also contribute to the growing literature on the introduction of livestock to developing economies. Bandiera et al. (Reference Bandiera, Burgess, Das, Gulesci, Rasul and Sulaiman2017) and Banerjee et al. (Reference Banerjee, Duflo, Goldberg, Karlan, Osei, Parienté, Shapiro, Thuysbaert and Udry2015) demonstrated the efficacy of livestock programs in raising the economic prospects for those at the bottom of the income distribution. In contrast, we find that reindeer holding did not change economic prospects substantially across reindeer-owning and non-owning households. Finally, this article adds to our understanding of the economic history of Alaska in the first half of the twentieth century. It does so by focusing on Indigenous communities and their actions as described in the surveys.
The article is structured as follows. We begin with a short description of the Alaska economy to provide a context for the community and household surveys. This is followed by a detailed discussion of the data by category and village. We then analyze the data more formally discussing our estimation strategy and results. The final section has concluding remarks.
A changing landscape
Although isolated, Alaskan Indigenous communities were never autarkic or isolated. Indeed, as documented by archaeological evidence, long-distance and international trade predates the arrival of Europeans.Footnote 4 It was the scale of the Russian and then American trade that was new. For example, sea otters prized for their thick waterproof pelts were now harvested in such numbers for sale in China that stocks were ultimately depleted. In addition, commercial whaling and walrus hunting put pressure on those stocks, affecting communities on both sides of the Bering Strait (Demuth Reference Demuth2019).
The Russian exit from Alaska and its “sale” in 1867 to the United States changed the political landscape. Despite the word sale, neither country held legal title to the land. What was sold by Imperial Russia and purchased by the United States was not a property right over land but the Preemption Right to treat with the sovereign Indigenous nations whose land was now defined to lie within the borders of the United States. Legal land transfers were only resolved in 1971 with the Alaska Native Claims Settlement Act (ANCSA).Footnote 5 Alaska was, however, integrated into the United States administrative system through a series of Acts of Congress. With the First Organic Act in 1884 (15 Stat 240), Alaska became a civil and judicial district of the United States under the authority of an Agent General for Education – Sheldon Jackson.Footnote 6 With the Second Organic Act in 1912 (37 Stat. 512), Alaska became a territory, with a territorial governor, a territorial legislature, and capital in Juneau. Eligibility to vote, either for the Alaska legislature or the federal Congress, required that a person have been a citizen for seven years, have lived in the district for two years and be older than 24. Indigenous in Alaska, as all Indigenous Americans, were not American citizens. Congress only passed the Indian Citizenship Act (43 Stat. 253 also known as the Snyder Act) in 1924. Prior to that, to be eligible to be a citizen and to vote, a person deemed Indigenous had to renounce native status. Alaska, finally, became a state in 1959.
Today, Alaska has an estimated population of over 700,000 of which roughly 16 percent are Indigenous.Footnote 7 The population is highly concentrated in cities and towns and their suburban areas with the non-Indigenous presence concentrated in these urban areas and along the Panhandle. Outside of these cities and towns, Alaska remains low density with the population living in small communities. The many Indigenous nations differ geographically, linguistically, and culturally. For example, Eyak, Haida, Tsimshian, and Tlingit nations or communities live along the panhandle, Unangax and Alutiiq on the Aleutian Island chain, Yup’ik and Cup’ik and Inupiaq and St Laurence Island Yupik along the coast, and various communities of Athabascan speaking communities in the interior. Alaska was, and is, a diverse, multi-ethnic society.
Indigenous traditional economies
Indigenous economies have traditionally revolved around hunting, fishing, and gathering as the resources and seasons permitted and are often described as hunter-fisher-gatherer communities rather than resource managers (Burch Reference Burch2006; Sloan Reference Sloan2019). The hunter/gatherer label has often carried with it, implicitly or explicitly, a perception of being less developed than European/American agricultural societies, not to mention, industrial societies (Carlos Reference Carlos2023). Indeed, the dominant ideology within North American bureaucracies in the late nineteenth and early twentieth centuries was to force cultural and economic change through reserve land, allotment, farming, and Indian schools. Although the Department of Education set up schools in local communities, there were no land treaties, reserve lands, allotment or farming attempted in Alaska, thus providing a counterpoint to the situation in the lower 48 states.
An array of resources was available to Alaska’s Indigenous communities. Mammals, both marine and land – such as whale, walrus, seal, caribou, and smaller mammals – and fish and birds were hunted, fished, and netted. They were eaten fresh, salted, smoked, or frozen for the winter months, traded, and shared. These natural resources provided more than food. Skins and hides became clothing, tent material, and boat coverings. Bones became sewing needles and sled runners; seal oil and blubber cooking oil and light; wood for heating or spears and arrow shafts; stone was crafted into hatchets, cutting blades and awls; sinews for cords and sewing thread; flint and obsidian for arrowheads. Traditional hunting methods did not disappear with European contact but remained part of local lifeways, long after contact. Contact, however, made new commodities available. While commodities could be purchased on credit, at some point, debts had to be cleared by payment in cash, exchange in kind, or through sale of assets. Thus, after European contact, Indigenous communities could decide both on the extent of contact and the level of market activity relative to the reliance on household-made commodities.
Intrusions from outside – canning, mining, and reindeer
Contact with Russians and Europeans/Americans brought people, disease, and commercial/industrial activity to the region.Footnote 8 The first census in 1880 estimated a population of roughly 33,000 with fewer than 2 percent non-Indigenous.Footnote 9 By 1890, while the overall population remained essentially unchanged, the non-native population increased to 10 percent. Gold rushes in the 1890s further increased the non-native population and, by 1940 the population was 72,524, half native and half non-native. The largest city was Juneau with 5,729 residents.Footnote 10 The population would increase tenfold to 700,000 by 2020.
In 1940, commercial activity was dominated by fish canning and processing. Of 222 manufacturing establishments, fish canning and processing comprised 139 followed by bread and other bakery products (24 establishments) and lumber and timber products (18 establishments).Footnote 11 Even in fish canning and processing, the total number of wage earners (Indigenous and non-Indigenous) was only 4,810. Mining was the other important sector, with gold comprising 92 percent of the sector, followed by copper, lead, silver, tin, and some coal.Footnote 12 The largest lode mines were in southeastern Alaska stretching as far west as Ketchikan, dominated by the Alaska Juneau Gold Mining Co. The highest-value placer gold region was the Yukon Basin with $12 million of placer gold in 1940, followed by the Seward Peninsula and northwestern Alaska (Geological Survey 1940: 31).Footnote 13 Placer mining, by this time, was highly capital-intensive, with dredges, draglines, and thawing equipment (Geological Survey 1940: 28). However, the placer nature of mining meant that operation and employment were seasonal. In parallel to commercial operations, gold mining and commercial fishing were also conducted by self-employed persons who are not included in the wage-employment statistics.
One other new industry in the early twentieth century was reindeer herding. Reindeer are caribou. Both are the same species, Rangifer tarnadus. In 1890, Indigenous communities in Alaska did not herd domesticated caribou – reindeer. This changed when, in 1892, Agent General, Sheldon Jackson, petitioned Congress for funds to import reindeer from Siberia, arguing that rather than simply providing food to starving people it would be better and cheaper “to introduce into northern Alaska the domesticated reindeer of Siberia, and train the Eskimo young men in their management, care, and propagation.”Footnote 14 Jackson believed that coastal communities were facing food insecurity due to failing whaling, walrus, and seal populations from extractive commercial activity and the shifting Caribou migration patterns away from the Seward Peninsula (Burch Reference Burch2006; Demuth Reference Demuth2019; Stern et al. Reference Stern, Arobio, Naylor and Thomas1980; Willis Reference Willis2006). When denied, he crowd-sourced his request, placing advertisements in major Eastern newspapers and receiving over $2,000 in donations.Footnote 15 In the face of such public support, Congress authorized the use of the US Revenue Cutter Bear to transport the reindeer and the establishment of the Teller Reindeer Station on the Seward Peninsula. Over the decade, Congress allocated more funding for the project. Indeed, reindeer were imported annually from Siberia until 1902 when the Czarist government forbade their export. By that time, there were an estimated 6,000 reindeer in Alaska.Footnote 16
Initially organized at Teller, the reindeer program expanded to existing missionary schools.Footnote 17 The program was designed to give each man or boy 5 to 10 reindeer for each year of apprenticeship or work plus a loan of 50 reindeer (Olson Reference Olson1969). Women working at mission stations could also earn reindeer. Importantly, participation was voluntary (Demuth Reference Demuth2019; Ch. 5). Within a few years, Indigenous communities began protesting that reindeer were not being dispersed quickly enough, causing the Department of Interior to investigate. Its report issued in 1905 was critical of Jackson, who resigned. The new general agent, William Lopp, overhauled the program, creating the US Reindeer Service, with smaller reindeer stations in more distant villages.Footnote 18 The 1905 report also required that reindeer be distributed to any Indigenous communities wanting to participate (Demuth Reference Demuth2019; Willis Reference Willis2006), and by 1910, reindeer herds were owned by Inupiat and Yupik peoples, Aleut (Unanqax and Sugpiaq), Tlingit and Indian communities, as well as Saami who had been hired and brought over from Europe to teach reindeer herding (Stern et al. Reference Stern, Arobio, Naylor and Thomas1980; Willis Reference Willis2006).Footnote 19 The program, however, stipulated that Alaska natives could not sell reindeer to non-natives, a prohibition that did not extend to Saami. In 1914, one Saami sold his herd to Carl Lomen, a Nome businessman, who formed Lomen and Company, creating a non-Indigenous source of competition in the reindeer market. Complaints by Indigenous herders regarding Loman and Company led, in 1936, to the purchase of the Loman herd by the federal government.Footnote 20 Thus at the time of our surveys, reindeer were owned by some Indigenous communities and households and by the federal government.
To understand the interaction of traditional lifeways and new industries by Indigenous families, we turn to the novel survey data.
Survey data
The surveys discussed here were conducted between 1938 and 1940 and are listed under the Credit Section of the Alaska Extension Division of the Bureau of Indian Affairs, with no documentation.Footnote 21 With the Indian Reorganization Act (48 Stat. 984, 25 U.S.C. 461 et seq § 461 1934) and the subsequent Act to include Alaska (Ch. 254, §1, 49 Stat. 1250, 1936) native communities were encouraged to apply for a corporate charter,Footnote 22 which would give a community the power to make contracts, to manage village assets, to sue or be sued, make leases, and to borrow money for community investment from the Indian credit fund. As the instructions make clear, any application for a corporate charter required the inclusion of a survey.Footnote 23 The survey requirements listed in the legislation closely match the items covered in our surveys, and each of the villages discussed received a corporate charter, the dates of which correspond within a few months to the date of the survey.Footnote 24 We believe these surveys to be the surveys conducted as part of the requirements to obtain a charter. We do not know why these surveys were selected by the Credit Section for publication, nor do we know if other surveys have survived.
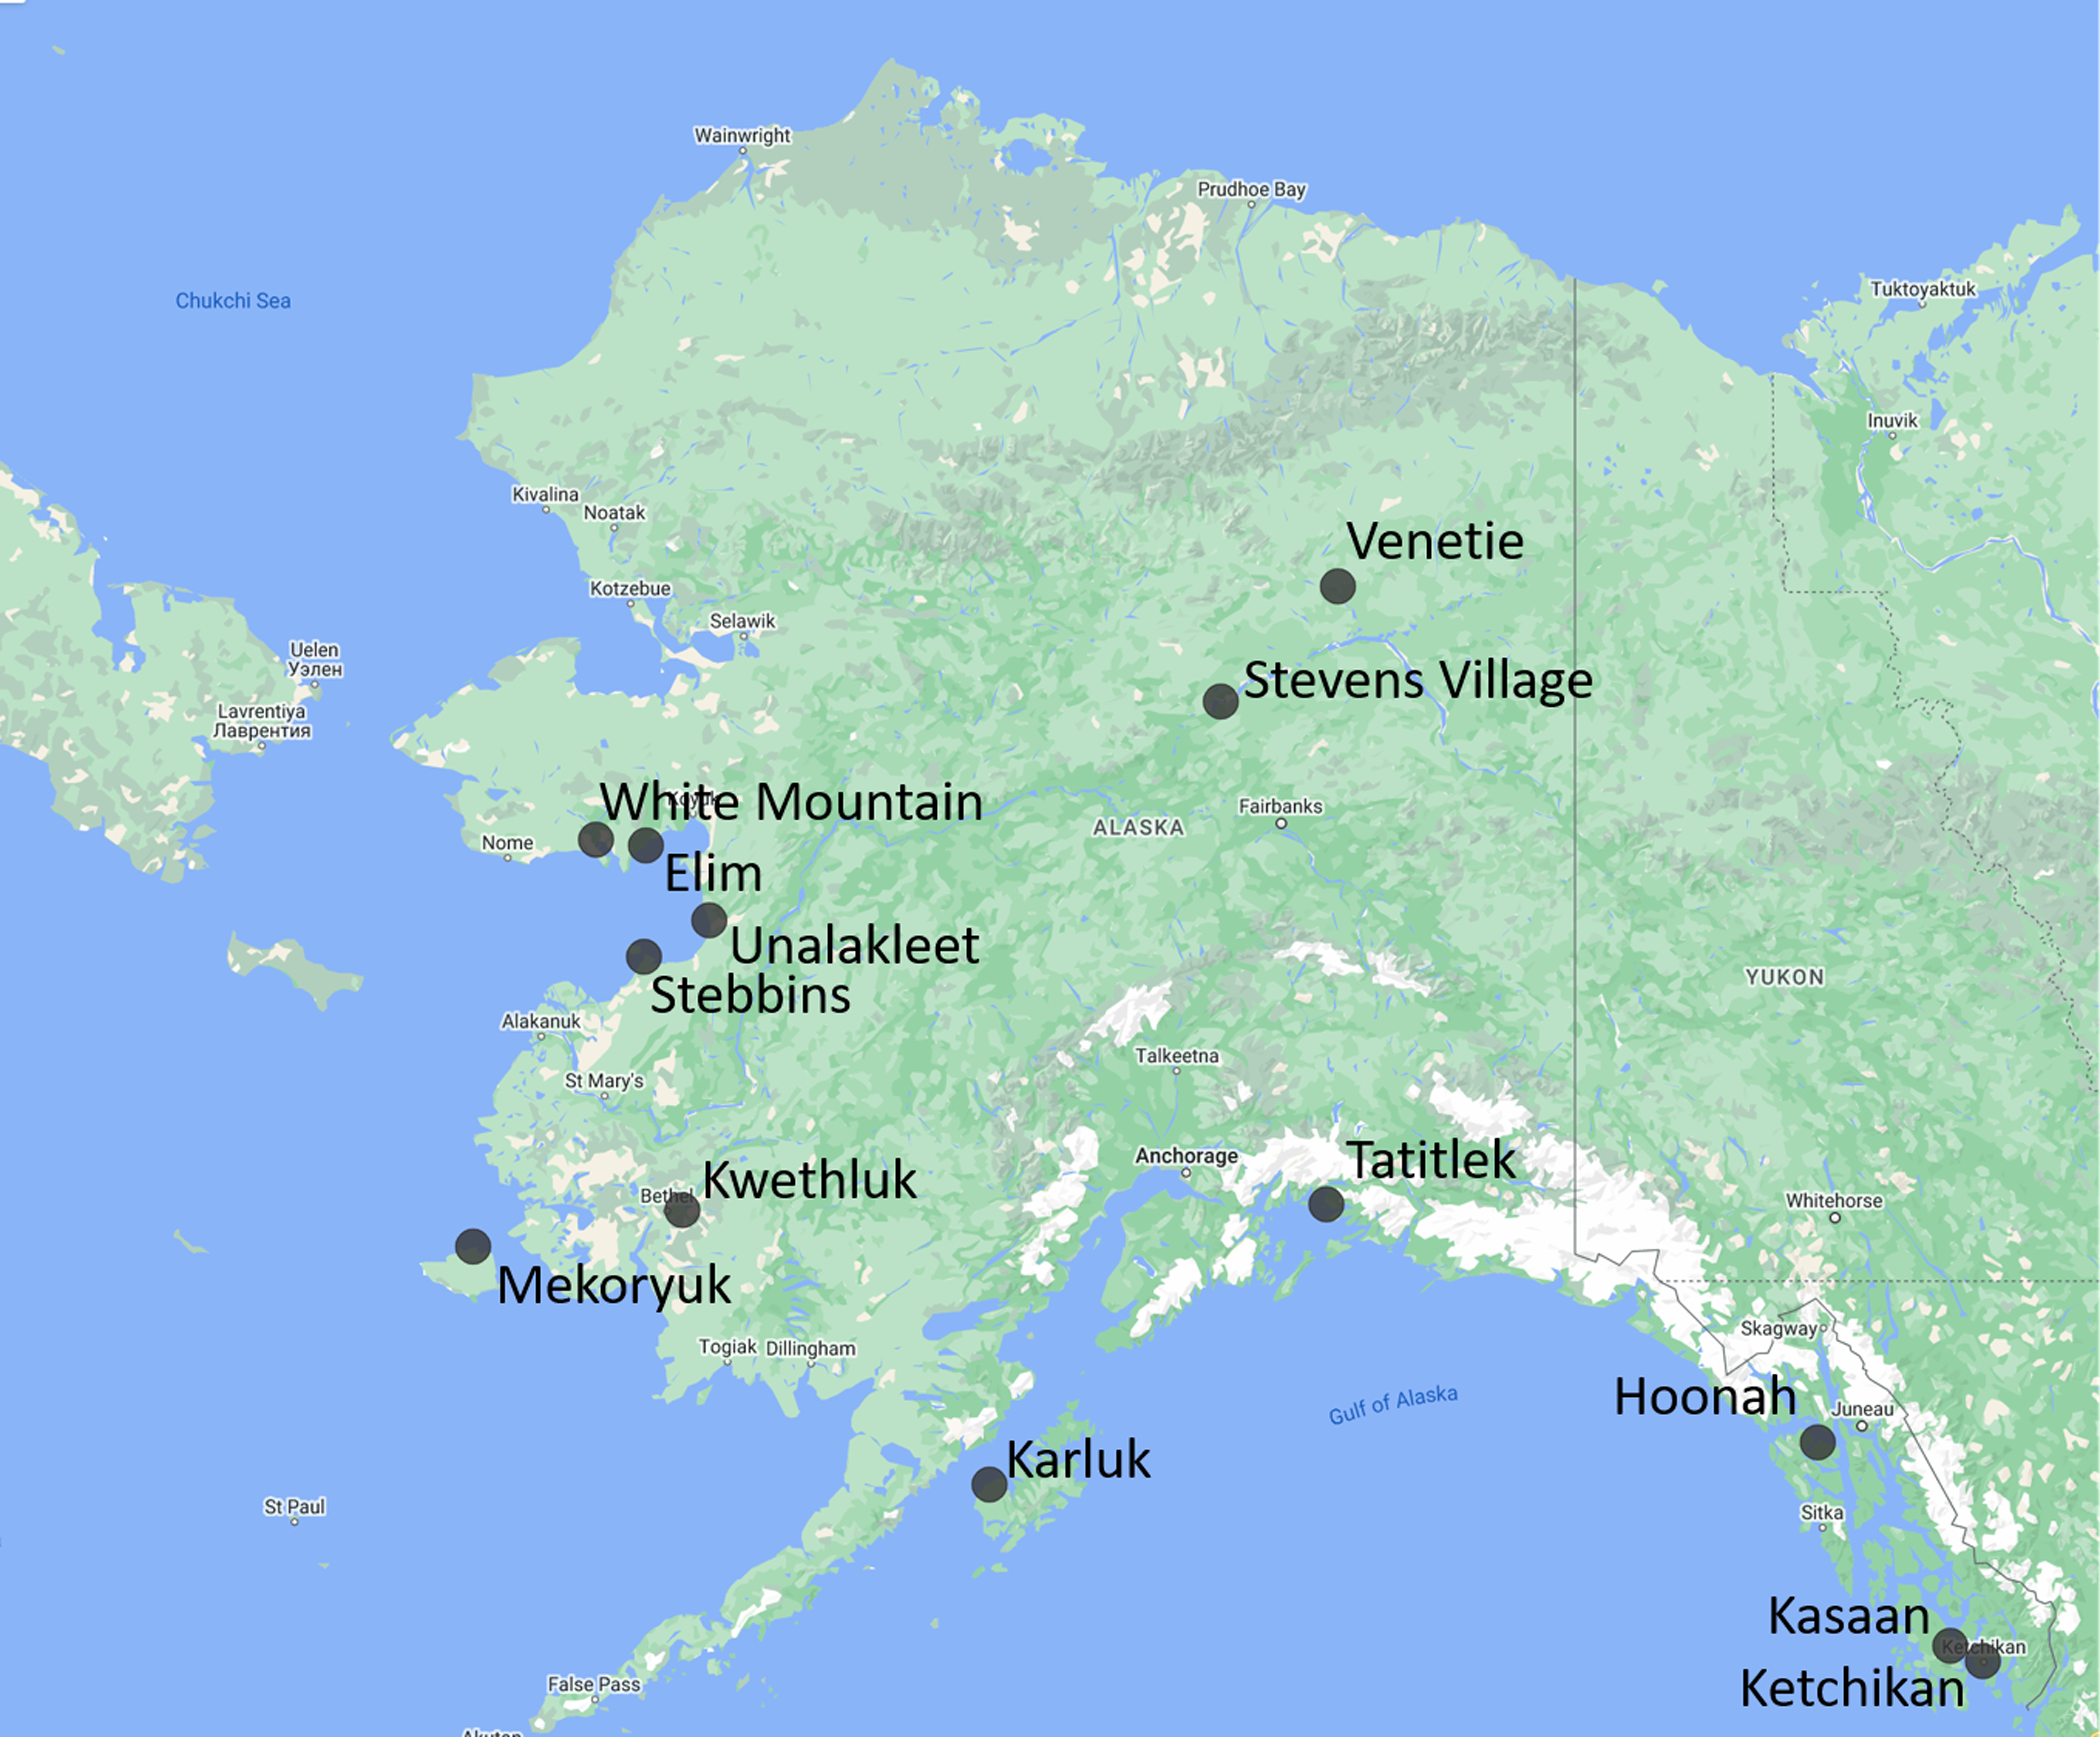
The surveys cover 13 Indigenous communities comprising 367 Inupiat and Native Alaska households for a total of 1,836 individuals or 5.6 percent of Alaska Natives. Footnote 25 The village locations are shown in Map 1.
Location of villages in the survey.
Source: Statistical Records and Reports of the Alaska Division of the Bureau of Indian Affairs, 1912–1941. Economic Surveys of Cities and Towns by the Credit Section, Alaska Extension Division, 1938-1941. No. 819A, Elim to White Mountain.

There is variation in the geographic location of the survey villages: Ketchikan, Kasaan, and Hoonah are located along the Alaska Panhandle; Mekoryuk and Karluk are situated on islands off the coast; three villages are inland – Stevens Village, Venetie up the Yukon River in Central Alaska, and Kwethluk, up the Kwethluk River.Footnote 26 Although there are no villages on the North Slope coast, the survey villages include Inupiat, Aleut, Tlingit, and Athabaskan-speaking communities.
The surveys focus only on native households in each of these communities, but, in most villages, the surveyed households constituted close to the total community population.
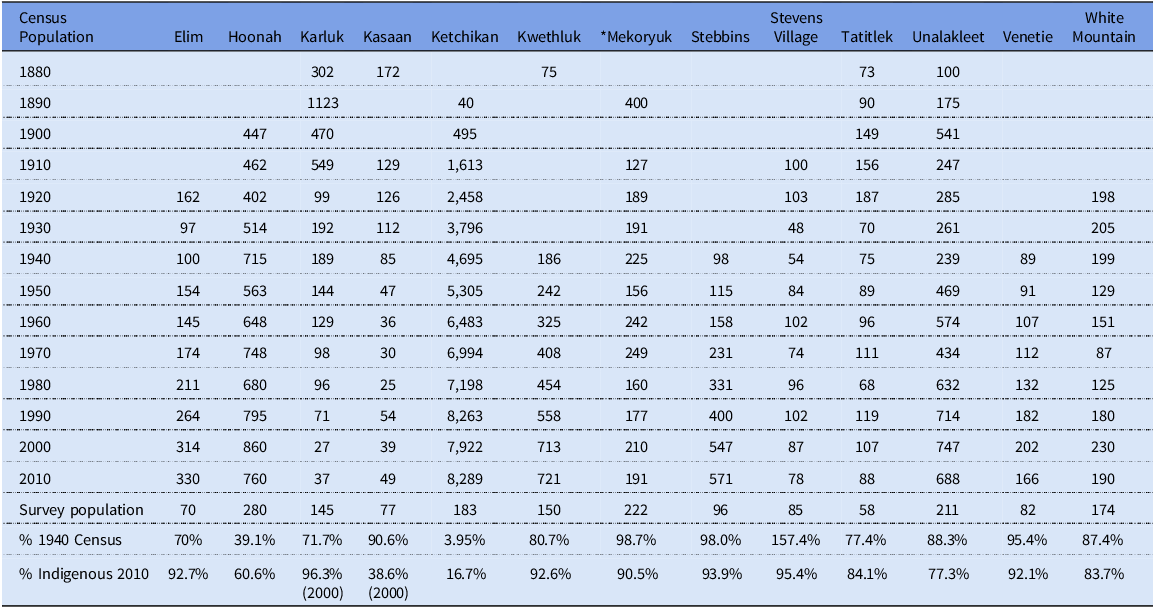
In Table 1, we list the US census decadal populations of each community to 1940, the survey population for each village in 1940, and the survey population as a percentage of the 1940 census population.Footnote 27 Then as of now, rural communities are small. In 11 of the 13 villages, the surveyed population was at least 70 percent of the 1940 census population, and, in 5 villages, it constituted over 90 percent of the 1940 census population. The last row supplies the percent of the village population Indigenous in the 2010 census. The three communities on the Panhandle – Hoonah, Kasaan, and Ketchikan – had large non-native populations in 2010, but only Hoonah and Ketchikan had a significant non-native presence in 1940. Each village was surveyed only once and, unfortunately, they were not necessarily surveyed in the same month, which means villages are captured across the seasonal calendar.Footnote 28 At the same time, because they were conducted at the household level, these surveys provide a unique cross-sectional glimpse into the economic activities and life of Indigenous communities at the end of the Great Depression and on the eve of World War II. Of the thirteen villages surveyed, five owned reindeer and eight did not. Reindeer-owning villages are shaded in gray in the tables.Footnote 29
Village populations in census years

Source: Data on village census-year population taken from the US Census populations given by each community on its Wiki page. Lack of data at the end of the nineteenth century and early twentieth does not imply any community but rather one that was not visited by a census taker. The very high population in Karluk in 1890 came from a cannery and a plurality of Chinese workers. The cannery closed and moved before 1900. The survey population for Stevens Village is higher than the 1940 census population. One possibility is a transcription error of 54 rather than 84.
*Reported as the entire Island of Nunivak 1910–1940.
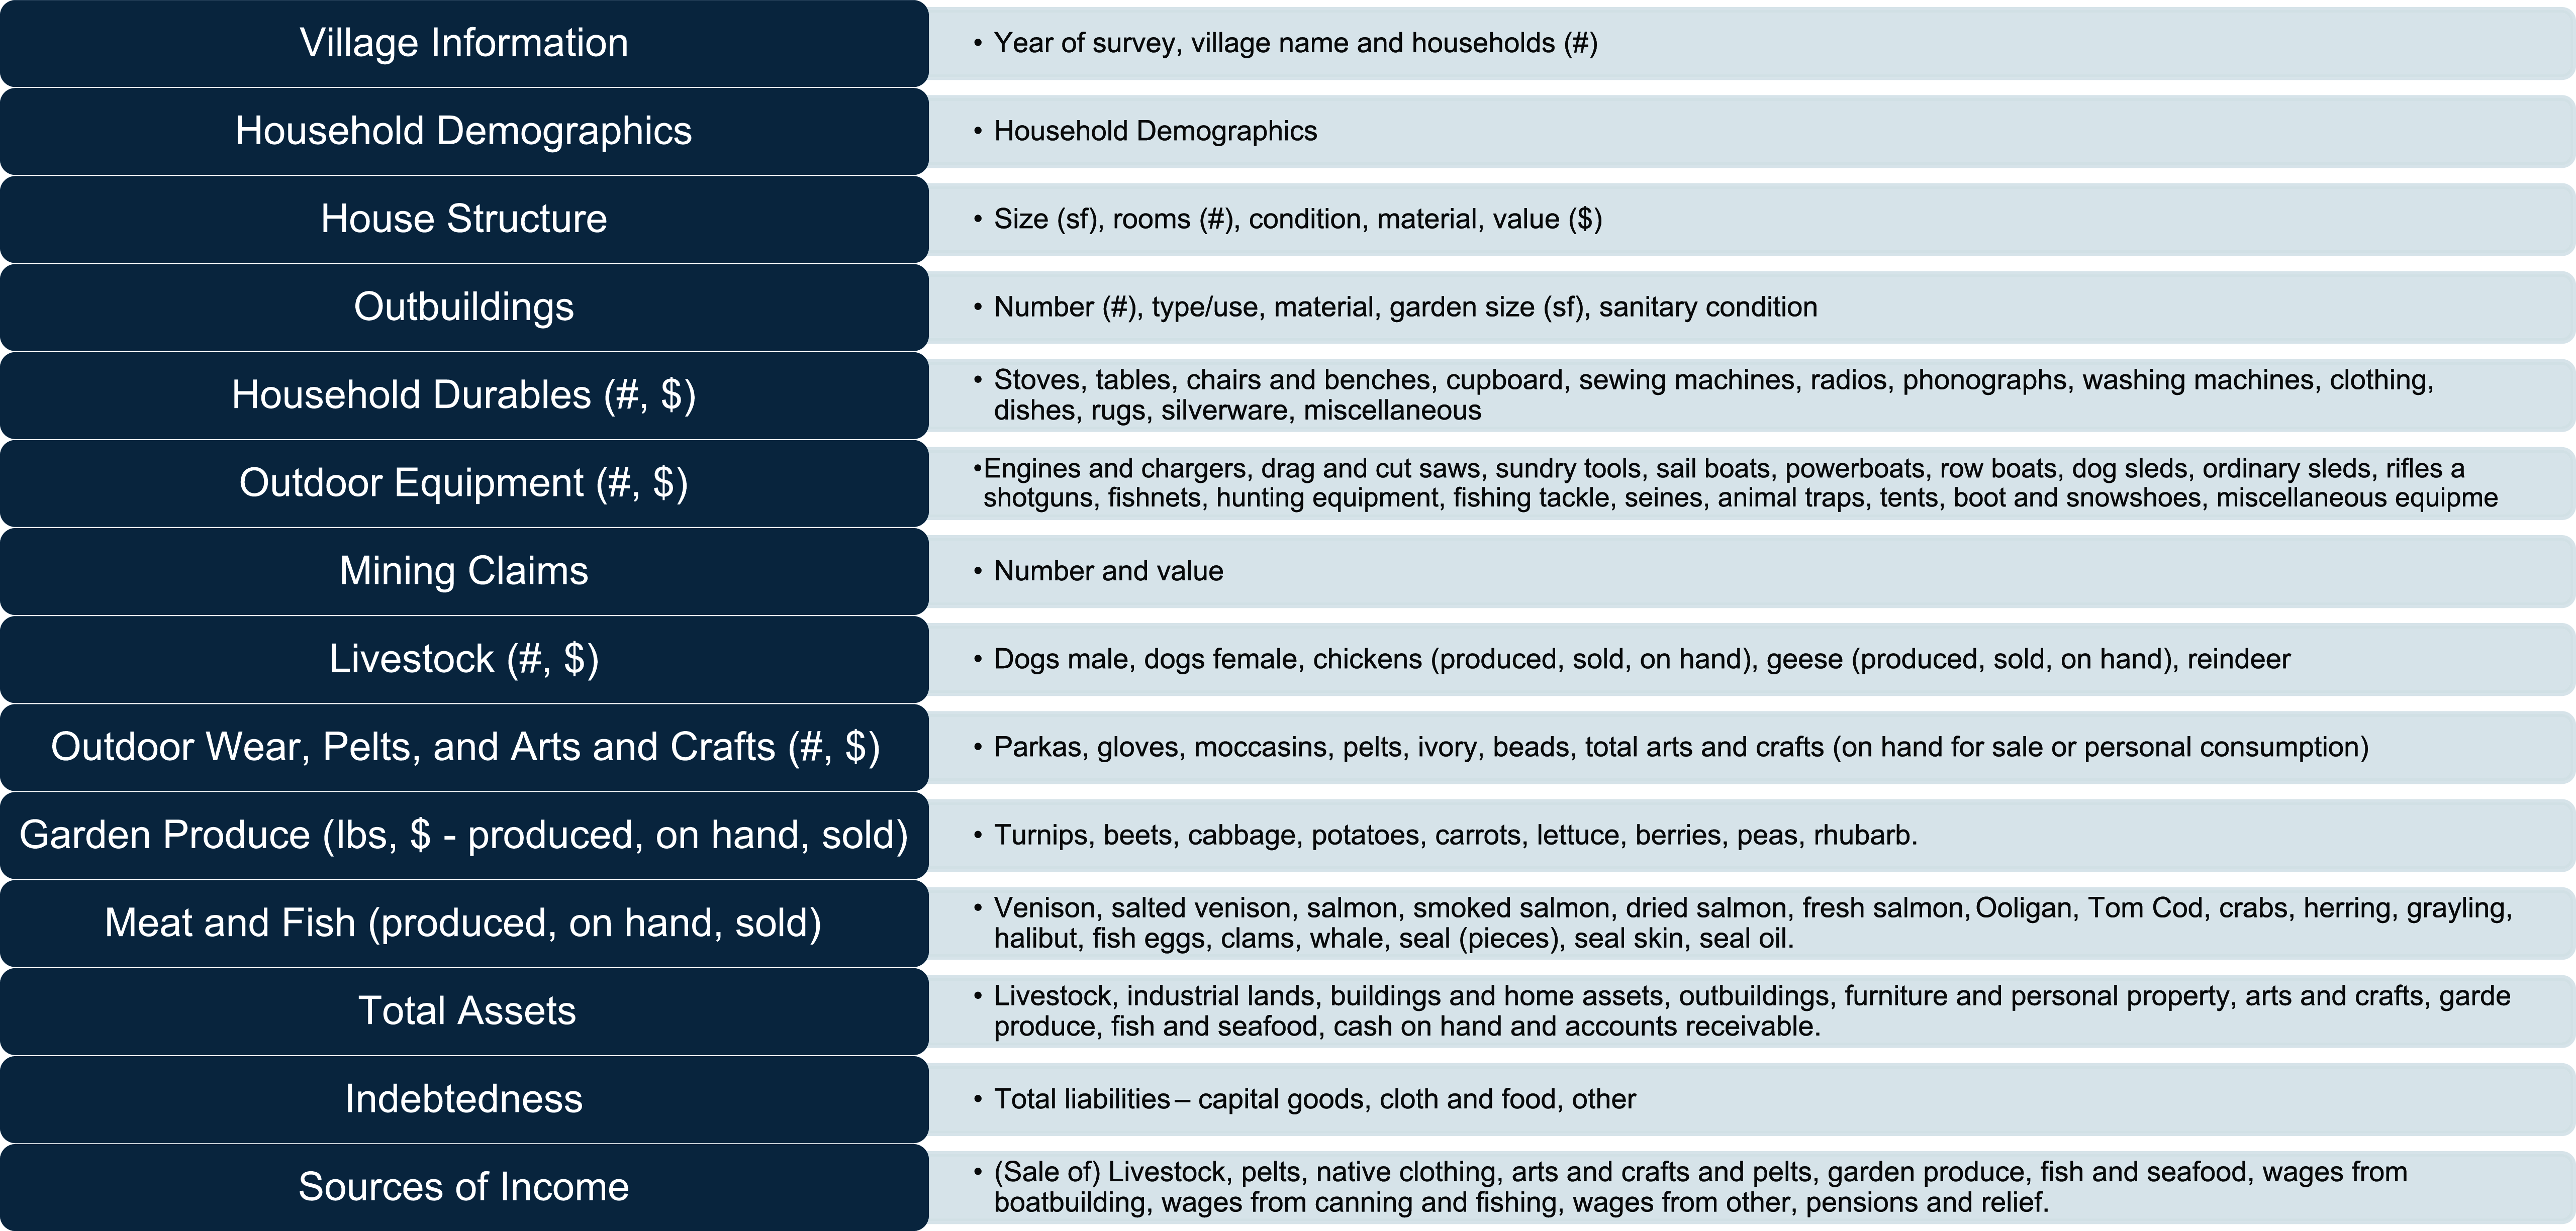
The survey is largely identical across all villages and is impressive in its detail, with fifteen higher-level components complete with extensive detail on the constituent elements within each component. Fig. 1 shows the survey components and illustrates the detail in which assets were recorded.Footnote 30
Constituent sections in the surveys.
Source: Statistical Records and Reports of the Alaska Division of Bureau of Indian Affairs, 1912–1941: Economic Surveys of Cities and Towns 1939–1941: Elim-White Mountain.

Each survey documents demographic and economic structure at the household level, economic activity and flows of production for home consumption and market sale, and local employment opportunities. It also records revenue and debts. What is not included are the names of household members. Despite this, we feel confident that the survey captures Indigenous households and their economic activity following many decades of interaction with non-Indigenous manufacturing and resource operations. To be clear, the issue is not an argument that Indigenous households should be static, but rather to describe the nature of these households on the eve of World War II and in a small way to provide a baseline for changes in the second half of the century.
Indigenous family composition
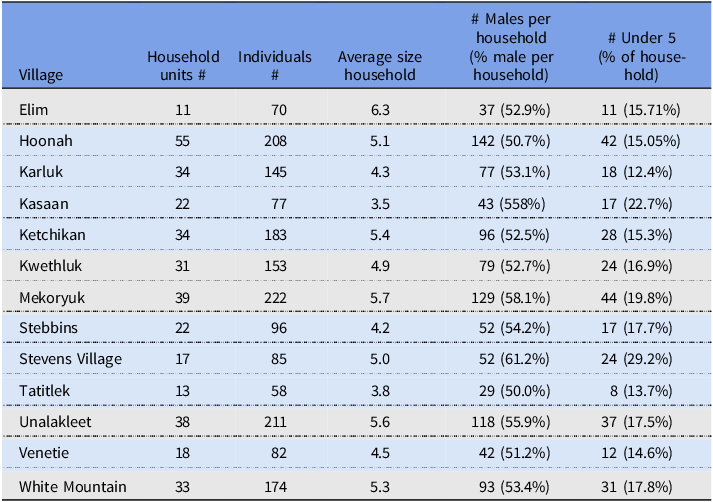
Each survey begins with household composition: the total number of people, gender, household members by age bracket (but unfortunately not gender by age), and “degree” of race.Footnote 31 Age is listed as under age 5 and 5–10, and then in ten-year intervals from 10 to 59, then 60+. Summary statistics are shown in Table 2 documenting number of households, number of people, average household size, and number of men and younger children by village. No village is large, although reindeer-owning villages are somewhat larger on average than non-reindeer-owning villages with an average of 30 households relative to 27 and with an average of 165.4 individuals relative to 118.5 individuals. That said, Elim, a reindeer-owning village with eleven households, was the smallest in the survey, while Hoonah, a non-reindeer-owning village with 55 households, was the largest. Elim, however, had the highest average household size with 6.3 individuals. Except for Kasaan (3.5), the average household size across the survey was larger than the 1940 US average of 3.76 people.
Household composition by village

Source: Statistical Records and Reports of the Alaska Division of the Bureau of Indian Affairs, 1912–1941. Economic Surveys of Cities and Towns by the Credit Section, Alaska Extension Division, 1938–1941. No. 819A, Elim to White Mountain.
The 1940 US Census of Population gives average family size as 3.76 people.
Villages with reindeer are highlighted in gray.
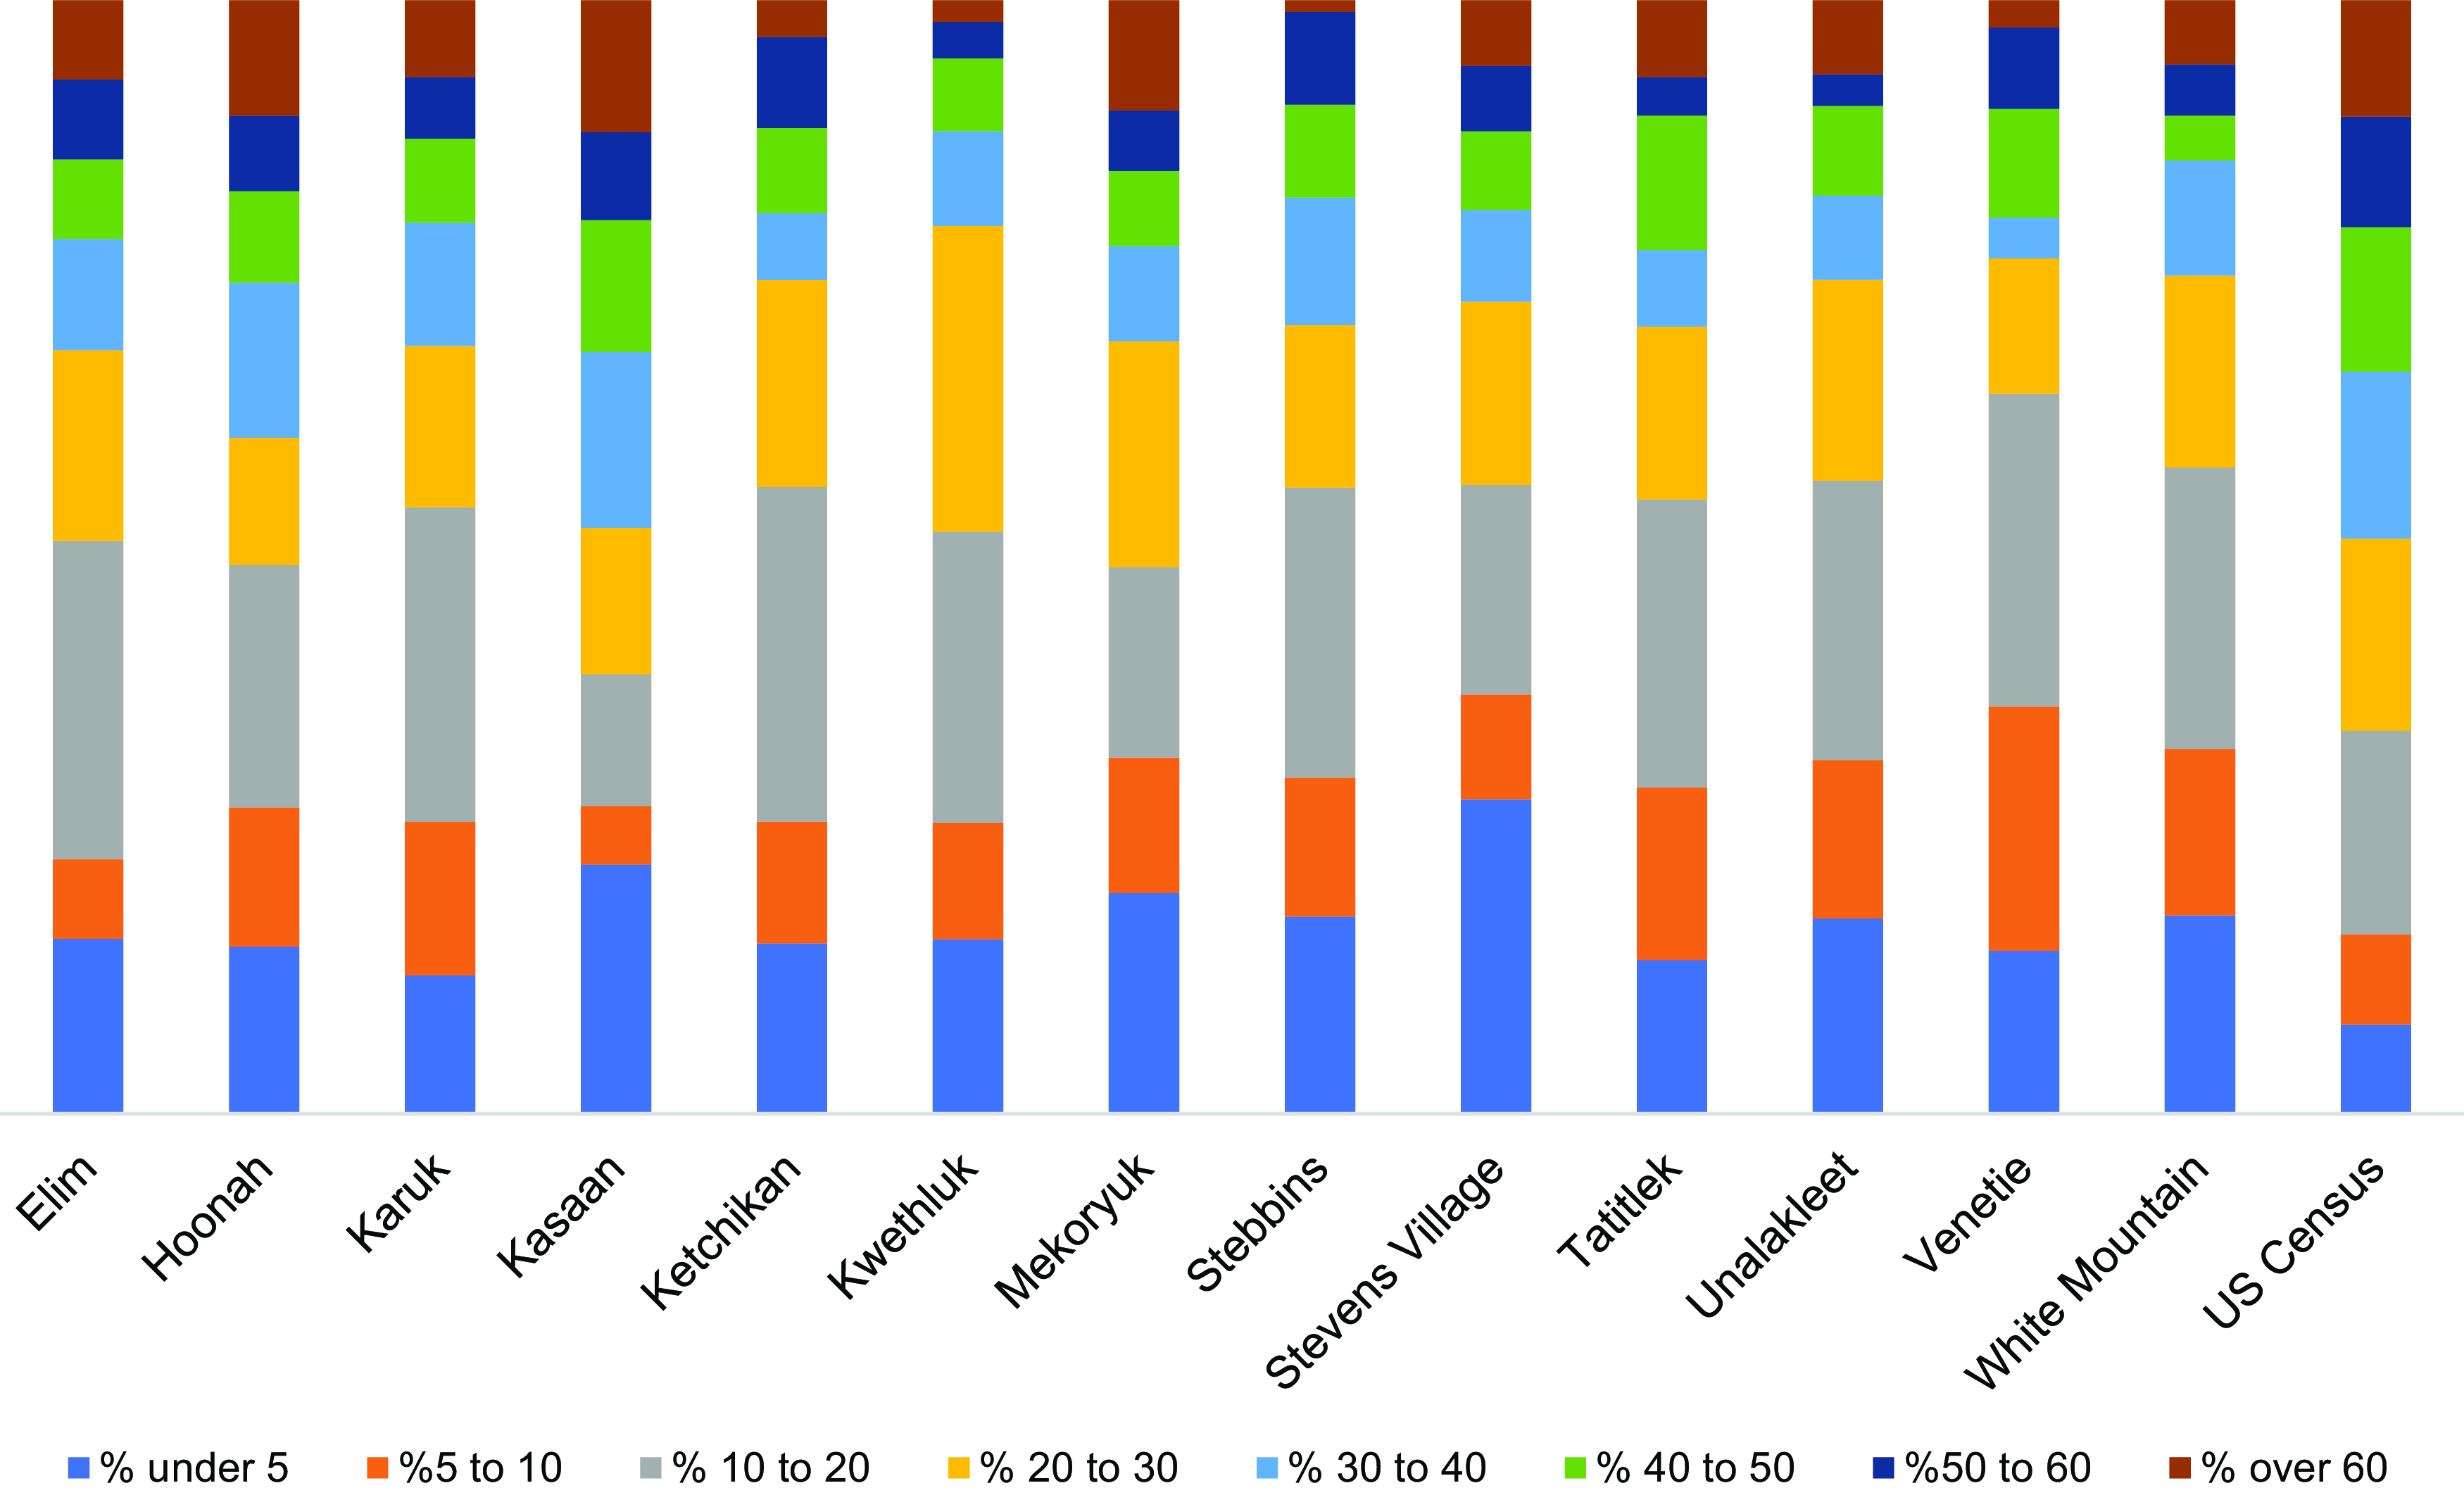
Given the role of mining and pelagic fishery industries, it is perhaps not surprising that the overall 1940 US Census sex ratio in Alaska was skewed male (55 percent). What is surprising is that across all the surveyed villages, the ratio of indigenous men to women is also skewed male – from 51.2 percent in Venetie to 61.2 percent male in Stevens Village.Footnote 32 This might be measuring disproportionately high non-white maternal mortality; unfortunately, there are no registered vital statistics data for Alaska prior to 1960. Also, relative to the 1940 US Census age composition, surveyed households are less represented in all age categories over 30 years of age. In other words, these villages were younger than the average for the US population perhaps only because they had fewer older inhabitants.Footnote 33 The age profile by village and the 1940 US Census population is shown in Fig. 2. The survey noted non-Indigenous members of a household. For example, there were one white and two Filipinos in Hoonan households and two whites in Kasaan, both villages on the Alaska panhandle and closer to the main urban area of Juneau. For Kwethluk, Mekoryuk, and Stebbins, the survey takers in those villages noted that each was wholly Eskimo (Inupiat) and that Tatitlek was wholly Aleut.
Age profile by village from survey bins and US Census 1940.
Source: See Map 1 and US Census 1940. The bins from the US Census were reformatted to agree with the Survey bins with people being uniformly allocated across the age range.

Durable assets
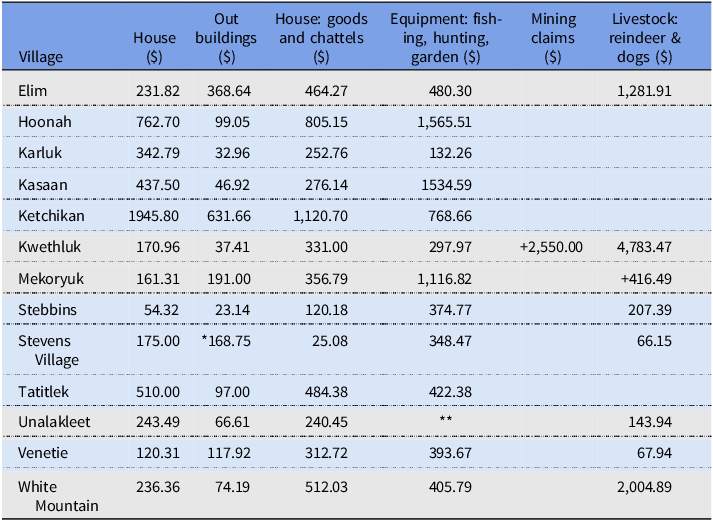
What makes these surveys valuable is the detailed information on stock of assets. Durable assets list housing, outbuildings, household goods and chattels, equipment (fishing, hunting, and gardening), mining claims, and livestock (reindeer and/or dogs). Within each category, the survey gives the number and value along with a total value for each category by household. We hand-entered the survey into a spreadsheet and checked row and column totals against row and column totals on the survey. The level of accuracy of the survey was extremely high. We found few differences between the survey totals and our spreadsheet summations.Footnote 34 Rather than present the data in each asset class for each of the households, we give average household durable asset value by village measuring across those households with positive assets in a category.Footnote 35 Obviously, the village average hides variation across households within a village but it does allow for comparison across village/households.
For non-reindeer-owning households, housing was the major asset. Houses were owner-occupied and renting very uncommon and noted. Three of fifty-five households in Hoonah were renting and one household lived on a boat; in Ketchikan, ten of thirty-four households rented, which may reflect its location on the panhandle.Footnote 36 The survey also reported on the type, quality, and value of the housing stock and of outbuildings, specifying construction material, dimensions of the house, number of rooms, as well as condition as determined by the survey taker.Footnote 37 Following the description of the house, the survey reported on the number and value of outbuildings, their purpose, the size of the garden and sanitary condition of the grounds. It also included a column for second houses owned. Seven families in Hoonah owned a second house: three located in Hoonah, one in Juneau, and one in Sitka. Population dynamics on the panhandle no doubt provided a transitory population of renters.Footnote 38
Houses were small, comprising one to two rooms on average, and about 400 square feet but with variance both within and across villages. Hoonah has the largest average square footage at 567 and Mekoryuk the smallest at 270 square feet. Taking Karluk as an example, one house was very small – 168 square feet – but another was 800 square feet. As might be expected, there is a positive correlation between the number of household members and the size of the dwelling. Commensurate with their size and location, house values were low, especially relative to the median US house value of $2,938 ($64,500 in 2024 dollars). Average values are reported in column 2 of Table 3. The average in all but two villages was below $500; Hoonan was $762.70 and Ketchikan $1,945.80 ($42,700 in 2024 dollars) closest to the US median, again no doubt due to location. Most households had at least one outbuilding whose use was given as toilet, smokehouse, boathouse, shed, cache or fish cache, or barn, but predominantly comprised toilets, storage, and smoking sheds. Average asset values by class are given in Table 3.
Average asset value by class and village for households reporting values

Source: See text and Map 1.
Village households without an entry are not included rather than entered as a zero. The values represent the mean for only those households for whom the survey noted a value. An average across all households would be lower.
Ketchikan has one property (house and outbuildings) valued three times higher than the next highest-valued property.
*No value given for outbuildings for over half of the households in Stevens Village.
**No equipment figures available for Unalakleet.
+Only two households in Mekoryuk owned reindeer.
+Two households in Kwethluk declared three high-valued mining claims.
Villages with reindeer are highlighted in gray.
In detail generally seen only in a probate inventory, the surveys give an itemized list by number and value for household goods and chattels. Listed are stoves, sewing machines, radios and phonographs, washing machines, tables, chairs, benches, beds, cupboards, bedding, rugs, pictures, clothing, rugs, dishes, silverware, and jewelry. The village with the highest average value per household was Ketchikan with $1,102.70 per household (see Table 3, column 3).Footnote 39 Stoves, washing machines, sewing machines, radios, and phonographs would all have had to be purchased, new or second-hand, and must surely have reduced the arduousness of women’s work.
Outdoor equipment lists durable capital goods such as engines and chargers, saws, boats (sail, power, rowing), sleds, rifles and shotguns, animal traps, fishnets, fishing tackle, seines, tents, boots, and snowshoes, with average value given in column 4 of Table 3. The importance of these capital goods is reflected in the fact that average value of outdoor equipment exceeds that for buildings, household durables, and personal property. Average value was highest in Hoonah at $1,565.51 and lowest in Karluk at $132.26. The outdoor durable category represented the largest asset by source over all communities and reflected the work tools for fishing, hunting, and trapping. As with household durables, animal traps, rifles, or engines had to be acquired commercially or on the second-hand market. One village, Kwethluk, held mining claims: two families declared three mining claims valued at over $2,500. Although the survey taker noted these claims, he left them out of his aggregation of total assets, implying that he did not believe these were valid claims or disbelieved the assertion of ownership. We have included them in our estimations because there is no reason under federal law why an Indigenous family could not hold mining claims.
The livestock questions capture reindeer ownership. Livestock on the survey is separated into four categories: reindeer, dogs, chickens, and geese, by number and value. One household in Hoonah had some chickens and one goose; in Karluk, there were a few cows; and in Venetie one moose.Footnote 40 Thus livestock ownership essentially consisted of reindeer and dogs. Dogs were and are valuable assets being used or sold as trained sled dogs, or eaten when necessary.Footnote 41 Male dogs in Kwethluk were valued between $10 and $25 per dog: Kwethluk $10 to $20; Stebbins $10 to $25; Unalakleet $10 to $15.Footnote 42 In Mekoryuk both male and female dogs were $5 per animal and $10 in Stevens Village.
Reindeer are listed in surveys for Elim, Kwethluk, Mekoryuk, Unalakleet, and White Mountain and valued between $5 and $10 per animal, though not all families in these communities owned reindeer. Reindeer could be used for transportation if the animal was trained from an early age to pull a sled, though less effective than dogs over icy terrain. More importantly, reindeer were a source of hides for clothing, such as parkas, and meat for families and dogs. The average value for communities with dogs and reindeer is given in column 7 of Table 3.Footnote 43 Clearly, reindeer and dogs were valuable assets and ones, along with all capital assets, which could be monetized through sale or used as collateral – although reindeer could not be sold to non-Indigenous.
Households held assets of varying amounts. Most owned their homes, even if small. Outdoor durable goods were the most important family assets, and reindeer and dogs were important for those households and communities that owned them. The value of fishing and hunting equipment dominated for non-reindeer-owning households. These were assets that allowed for both traditional subsistence/bush activities and for market activities. Frank Tough (Reference Tough1996:43) argued for that for native communities in Northern Manitoba “bush activities defy neat classification because often a single task could simultaneously generate commercial and subsistence returns.” These surveys, however, sought to capture this simultaneity, providing detailed information on household consumption and market activity, as we discuss below.
Value of income flows
Durable goods categories tell us what households own. By asking about income by source, the survey paints a picture of how households used their assets and labor. The survey questions relate to home production/consumption, sale of assets or consumer durables, wages earned from market work, and income from pensions and relief. The survey also asked for the value of goods-on-hand available for future consumption or sale. The categories given under home production/sale were arts and crafts and pelts, garden produce, and fish and seafood.
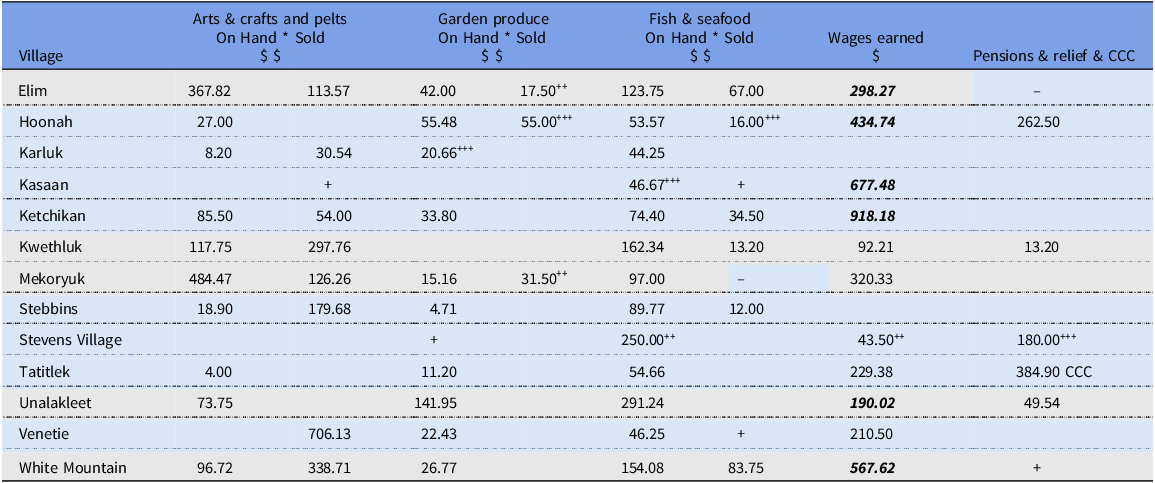
No village had zero market income, though the source of that income differed across villages and even from household to household within a community. Comparisons are further complicated because villages were surveyed at different months in the seasonal round; some in winter and others in summer. Table 4 gives our best representation of the data. In keeping with Table 3, Table 4 lists average income by village by source, but this table needs to be read carefully. Again, these entries are not the average across all households in the village but the average only for those households reporting a positive value in that category. The village average in every category would be lower, and considerably lower in some villages if many households had zero income in a category. Using a village average with zeros, we argue, gives a misleading view of market interaction, but we do note when only one or two households reported income or goods on hand.Footnote 44 Essentially, Table 4 can be read as saying that most households had some market income. By and large, little income was earned from market sales of traditional products; their value lay in home consumption.Footnote 45 For arts and crafts, pelts, garden produce, and fish and seafood, we show the value on hand and the value of goods sold. What is noticeably missing is a separate meat category. Though oral histories describe eating reindeer, the surveys would suggest that the value was not the meat per se but rather the hides, with the meat being used for dogs. Indeed, the pelts of fawns were particularly valuable for clothing.
Average village value of goods on hand and income from market sales and wages earned for households reporting values

Source: See text and Map 1. Appendix giving the detailed listing of items available from authors.
The village average includes only those households with a positive value.
In the wages earned column, bold denotes villages where over 95 percent of households had positive values.
*On hand gives the value of items still available for sale or home consumption.
+In each case, only one household listed: $18 for arts & crafts and pelts; $24 in fish & seafood; $50 in pensions, relief, or CCC.
++Only two households with a value.
+++Only three households with a value.
Arts & crafts and pelts combine two very different activities. Pelts refer to animal skins, such as red fox, trapped for sale. Arts & crafts refer to the making of items such as parkas, moccasins, and gloves but include much more, both artistic and for daily use: baskets, walrus ivory carving, boots, totems, pottery, rugs, and blankets. Parkas, moccasins, and gloves were no doubt primarily consumed by household members but could also be sold.Footnote 46 Although we can disentangle arts and crafts from pelts on a number of the surveys, we cannot do so for all. Therefore, Table 4 reports the combined data as given on the surveys. Venetie, high up the Yukon, had a thriving business in the sale of expensive pelts; the total value of pelts sold was $10,592 across 15 of the 18 families (or $232,000 in 2024 dollars), which is significantly more important than the value of their houses (Table 3).
In columns 3 and 4 of Table 4, we report on the value of goods on hand and sales income from garden produce and fish & seafood. Very few households sold garden produce or fish & seafood. The importance of these products lay in household consumption. In terms of garden produce, families collected tens of pounds of berries and greens: dock leaves, specifically mentioned, are, like spinach, a very good source of oxalic acid. Indeed, the survey taker for Stebbins noted that “nineteen of the twenty-two families of Stebbins gathered greens (willow leaves, buds and some species of wild rhubarb) and berries, another indication of the fine energetic character of these Eskimo people.” He went on to write, “It is fully believed that with some instruction, seed supply, a pressure cooker and encouragement, the people would grow vegetables and gather other foods for home use.”Footnote 47 Indeed, he probably would not have noticed existing gardens, because for many non-Indigenous, they did not look neat enough. Most were left overgrown or, depending on the timing of animal migrations or snows, left untended for a year. Of course, climate circumscribed what would grow in the short growing season mainly to turnips, potatoes, and lettuce.
Most of the villages are coastal and, although salmon dominated – fresh, smoked, dried, salted, and canned – a large range of seafood was consumed: cod, crabs, herring, seal, halibut, fish eggs, clams, mussels in huge amounts, and, in Stebbins, whale.Footnote 48 In Mekoryuk, dried seal dominated with a catch listed at 126,600 lbs., though at the time of the survey, February, the community had only 20,420 lbs. on hand. The village also claimed 18,000 lbs. of clams. Only one family in the survey lists caribou meat. While not noted in Table 4, two villages had income from the sale of livestock; Elim earned an average of $3.18 from the sale of reindeer, while Stebbins earned $138 from the sale of dogs.
Fish, seafood, and garden produce, and even the arts, crafts, and pelts categories represent traditional, subsistence, or bush activities. Despite the limitations of the survey, it is clear that none of these villages had any subsistence issues. There were significant supplies of food and materials for clothing. At the same time, each household required some income or market interactions to acquire the capital assets needed to pursue their fishing, trapping, and hunting activities. The final two columns of Table 4 show income earned in the survey year from wages (column 5) or as pensions and relief and Cvilian Conservation Corps (CCC) (column 6). Only Karluk and Stebbins had no wage income recorded in the survey. For the six villages shown in bold, over 95 percent of the households had wage income.
Wage income came from a range of sources. Canning and fishing were most important in Hoonah, Kasaan, and Ketchikan – the three communities on the panhandle – with an average per household of $435, $677, and $918, respectively. Wages were also earned in boat building, transportation services, carrying mail, and cutting wood. Clearly, household members used the opportunities available. Column 6 gives income from pensions and relief. Four villages had pension or relief income but unfortunately, the survey does not delineate the source. New Deal activities were quite limited in Alaska, but ten of thirteen families in Tatitlek worked on a trail and bridge project for the CCC from January to November 1938 for an average income of $385. In general, the seasonal nature of much of the income-earning work was compatible with traditional hunting and fishing practices. No village had income from mining. The main message is that by 1940, all villages had incorporated some market-based income-earning opportunities into their economic activity.
Liabilities
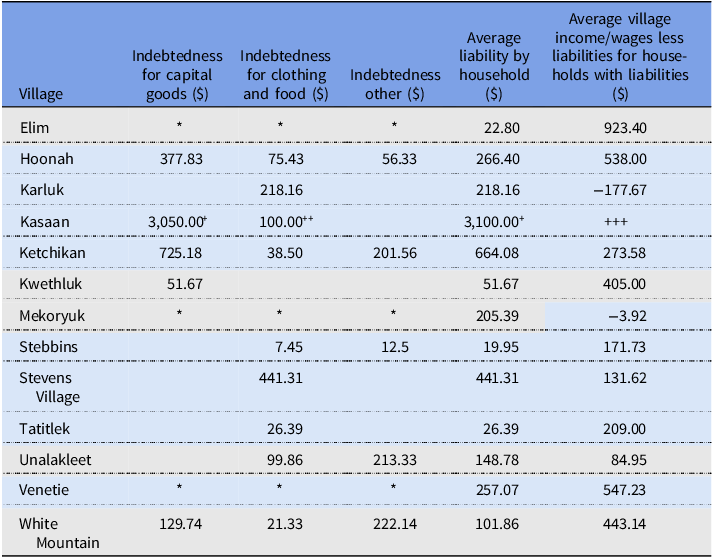
That all these villages had capital assets and market income does not mean that they were financially solvent. They could have been indebted to local stores or companies for consumption or capital goods purchases. Fortunately, the survey does provide some information on liabilities but, in contrast to other components, the delineation is coarse, listing only three sources of indebtedness: indebtedness for capital goods; indebtedness for clothing and food; and “other” indebtedness. The survey does not report to whom households were indebted. On some surveys, the survey taker listed only the total liability by household and, in one case, only total liabilities for the village. What we know of the structure of liabilities is shown in Table 5, which shows average liabilities by village, again only measured across indebted households. For comparison, the average indebtedness for all thirteen communities was only $61.70 for capital goods and $49.35 for clothing and food.
Average village liabilities by source for households reporting liabilities

Source: See Text and Map 1.
Village averages include only those households with liabilities.
Villages with Reindeer are highlighted in gray.
*Survey lists only total liability for the village.
+Only two households with liabilities but only one has a negative cash flow.
++Only one household with indebtedness.
+++Not calculated given the large expense by the one family’s boat purchase.
Indebtedness is not so much that a particular amount owed was low or high, but the extent to which households were able to finance their debts. Because we know nothing about the maturity of the debts – for example, whether they were due in the year or had a longer maturity – we can say little about liquidity per se, but we can ask about solvency. Because we know the asset, income, and wage profiles for each family in the survey year and their liabilities, we ask whether families could cover their debts from annual income or wages or from sale of assets.
A comparison of the value of average asset holdings in Table 3 with liabilities in Table 5 suggests that most families had assets large enough to cover liabilities. They had positive net worth comparing their debt-to-asset ratios. Of course, selling assets to cover liabilities would mean selling equipment and tools that were used to provide for home production, consumption, and market sales and so, while covering debts in the short term, such a strategy has consequences for future income streams. We think it more meaningful to compare average income and wages to average liabilities and ask if families were solvent in that they could cover debts from annual income. Income net of liabilities is shown in column 6 of Table 5. Measured across only those families with liabilities, we find the majority of households were solvent.
Four villages stand out. Mekoryuk had income net of liabilities of –$3.92 in the survey year which, while negative, is miniscule. Karluk had a negative balance of –$177.67. Karluk listed no wage income, pension, or relief income and very low market sales of arts & crafts and pelts against which to pay debts owning.Footnote 49 In Karluk, however, the value of assets (Table 3) was more than sufficient to cover the liabilities owing. Kasaan is a special case where one family had a $6,000 debt from the purchase of a boat but had wages and income of only $1,200. The family, however, had total assets valued at $12,175.Footnote 50 Using an interest rate of 5 percent, annual income and wages could cover an annual interest charge of $300. Tatitlek demonstrates a willingness to switch into a one-year income-generating opportunity – CCC – when the opportunity arose.
In the next section, we look more closely at one particular valuable asset – reindeer. As noted earlier, this was a voluntary program put in place to substitute for the change in Caribou migration patterns in the early twentieth century across the Seward Peninsula and further south. Because no community or household was required to take part, we explore whether household or community choices differed in any meaningful way by 1940 between those households/communities that incorporated reindeer in early 1900 from those that did not.Footnote 51
Methodology
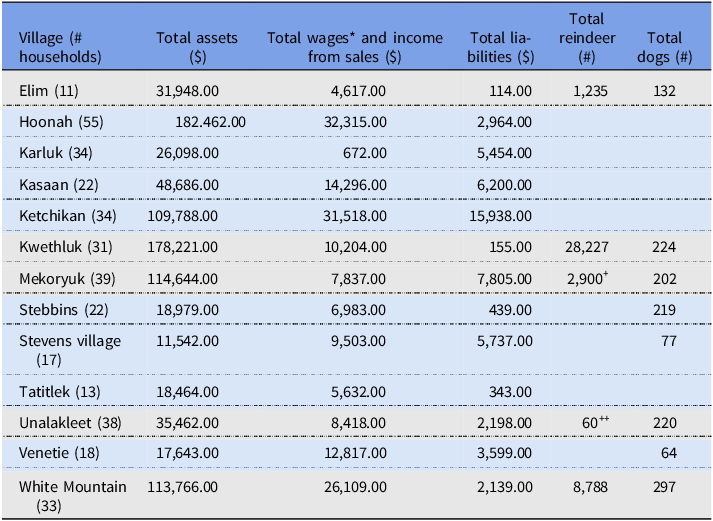
The previous section described the average village position of household income, assets, and liabilities for those households with non-zero entries in the survey. In Table 6, we showed the total value of assets, income, and liabilities by village along with the number of reindeer and dogs by village. The number of households in each village is given in parenthesis in column 1. Variation in village size and location explains part of the differences in total assets. Communities with more households have more assets, but the number of reindeer also seems to be important. In this section, we formally ask whether households/communities that incorporated reindeer have outcomes in 1940 that differ from households and communities that did not.
Total assets, income, liabilities, and livestock numbers by village

Source: See Text and Map 1.
*Income from all sales and wages includes pension, relief, and CCC.
+Owned by one family.
++Owned by two families.
We first compare the income, assets, and liabilities of households in villages owning reindeer to the income, assets, and liabilities of households in villages that did not have reindeer by estimating of equation (1):
 $${y_i} = \beta {X_i} + \alpha 1{\left( {Presence{\rm{\;}}of{\rm{\;}}reindeer} \right)_v} + {\varepsilon _i}$$
where
 $i{\rm{\;}}$
indicates a household within village
 $v$
.
 ${X_i}$
contains household-level characteristics measuring family size, the number of working-age adults, and sex distribution. The coefficient of interest,
 $\;\alpha $
, indicates the effect of living in a village with reindeer, and
 $1\left( {Presence{\rm{\;}}of{\rm{\;}}reindeer} \right)$
is an indicator function equal to one if there are any reindeer-owning households in a village and zero otherwise. We run separate specifications in which the dependent variable is household income, household assets, household assets net livestock assets, or household liabilities. A dummy variable equal to one if the village owns reindeer (instead of at the household level) reflects the village-wide benefits from belonging to a herding village such as a sharing of meat and employment opportunities. In all specifications, we cluster the standard errors at the village level to account for unobservable factors affecting our outcome measures that may be correlated within a village. If we assume independence, we will likely underestimate the OLS standard errors and over-reject the null hypotheses of no significant relationship. A standard correction for within-group dependence is to cluster by group.
Identification of
 $\alpha $
is achieved from variation in whether or not households in the village owned reindeer. Selection at the village and household level is undoubtedly not exogenous, so our results should not be interpreted as causal. We recognize that there might be some unobserved characteristics that led a household to select into the apprenticeship program and to own reindeer.Footnote
52
Senate Reports by Jackson reveal some details of the early operation of the program.Footnote
53
If we believe that apprentices (or reindeer-owning households and villages with reindeer) were positively selected, then unobserved ability in the regression would be positively correlated with income (negatively correlated with debt) and if we assume that reindeer herding was positively correlated with income (negatively correlated with debt), then our estimate of
 $\alpha $
is overstated. We do not argue for causality; rather, that our results are a test of differences in underlying environments.
We also examine whether reindeer-owning households have outcomes different to those households without reindeer by estimating equation (2):
 $${y_i} = \beta {X_i} + \alpha 1{\left( {Household{\rm{\;}}has{\rm{\;}}Reindeer} \right)_i} + {\varepsilon _i}.$$
In this specification, the indicator function
 $1{\left( {Household{\rm{\;}}has{\rm{\;}}Reindeer} \right)_i}$
is equal to one if a household reports ownership of reindeer and zero is no ownership of reindeer is reported. Again, we do not believe that households were randomly selected into reindeer ownership and so estimates of
 $\alpha $
are correlational not causal.
Finally, to determine whether more reindeer present in a village affects economic outcomes, we estimate (3):
 $${y_i} = \beta {X_i} + \alpha 1{\left( {Per{\rm{\;}}Capita{\rm{\;}}Number{\rm{\;}}of{\rm{\;}}Reindeer} \right)_v} + {\varepsilon _i}.$$
In this specification,
 $\alpha $
captures the effect of having more reindeer per capita on household economic outcomes. Unlike the first specification, the issue of endogeneity is less clear than in the use of a household and a per-capita measure of reindeer as in equations (2) and (3). It might be the case that reindeer ownership and herd size is dependent on unobserved family traits, such as motivation, that concurrently determine household income and other outcomes. Additionally, because growth of reindeer herds depended on the number of fawns produced within the herd, the amount of time a herder spent with the reindeer could affect the size of the herd. On the other hand, reindeer herd size is arguably as much a function of weather, predation, and the subsistence needs of the village (largely a function of village population). Therefore, variation in per-capita reindeer may be plausibly exogenous.
Results
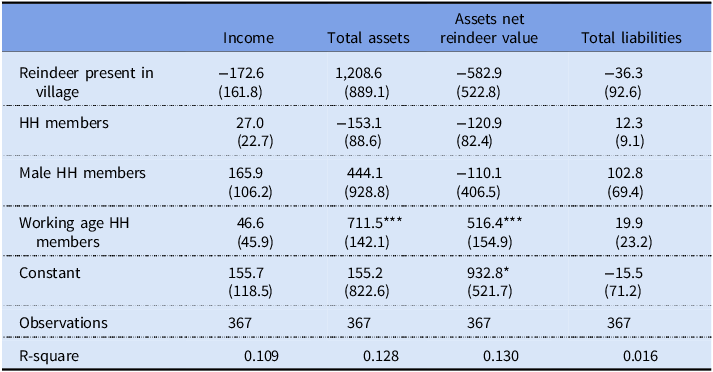
We present the OLS estimation for each estimating equation examining the impact of the independent variables on income, total assets, assets net of reindeer, and total liabilities. Table 7 reports the estimation results for the presence of reindeer in a village (equation 1) or what we consider the extensive margin.
Presence of reindeer in a village on household income, assets, and liabilities

Clustered errors in parentheses.
***99%; **95%; *90%.
The OLS estimation says that the presence of reindeer in a village is positively related to higher assets, which we would expect given the number of reindeer are a direct input in total assets. Of course, asset variables are also related to the number of working-age household members. At the same time, the estimation finds lower income, lower assets net of reindeer, and lower total liabilities, on average, where reindeer herding is practiced, perhaps suggesting less market-related work. The OLS estimates reveal that reindeer herding in a village is associated with $1,209 more in total assets (including the value of reindeer) but $583 less in other assets net the value of reindeer on average, but the results are not statistically significant. Indeed, none of these results are significant, implying no statistical difference between villages with reindeer and those without.
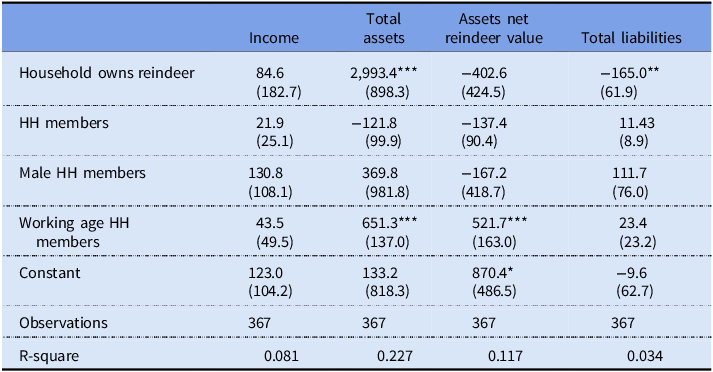
We next report results for the impact on income, assets, and liabilities for whether a household (rather than a village) has reindeer (Table 8). From the OLS estimates, we find that households with reindeer had higher total assets, but lower assets net of reindeer and lower liabilities. These estimates show a small, positive effect on income for households owning reindeer, but the result is not statistically significant. Only the estimate of total assets and total liabilities are statistically significant. These estimates show that a household with reindeer had nearly $3,000 more in assets than a household without. At the same time, households with reindeer had $165 less in liabilities than households without.
Household reindeer ownership and household income, assets, and liabilities

Clustered errors in parentheses.
***99%; **95%; *90%.
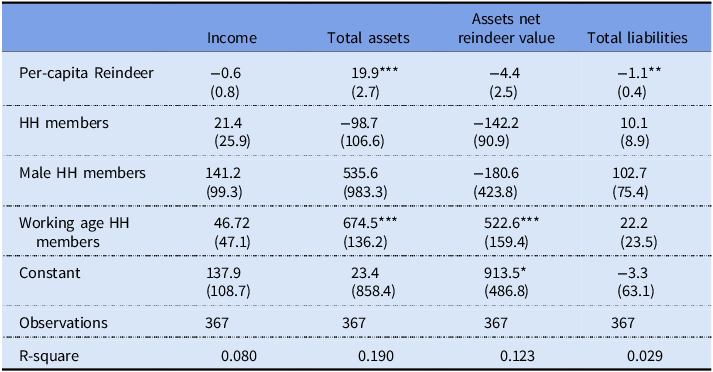
Estimates using per-capita reindeer instead of an indicator variable are provided in Table 9. Because we are using per-capita reindeer, the point estimates are smaller, but we find that reindeer are negatively associated with income and net assets as well as lower liabilities.
Per-capita reindeer and household income, assets, and liabilities

Clustered errors in parentheses.
***99%; **95%; *90%.
In unreported tables, available on demand, we run the same regression but taking the natural log of wages, assets, and liabilities, which reduce the sample size to those households with a non-zero wage, asset, and liability values. We also examined results from a Tobit model that clusters by village and allows for censored values such as those we see for households with zero wages, assets, and liabilities. These models produce results that are largely consistent with our OLS results in terms of magnitude and sign of the relationship between the three measures of reindeer presence and the economic measures.
In sum, the results basically say that there was little to differentiate reindeer-owning villages and non-reindeer-owning villages and households except in one dimension. Reindeer owning is correlated with statistically significantly lower debt. That such villages also have lower assets net of reindeer is unsurprising given the value of reindeer holdings. Holding fewer other assets and fewer liabilities are related, meaning these villages have little diversity in relation to a negative reindeer shock. More importantly, by the end of the Great Depression, and on the eve of World War II, these Indigenous communities were financially and economically robust.
Discussion
Traditional hunter/gatherer communities are often implicitly or even explicitly considered as less developed than agricultural or manufacturing communities. Indeed, the dominant ideology within the US government in the late nineteenth and early twentieth century was to force economic and cultural change through a shift to allotment and family-owned farms away from communal ownership. At the same time, educational policies such as boarding schools forbade indigenous languages, dress, and cultures. Although Sheldon Jackson, the Agent General in Alaska from 1888 to 1907, saw reindeer herding as a move into pastoralism and away from foraging, unlike allotment, a shift into reindeer herding was a voluntary and not an enforced policy. The surveys conducted at the end of the 1930s and used in this study provide some insight to choices made by thirteen communities with respect to traditional activities, reindeer herding, self-sufficiency, and market opportunities.
The surveys show that hunting, gathering, and fishing remained central to the food security of each of the communities surveyed. There is no evidence that these communities were food insecure in 1940, contrary to the situation for some communities today (Stevenson et al. Reference Stevenson, Alessa, Kliskey, Rader, Pantoja and Clark2014). At the same time, these communities were not tied to a purely traditional lifeway but appear open to any available opportunities. Engagement in the market economy, whether through wage labor, sale of arts & crafts or pelts, or independent commercial fishing allowed households to purchase the investment goods necessary to enhance productivity in hunting and fishing: metal traps, rifles and shot, boats, or outboard motors and fuel. Women, as women throughout the US, took equal advantage of the opportunities to reduce the physical toil of home production with stoves, washing machines, and sewing machines. Reducing the hours needed for household tasks could increase time for leisure, for production of arts & crafts for market sale, or for longer working hours at the cannery. An equally important finding from the descriptive statistics relates to financial solvency. These households and communities used the market for the income needed to purchase household and work durables, however, none of these households were indebted. None were bankrupt and none were insolvent or illiquid, meaning future actions would not be dictated by current debt.
The surveys are a unique window on Indigenous households and communities. There are commonalities across all the households surveyed. Although not wealthy households, the vast majority owned their own houses. In monetary terms, the value of housing assets is lower than the value of houses in the more densely populated contiguous states is not surprising. At the same time, smaller houses, many without indoor plumbing, might not have been very different from anywhere in rural America. Food supplies were plentiful, as seen in the pounds of fish caught and cached for the winter months.
Indigenous households operated both within a subsistence/bush world and a market economy. These communities had the luxury to choose the aspects of each that worked for their households and communities and with the season of the year, in large measure because they were not constrained as were many Indigenous households who lived on reservations or trust lands in the contiguous United States. Although the main finding of the article is that none of these households were indebted or insolvent, the balance between indebtedness and not is a fragile relationship dependent on the earning capacity relative to the costs of market goods. If wage opportunities declined or disappeared or wages rose more slowly relative to the prices of manufactured goods, households might find it difficult to pay for diesel fuel to run outboard motors or pay down loans on boat purchases. But overall in 1940, Alaska’s Indigenous communities as shown through these surveys were resilient and robust.
Acknowledgements
This paper was presented at the Workshop on Territory, Culture, and Indigenous Ecology, Hoover Institution, May 2022. We are grateful for the comments made by workshop participants and those provided by the reviewers and editors of this journal.