1 Introduction
The Totonacan language family (formerly Totonac-Tepehua) is one of the largest language families in Mesoamerica spoken by roughly 240,000 people (INEGI 2010). While the exact number of Totonacan languages is unknown, to date many Totonacan language varieties remain un-described and unanalyzed. The present study provides a description of the acoustic properties of vowels in Upper Necaxa Totonac (UNT), a member of the Northern branch of the Totonacan language family. We investigate the five-vowel system with contrastive length and laryngealization in relation to F1 and F2, duration, and fundamental frequency (f0) in UNT. We further test the claims Beck (Reference Beck2004) makes on the phonetic correlates of stress on vowels based on his auditory perception of the sound system, namely that (i) stressed vowels have increased duration, (ii) stressed short vowels have the same duration as long vowels, and (iii) stressed long vowels are not consistently longer than unstressed long vowels. The results demonstrate that claims (i) and (iii) are supported by acoustic measurements, and that slight differences in vowel quality in addition to increased duration is a significant predictor of stress in UNT. This difference in vowel quality and lengthening in prosodic contexts is only found with short stressed vowels but not stressed long vowels, an observation that has been termed target undershoot in Lindblom (Reference Lindblom1963) as a result of time constraints on vowel transitions. Complex interactions between syllable position and vowel length were also investigated and indicates that syllable-initial and syllable-final positions were predictors of increased vowel duration though positional effects became weaker with every repetition.
Acoustic analysis of the Upper Necaxa Totonac vowel system adds to typological descriptions that have demonstrated the phonetic correlates of vowel quality, quantity, and stress vary among languages. Where some acoustic studies have described vowel length as a property marked primarily by a quantity difference (Kari Reference Kari1990, Holton Reference Holton2000), other studies connect vowel length to distinctions in quantity and quality (Henderson Reference Henderson1967, Muehlbauer Reference Muehlbauer2012), or as affected by other cues like formant transitions and syllable positions (Lehnert-LeHouillier Reference Lehnert-LeHouillier2010). These distinctions in formant structure might apply to only a subset of vowels correlated with vowel length or height (Tuttle, Lovick & Núñez-Ortiz Reference Tuttle, Lovick and Núñez-Ortiz2011). Gordon (Reference Gordon1998) and Gordon & Ladefoged (Reference Gordon and Ladefoged2001) suggest that duration and formant patterns of vowels are often affected by non-modal phonation, and that non-modal vowels are generally less salient characterized by reduced acoustic intensity and loudness. In Kirk, Ladefoged & Ladefoged (Reference Kirk, Ladefoged, Ladefoged, Mattina and Montler1993), non-modal vowels were described as phonetically much longer than their modal counterpart. In terms of stress, studies since work by Fry (Reference Fry1955, Reference Fry1958) have shown that while the most effective property for cueing stress is duration, other factors such as intensity and fundamental frequency play a role. Studies have also found that lengthening effects are correlated with certain positions and prosodic domains used to mark phonological junctures or phrasal boundaries (Wightman et al. Reference Wightman, Shattuck-Hufnagel, Ostendorf and Price1992; Tuttle Reference Tuttle1998, Reference Tuttle, Hargus and Rice2005). The present study contributes to these investigations on the phonetic correlates of vowel length and stress, and analyzes the role of laryngealization on vowel quality and quantity and its relation to syllable position.
The literature on the phonetics and phonology of Totonacan languages is relatively sparse, the majority focusing on phonological descriptions based on researchers’ perception of the sounds. Recent reconstruction efforts in Brown et al. (Reference Brown, Beck, Kondrak, Watters and Wichmann2011) were based on the phonological inventory of 18 Totonac languages, of which only seven have published grammars or dictionaries compiled by academically-trained linguists. Several phonological accounts of the sound systems in Totonacan are found in Román Lobato (Reference Román Lobato2008), McFarland (Reference McFarland2009), and MacKay & Trechsel (Reference MacKay and Trechsel2013) to name a few, where some descriptions have gone as far as suggesting perceptual correlates of stress and length, which always ignore potentially complex interactions concerning laryngealization. In Zapotitlán Totonac, long vowels are described as produced at a lower tongue position than corresponding short vowels, and short vowels as more flexible in quality varying freely with a more central position (Aschmann Reference Aschmann1946). MacKay & Trechsel (Reference MacKay and Trechsel2013) describe stress as affecting both the loudness and duration of vowels in Pisaflores Tepehua. However, acoustic analysis of the phonemic inventory of the Totonacan languages has not appeared in the literature until recently. Phonetic studies on vowel laryngealization (Misantla: Trechsel & Faber Reference Trechsel and Faber1992 (which remains unpublished); Papantla: Alarcón Reference Alarcón Montero, Zendejas and Butragueño2008, Herrera Reference Herrera Zendejas2009), the system of ejective fricatives (Upper Necaxa: Beck Reference Beck2006, Puderbaugh & Tucker Reference Puderbaugh and Tucker2013, Puderbaugh Reference Puderbaugh2015), and the acoustics of obstruents (Huehuetla: Puderbaugh Reference Puderbaugh2016) are now beginning to appear. These studies have contributed important information on the phonetic realization of the sounds in the language family. In a phonetic study of vowel modality in Papantla Totonac, Alarcón Montero (Reference Alarcón Montero, Zendejas and Butragueño2008) demonstrates that vowel neutralization of laryngealization results in homophonous forms, where minimal pairs such as / tsḭtsi / ‘warm’ and / tsḭtsḭ/ ‘grain’ are neutralized with [tsḭtsḭ]. The study further demonstrates that intervocalic consonant voicing, / stɑpṵ/ → [ stɑbṵ] ‘chaquiste’, may help distinguish potential homophony from other neutralizing items, as in / stɑpṵ/ → [ stɑpṵ] ‘bean’ (Alarcón Montero Reference Alarcón Montero, Zendejas and Butragueño2008). In Upper Necaxa Totonac, the acoustic properties of duration, center of gravity, and voice onset time were measured in the rare set of ejective fricatives in a study presented by Puderbaugh & Tucker (Reference Puderbaugh and Tucker2013). Up until now, however, descriptions of the Upper Necaxa Totonac vowel inventory have been based on auditory and perceptual observation by the field researcher, Beck (Reference Beck2004, Reference Beck2011), who describes a relatively large system of 20 vowel phonemes.
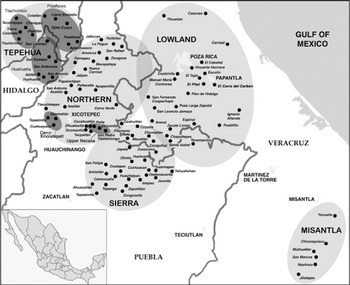
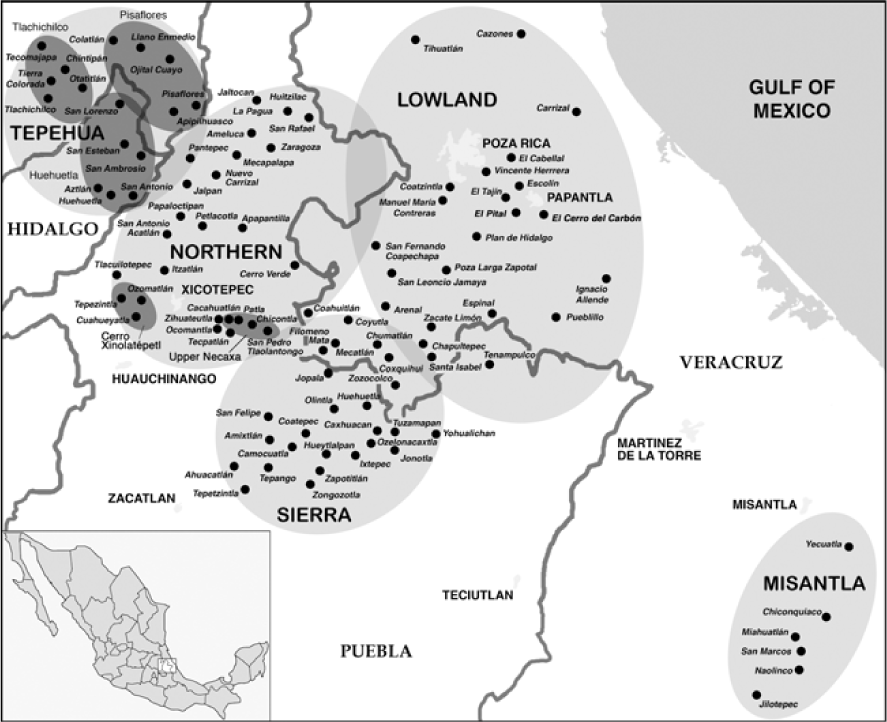
The Totonacan languages are currently spoken in east-central Mexico in the states of Puebla, Hidalgo, and Veracruz (Map in Figure 1). Upper Necaxa Totonac, part of the Northern branch of the Totonacan language family (Brown et al. Reference Brown, Beck, Kondrak, Watters and Wichmann2011), is spoken in four communities: Chicontla, Patla, San Pedro Tlaolantongo, and Cacahuatlán. The largest of the four communities is Chicontla with a population of 3305 people. The second largest and geographically closest town to Chicontla (about 2.5 km away) is Patla with 1060 people. About 16 kilometers from Patla and Chicontla are the towns of San Pedro Tlaolantongo with a population of 1004 people, and Cacahuatlán, with 247 people; the four communities are located by the dark grey shaded oval on the map in Figure 1 (courtesy of David Beck).
Location of Totonacan languages.
Not all community members in the four villages speak Totonac; it is estimated that overall there are around 3000 speakers of UNT according to the Instituto Nacional de Estadística y Geografía census results (INEGI 2010). For this study, we focused on the two largest communities of Patla and Chicontla where most community members over 40 years of age are native Totonac speakers with high to native fluency in Spanish. Some people over the age of 65 years are monolingual Totonac speakers with relatively little Spanish. Speakers, generally under 30 years, may be considered heritage language speakers of Totonac, and only a small number of children are learning the language as a mother tongue. According to Ethnologue, the variety of Totonac spoken in Patla and Chicontla is threatened (category 6b), however, we may have reason to believe the situation is more critical than has been noted (Lam & Beck Reference Beck2008; Lam Reference Lam2009, Reference Lam, Levy and Beck2012). Case studies in Lam (Reference Lam2009, Reference Lam, Levy and Beck2012) indicate that the language is closer to a state of extinction, noting that the language ideology and socio-economic opportunities associated with the national language are the primary reasons for shifting toward a more monolingual Spanish community. Particularly in Patla and Chicontla, the older generation have been purposefully blocking transmission to younger generations, who are consequently no longer learning the language.
The Totonacan languages have complex polysynthetic agglutinative morphology as is common with languages in the Meso-American sprachbund. They have been described as having variable word and constituent order that poses challenges to typological theories. At the highest level, the internal genetic structure of the Totonacan language family is divided between Totonac and Tepehua. Totonac-Tepehua vowel inventories historically have three phonemic vowel qualities /i ɑ u/ with contrastive length, where most languages in the Totonac branch make further distinctions in modal and laryngeal phonation creating an inventory of 12 vowel phonemes. In Totonac-Tepehua, with the exception of Spanish loanwords, the two mid-vowels [e] and [o] are described as allophones of /i/ and /u/. The two vowels [e] and [o] are restricted to positions surrounding uvular or glottal consonants indicating that they emerged from lowering as a result of anticipatory assimilation (Beck Reference Beck2014). However, the vowels /e/ and /o/ have obtained phonemic status in the Northern branch of the Totonac family constituting a shared innovation which distinguishes the languages of this group from the other languages in the family (Brown et al. Reference Brown, Beck, Kondrak, Watters and Wichmann2011). In Upper Necaxa, part of the Northern branch of Totonac, /e/ and /o/ occur in contexts not predicted by their conditioning environments and in contexts where length and phonation are contrastive, which expand the inventory of vowel phonemes to 20. Upper Necaxa Totonac is also notable in being one of the only known Totonacan languages to have lenited the uvular stop, /q/, to a glottal stop, /ʔ/, in all environments, where the distribution of the glottal /ʔ/ parallels that of other stop-consonants (Beck Reference Beck2006). The diachronic process of lenition affecting uvular stops is also attested in the emergence of a series of three glottalized or ejectivized fricatives. The lenition of uvulars has made Upper Necaxa phonologically quite distinct from its sister Totonacan languages.
While there is some dialectal variation between the Totonac spoken in Patla and Chicontla, both communities have the same phonological consonant and vowel inventory, stress patterns, and phonotactics (Kirchner & Varelas Reference Kirchner and Varelas2002). The differences between the language in the two communities are seen in the choice of certain lexical items in nominal reference. For instance, differences occur in the names for certain plants and animals: in Patla kukxápu′ / kukˈʃɑpṵ / is a type of fruit-bearing tree used in making fans, whereas in Chicontla the correct word for this plant is a′kxápu′/ɑ̰kˈʃɑpṵ /. There are also some common phonological reductions that are particular to the Patla dialect, such as tawilá/ tawiˈlɑ/ > to:lá/toːˈla/ ‘sit down’, Ihawá/ɬɑˈwɑ/ > Iho:/ɬoː/ ‘make something’, tayá/ tɑˈjɑ/ > te:/ teː/ ‘take something’ (Beck Reference Beck2011). The only other distinctions that have been noted between the two communities are found in the choice of causative morpheme ma′ha-/ mɑ̰ʔɑ-/ or ma:- -ni′/ mɑː- - nḭ / in a limited set of verb stems (Beck Reference Beck2011). Of the 93 words that were used in this study, there were only five lexical items that varied from one community to the other as noted in the wordlist in the appendix.
1.1 Consonants
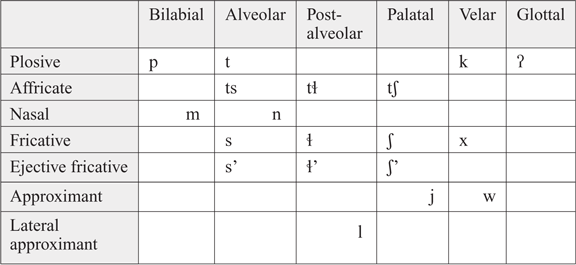
Aside from the typologically rare ejective fricatives, /s’ ɬ’ ʃ’ /, the Upper Necaxa Totonac consonant system is fairly typical of the language family. The consonant system has a typical series of voiceless obstruents that do not have contrastive voiced counterparts. Stops, affricates, and fricatives are parallel in places of articulation. Upper Necaxa Totonac also has a series of two nasals, and three approximants as indicated in Table 1.
Upper Necaxa Totonac consonant inventory.

1.2 Vowels
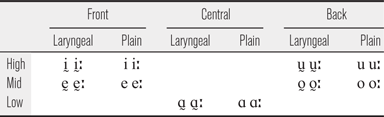
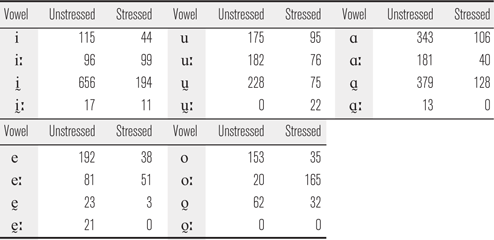
The vowel system exhibits contrasting sets of short and long vowels and plain and laryngealized vowels within a system of five vowel qualities /i e ɑ o u/. The contrast between plain, laryngealized, long and short vowels in Upper Necaxa can be observed in the minimal pairs, chi′/ tʃḭ / ‘how?’, chi:′/ tʃḭː/ ‘tie something’, chi′chi′/ˈtʃḭtʃḭ / ‘hot’ and chichi′ / tʃḭˈtʃḭ / ‘dog’. Minimal pairs, or near minimal pairs, in citation form suggest that the contrast between length and laryngealization is phonemic. The various combinations of vowel length and phonation type are exemplified in Table 2.
Upper Necaxa Totonac vowel inventory.

All the vowel types are found in initial, final, and medial positions. The mid-vowels appear less frequent and most often occur in Spanish loan words and adjacent to glottal consonants. However, there are sufficient examples where these vowels appear outside of conditioning environments to demonstrate that they are distinct phonemes, e.g. cho:lhchó:lh/ tʃoːɬˈtʃoːɬ/ ‘cricket’ and te:taxtú/ teːtɑʃˈtu/ ‘come out’ (see the wordlist in the Appendix).
The 20 phonemic vowels also appear in stressed and unstressed environments. Stress in UNT plays a grammatical function as it is correlated with a shift in the lexical class of an item and may indicate certain aspectual distinctions. Stress patterns are predictable and regular notwithstanding a few exceptions (Beck Reference Beck2011). Stress falls on the final syllable of words that end in a long vowel, e.g. pi′ta:jú:/ pḭtɑːˈxuː/ ‘crush’, or a closed syllable, like chojót/ tʃoˈxot / ‘saliva’, or the penultimate syllable of words ending in a short vowel as in pó:ti/ˈpoːti / ‘boat’. Ideophones, an onomatopoeic or synesthetic class of words related to adverbs in UNT (Beck Reference Beck2008), are derived by reduplicative patterns and have no fixed primary stress, though out of context ideophones are generally stressed according to regular patterns: texetexe /teʃeˈteʃe / ‘water bursting out’ and su:ksu:k /suːkˈsuːk / ‘flapping or humming object’.
2 Method
2.1 Participants
The data for this research was collected in the villages of Patla and Chicontla in Puebla State, Mexico, from August to September 2012. Six native Upper Necaxa Totonac speakers participated in the study. Three female and two male speakers were from the village of Patla and one male speaker from the village of Chicontla. The youngest speakers included two of the females who were in their early to mid-thirties; the other four speakers were over the age of 60. All participants were native speakers of Totonac and Spanish and had good literacy skills.
2.2 Data collection
The wordlist in the appendix is comprised of 93 lexical items that were compiled from the Upper Necaxa Totonac Dictionary (Beck Reference Beck2011). Participants were asked to put the word in the carrier phrase xla wánli′ _____ chuwá: /ʃlɑ ˈwɑnlḭ ____ tʃuˈwɑː/ ‘s/he said ____ now’. Speakers first practiced saying the target word in the carrier phrase, and then repeated the carrier phrase at least three times. The speakers were encouraged to read and talk about each lexical entry in order to ensure the target word was prompted. Some few lexical items of which speakers were unsure or did not know the meaning were excluded. None of the speakers had difficulties identifying the words in the wordlist written in the UNT practical orthography since all participants were completely literate in Spanish and have had access and experience with written Totonac materials, like bible translations and the UNT dictionary.
The wordlist in the appendix includes lexical items one to five syllables long from the category of nouns, verbs, and adjectives. The selected lexical items in the construction of the wordlist were limited to words with vowels that appeared between plain voiceless stops /p t s ts ʃ tʃ ɬ/ in order to avoid any non-modal and vowel lowering effects from the ejective fricatives and glottal stops, or vowel lengthening effects from surrounding approximants or glides as suggested in Warner et al. (Reference Warner, Jongman, Sereno and Kemps2004) and Kavitskaya (Reference Kavitskaya2014). The wordlist also included lexical tokens of ideophones because these items provided good environments for segmentation. Of the 93 items in the wordlist, only five lexical items differed for the Chicontla variety; the variation in the choice of lexical item was noted and transcribed accordingly.
Speakers were equipped with a head-mounted condenser microphone, and the recordings were made using a Marantz PMD 661 solid-state recorder with a modified pre-amp optimized for voice recording. Sound files were saved in 48 or 96 kHz 24 bit WAV format to an SDHC memory card. Vowels were segmented for the target word in all three productions of the phrase, except for some few word tokens where aliasing of the sound file or unexpected background noise (i.e. chickens crowing) occurred. Some speakers gave more repetitions of the phrase (with eight being the maximum number of repetitions for two items), and vowel tokens in those target words were measured as well.
2.3 Measurements
All vowels were coded for length, laryngeal, and length and laryngeal distinctions, as well as stress and syllable position (i.e. first, second, third, and less represented, fourth and fifth syllable). A total of 4151 vowel tokens were segmented (2076 vowel tokens from the females and 2075 from the males). The wordlist had representatives of all five vowel qualities /i e ɑ o u/ and their variant length and phonation types for the exception of /o̰ː/ which is rarely found outside of conditioning environments which alter the vowels’ phonation. Other discrepancies include the lack of long laryngeal /ɑ/ and /u/ which were not found in the testing environments in the present study. The distribution of vowel tokens in both stressed and unstressed positions is illustrated in Table 3.
Number of vowel tokens for vowel type.

Table 3 indicates that there is an uneven distribution of vowel type represented in the data, which is likely representative of the distribution of vowels in the language generally. Each vowel type is represented in the study, with modal (plain), unstressed, and short vowels being the most representative of the sample.
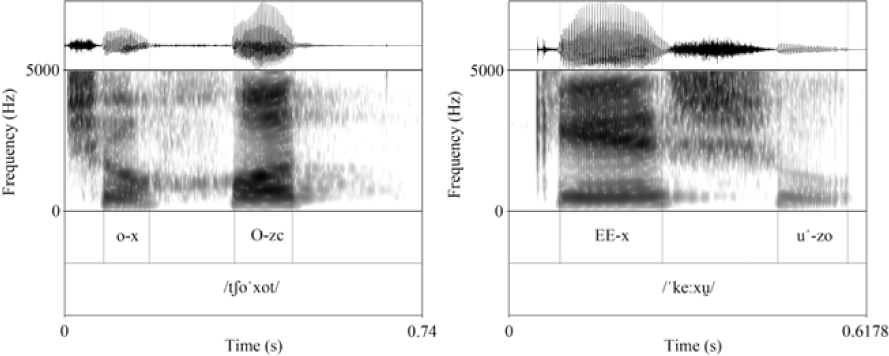
Vowel tokens were segmented using Praat (Boersma & Weenink Reference Boersma and Weenink2013) and the acoustic measures were extracted using a customized Praat script. Though each vowel token was segmented between plain voiceless stops, some stop consonants were voiced as a result of voicing assimilation. The onset of the vocalic nuclei was specified by a combination of the voice bar, the F2 band, auditory cues, and temporal cues in the waveform. The offset of the vocalic nuclei was selected at the point of lowest energy, where the F2 band is still clearly visible, and the repetitive pattern on the waveform appear to fade. A spectrogram of the word chojót/ tʃoˈxot / ‘saliva’ and ké:xu′ /ˈkeːʃṵ / ‘cheese’ by one speaker is exhibited in Figure 2.
Spectrogram of chojót /tʃoˈxot/ and ké:xu′ /ˈkeːʃṵ/ illustrating the markup of the vowels from the recorded wordlists. The vowels in the first tier were marked up using the following code (as described in Section 2.3): _x signifies that the vowel appears in syllable-initial position, _zc marks that the vowel appears in a closed final-syllable position, _zo in a final open syllable, a capital vowel indicates a stressed vowel, two vowels indicate a stressed vowel, and an apostrophe indicates a laryngeal vowel.

Figure 2 demonstrates that vowel segmentation was marked by a combination of the F2 band and the spectral peak display. The spectrograms further illustrate how the vowel tokens were coded. The _x signifies that the vowel appears in syllable-initial position with a consonant onset (CV) as do all words in the list in the appendix. Since a phonetic glottal stop is inserted in vowel-initial words, these environments were avoided due to the potential effects of vowel lowering in consonantal glottalic environments. Vowels labelled with _zc marks that the vowel appears in a closed final-syllable position, and _ zo in a final open syllable position. Capitalization marks a stressed syllable, double vowels mark length, and the straight apostrophe marks laryngealization. For some vowel tokens that exhibited non-modal effects at the onset of the vocalic nuclei, boundaries were drawn to the grey F2 band in combination with a prominent vocalic burst on the spectral peak display. For vowel tokens which appeared in word-final open syllable position, the offset of the vowel boundaries were pushed further out to capture any residual voicing and non-modal effects. For accurate positioning, the start and end selections were zero-crossed providing a standard onset and offset point for all vowels close to the original selection.
The formant tracking and f0 were adjusted such that a best-fit setting was found for individual male or female voices. These settings were used for automatic extractions of the acoustic measures and did not exceed 5500 Hz at five formants for males and 5000 Hz at five formants for females. The duration, fundamental frequency (f0), F1, F2, and F3 values were measured. formant and f0 values were also extracted at the 25%, 33%, 50%, and 75% percent points throughout the vowel. For the purposes of the present paper, we use the f0 and formant measures collected at the mid-point of each vowel.
2.4 Analysis procedures
Vowel plots were generated in R using phonTools (Barreda Reference Barreda2013). The frequency data was normalized using the Nearey (Reference Nearey1978) extrinsic method, which minimizes the variation between speakers due to social, physiological or anatomical differences, as implemented in the phon-Tools package. The Nearey extrinsic method was selected because there were unequal numbers of each vowel in a category and because it is vowel-extrinsic and formant-intrinsic, which reduces the physiological variation while maintaining sociological and dialectal variation. All f0 values were converted into semitones (Nolan Reference Nolan2003, Shih & Lu Reference Shih and Lu2015). The semitone conversion has been used to normalize f0 values across speakers of different sizes and genders. The conversion applied follows Shih & Lu (Reference Shih and Lu2015), which uses the individual speakers’ median f0 as the base and converts the individual frequency measures into semitones. Statistical analyses of the formant measures, durational data and f0 values are described in the results section.
All data were analyzed using linear mixed-effects models as implemented in the lme4 package (Bates et al. Reference Bates, Maechler, Bolker and Walker2015) in the R statistical programming language (R Core Team 2017). Subject and item were included as random-effects in all models. The individual model structure is reported for each model below. Each model originally included the following variables of interest: stress (yes, no), laryngeal (yes, no), and length (long, short). Additionally, the control variables include: sex (male, female), position (initial, middle, final), repetition (1–8), vowel quality (ɑ, e, i, o, u), and number of characters (5–13), which is a count of the characters in ASCII based on the phonemic transcription of the word where long vowels and affricates are represented with two characters. This character count is an imperfect measure but provides a close approximation of word length in number of phonemes. The control variables have been included to account for possible effects of position, repetition, and word length, which are not a focus of this paper but can influence the acoustic characteristics analyzed below. The dependent variables were fit using a backwards step-wise fitting procedure starting with all variables and removing predictors that were not significant. All possible random-slopes were investigated using a forward-fitting procedure, keeping only those slopes that significantly improved the fit of the model. Two-way interactions with variables of interest were also explored in the modeling and retained when found to significantly improve the fit of the model. Model comparisons were performed using the ANOVA function to compare the fit of models to the data. Predictor significance was determined using the t-distribution; values with a t-distribution greater than 2 were considered significant (Baayen, Davidson & Bates Reference Baayen, Davidson and Bates2008). For the purpose of publication, p-values are approximated using the Satterthwaite method as implemented in the lmerTest package (Kuznetsova, Brockhoff, & Christensen Reference Kuznetsova, Brockhoff and Christensen2016).Footnote 1 In all tables reporting statistical results significant effects have been marked with an asterisk in a separate column.
3 Results
3.1 Vowel quality
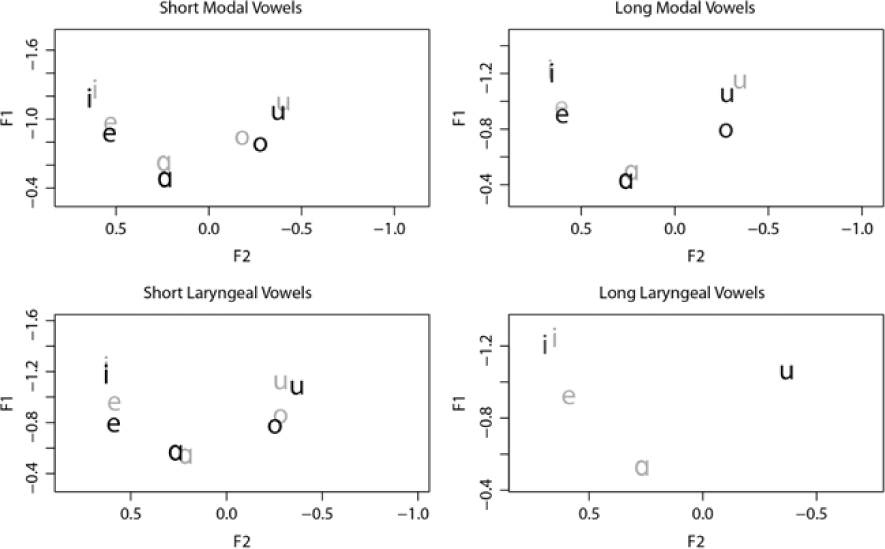
To explore the nature of the formant space in Upper Necaxa, separate linear mixed-effects analyses for F1 and F2 were performed. Figure 3 plots vowel spaces for the modal and laryngeal vowels split by vowel length using the mean values of F1 and F2. All frequency measurements were made at the midpoint of the vowel. The plots in Figure 3 suggest that the five-vowel system creates a V-shaped system rather typical of languages like Spanish with five vowels. The vowel types are relatively evenly distributed maximizing the space between vowels as much as possible. The normalized values in the vowel plots demonstrate that long and short modal and laryngeal vowels occupy roughly the same space acoustically. Stressed vowels (represented with capital letters), however, vary in position from the unstressed vowels suggesting possible differences in F1 and F2 for stress.
Comparison of F1–F2 values of Nearey normalized vowels from all six participants calculated at the midpoint of the vowel, with short vowels on the left and long vowels on the right. Laryngeal vowels are on the bottom row and modal vowels are on the top row. Black font indicates stressed vowels and grey font unstressed vowels.

The first model investigated the Nearey normalized frequency of F1 as the dependent variable with the independent variables: stress, laryngeal, length, sex, and position. This model included random effects for word, subject, and vowel quality, with random slopes for stress by subject. The final model is summarized in Table 4. The intercept values for this model are: unstressed, long, modal, female, and medial.
Results table of linear mixed-effects analysis of F1.

* = significant t-values (with an absolute value greater than 2).
The model summary in Table 4 indicates that F1 may vary depending on stress, position, or repetition of the target word. The results indicate that when the vowel is stressed, the frequency of F1 is significantly higher and hence articulated at a lower tongue position. Additionally, Table 4 suggests that the participants’ F1 values are lower with more repetitions, so that with each repetition tongue height generally increases. The other predictors all interact with syllable position. A complex interaction between F1 and syllable position is found in this case with male speakers having lower F1 values (a higher tongue position) when the vowel is at the end of the word. Laryngeal vowels in final position have a higher F1 than in medial environments, and short vowels tend to have higher F1 in initial and final positions as opposed to medial position where F1 is lower.
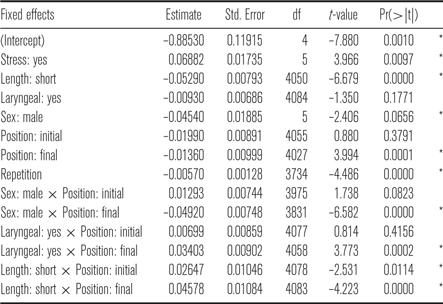
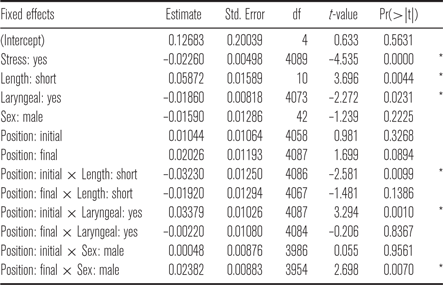
Table 5 summarizes the final model analyzing the Nearey normalized F2, which includes random effects for word, speaker and vowel quality. Significant model improvements were found with random slopes for length and position by speaker. In this analysis, repetition does not turn out to be a significant predictor and has been removed from the final model. The intercept values are: unstressed, long, modal, female and medial.
Linear mixed-effects model of F2.

* = significant t-values (with an absolute value greater than 2).
The model reported in Table 5 suggests that stress is again a significant predictor, however, in this case the F2 of the stressed vowels are lower indicating that the tongue is further back in articulation. There are also interactions between position and three other predictors: length, laryngeal, and sex. For laryngeal vowels, F2 is higher in initial position indicating that laryngeal vowels in this environment are produced with the tongue in a more front position. For long vowels, F2 is lower in initial position as compared to the medial position suggesting that syllable-initially long vowels are produced with the tongue further back. Male speakers also have higher F2 values, and thus a more front tongue position, in word-final environments.
The linear mixed-effects regression performed for both Nearey normalized frequency values indicates that the qualitative difference between stress and unstressed vowels is significant, where stressed vowels are produced lower and further back than unstressed vowels; this pattern seems to be consistent in the data. We now turn towards duration to investigate the distinction between vowel quantity and stress.
3.2 Duration
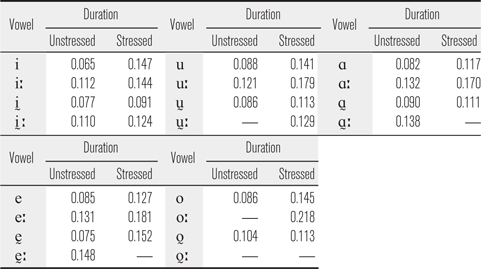
In this part of our analysis, we aim to verify the duration difference between long and short vowels and to test Beck’s characterization of stressed vowels in UNT with phonetic analysis. Table 6 provides the mean duration of each short and long vowel split across stressed and unstressed vowels. The table demonstrates that vowel duration is a phonetic correlate of long versus short vowels, and a phonetic correlate of stress, with a consistent pattern of stressed vowels being longer than unstressed vowels in both their short and long counterparts.
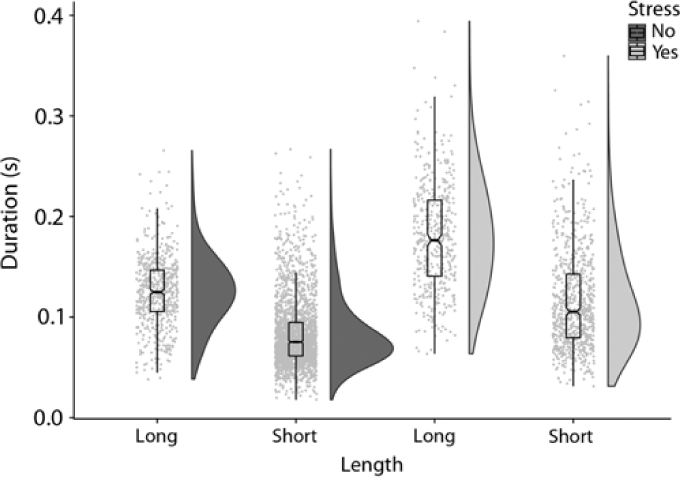
The raincloud plot (Allen et al. Reference Allen, Poggiali, Whitaker, Marshall and Kievit2018) in Figure 4 summarizes the general patterns described in Table 6 with long-unstressed, short-unstressed, long-stressed and short-stressed vowels. The raincloud plot includes the data distribution, the individual data points, and a boxplot, which indicates the 25th and 75th percentiles with the notch indicating the estimated 95% confidence interval. Figure 4 indicates that there are duration differences between phonemically long and short vowels and that there may also be duration effects due to stress in Upper Necaxa.
Mean duration in seconds of short, long, stressed and laryngealized vowels from all six participants.

Raincloud plot (Allen et al. Reference Allen, Poggiali, Whitaker, Marshall and Kievit2018) demonstrating the data distribution (in seconds), the individual data points, and a boxplot of long and short, stressed and unstressed vowels in UNT. The boxplot indicates the 25th and 75th percentiles with the notch indicating the estimated 95% confidence interval.

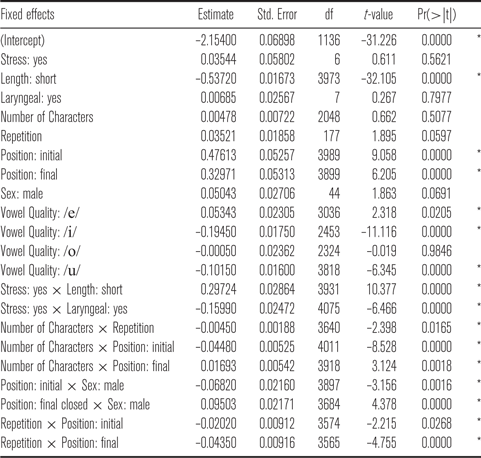
Figure 4 indicates that there is a lot of variation and a wide overlapping range between both vowel quantities, where most long vowels clearly show a distinction in length compared to the short vowels. The general effects of vowel length and stress were tested using linear mixed-effects regression with the logged duration as the dependent variable and the predictors described above as control variables. The model was fitted using a backward step-wise fitting process, removing non-significant comparisons. Table 7 demonstrates the final model which included subject and item as random effects, and stress, laryngeal, and repetition by subject as random slopes, with the intercept values: unstressed, long, modal, medial, female, and /ɑ/.
Linear mixed-effects model of the vowel duration.

* = significant t-values (with an absolute value greater than 2).
The results of the analysis presented in the model summary in Table 7 indicate that there is a significant interaction between stress and vowel length such that long vowels are significantly longer than short vowels, and short stressed vowels are significantly longer than short unstressed vowels. The interaction indicates that the lengthening effect for stressed vowels does not occur for the long vowels. In other words, the lengthening of stressed vowels is only significant for short vowels. The final model was releveled to check comparisons between the levels of length and stress. The resulting models indicated that all comparisons of length and stress were significantly different except for the comparison between unstressed and stressed long vowels (as seen in Table 7). The results suggest that Beck’s auditory perception of duration and the correlation between duration and stress are largely supported by the acoustic analysis. Stressed vowels in general have increased duration, though his phonological description falls short on the durational distinctions between short stressed vowels and long unstressed vowels in that long unstressed vowels were found to be consistently longer than short stressed vowels. Additionally, there was an interaction between the predictors laryngeal and stress, which indicates that while unstressed modal vowels were shorter than the stressed modal vowels, the stressed modal vowels were significantly longer than the stressed laryngeal vowels.
Vowel quality was also a significant predictor of vowel duration with /e/ having the longest average duration and /i/ the shortest average duration. Other observations include a general effect of position in the word with vowels in initial and final position occurring with longer durations than in medial positions. Position further interacts with sex and repetition, and the difference between the positions become weaker as the word is repeated. The duration of vowels in male speakers are also significantly longer in final position than the female speakers, whereas in initial position, this duration effect is reversed. All other effects are considered control effects and are not discussed in detail but are reported in Table 7.
3.3 Fundamental frequency
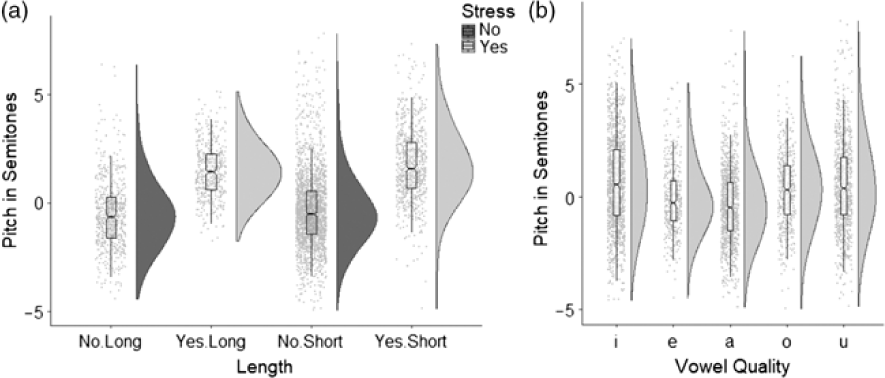
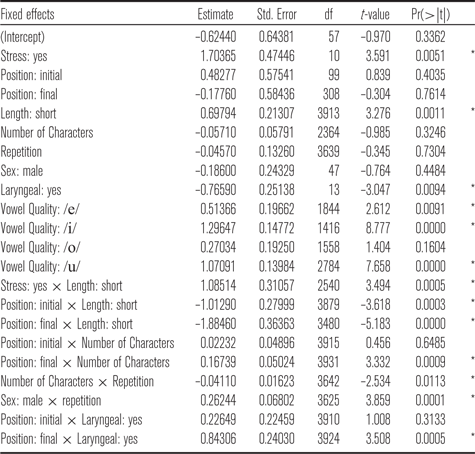
In this section, the role of fundamental frequency (f0) is investigated in relation to the differences in stress. The median f0 was calculated for each speaker and this value was converted to semitones (using each speaker’s average f0 value). A linear mixed-effect analysis was then performed with the semitone values as the dependent variable and stress (yes, no), laryngeal (yes, no), length (long, short). Additionally, the control variables include: sex (male, female), position (initial, middle, final closed, final open), repetition (1–8), vowel quality (ɑ, e, i, o, u), and number of characters (5–13) as the independent variables. Figure 5, also summarized in Table 8, illustrates the final linear mixed-effects model of f0, which included subject and item as random effects and random slopes for stress, laryngeal, and position with subject. All other random slopes did not improve the fit of the model and were excluded from the final model. The data was also analyzed in Hertz (not reported here), which indicates that the analysis of the untransformed data has largely the same results.
(a) Raincloud plot (Allen et al. Reference Allen, Poggiali, Whitaker, Marshall and Kievit2018) demonstrating the data distribution (in semitones) the individual data points, and a boxplot of long and short, stressed and unstressed vowels in UNT. The boxplot indicates the 25th and 75th percentiles with the notch indicating the estimated 95% confidence interval. Bar plot demonstrating mean values in semitones based on individual speakers’ median f0 of long and short, stressed (Yes) and unstressed (No) vowels in UNT. (b) Raincloud plot illustrating the effect of intrinsic f0 in the vowels of UNT. In both plots extreme outliers were excluded (3.3% of the data).

Linear mixed-effects model of f0.

* = significant t-values (with an absolute value greater than 2).
The results of the analysis of f0 in semitones indicate that there is an interaction between stress and length. The effect of stress on f0 is strongest for the short vowels and weakest for the long vowels. All comparisons were found to be significant after releveling except for the comparison between unstressed short and long vowels, which were found not to have significant f0 differences. Other effects of note were that vowel quality significantly predicted the f0 of the vowel in further support of the intrinsic f0 research in, for example, Whalen & Levitt Reference Whalen and Levitt1995, with the high vowels having the highest f0 and lower vowels having decreasing f0 values. We also found an interaction between f0 and position. The model was releveled to compare partial effects of this interaction. We found that for the medial (reported in Table 8) and initial (β = −0.539, SE = 0.239, p < .046) positions pitch was significantly lower for the laryngealized vowels and that there was no difference for the vowels in final position.
4 Discussion
The present study provided an acoustic description of the vowel system with contrasting length and laryngealization, and the effects of stress in Upper Necaxa Totonac. While the Totonacan languages generally and historically have three vowel qualities /i u ɑ/ with length and laryngeal distinctions, the study provides empirical support for a five-vowel system in UNT, which could have come about as part of the natural progression of the language and certain conditioning environments, or influenced by Spanish, the socio-economically dominant language of the region. The acoustic measurements demonstrate that the system is typical of languages with five vowels in that the vowels occupy the perimeters of the vowel space with the mid-vowels spaced at intermediate distances, much like the Spanish vowel system.
The present study has further demonstrated that the different vowel types, short, long, plain, and laryngeal all occupy a similar acoustic formant space. The fact that we find no difference in the formant frequencies across long and short vowels is contrary to Aschmann’s (Reference Aschmann1946) findings that patterns vary in quality based around length for Zapotitlán Totonac. Additionally, f0 was a significant factor in vowel quality where high vowels were found to have higher f0 values and lower vowels decreasing f0. While not one of the main goals of the present study, this result replicates the intrinsic f0 findings in Whalen & Levitt (Reference Whalen and Levitt1995) and adds one more empirical data point to that body of research. Fundamental frequency also predictably shows a difference between modal and laryngeal vowels, where laryngeal vowels showed significantly lower f0 values than the modal vowels.
Additionally, the distinction between phonemic long and short vowels is durational with long vowels being about one and a half times longer than short vowels. Previous studies have shown that duration is the most salient feature for identifying the contrast between long and short vowels, though other cues, like formant transitions, syllable position, and the fundamental frequency may play secondary roles in length perception (see Lehnert-LeHouillier Reference Lehnert-LeHouillier2010). The present study shows that there were no significant effects on short versus long vowels in terms of f0 or formant frequencies, and that vowel length seems to play a dominant role in phonemic vowel length.
The results further show that there is a slight quality distinction associated with stress not previously observed by the field researcher. While stressed vowels have increased duration, there are also slight distinctions in vowel height and backness. The acoustic realization of stress is indicated by many cues, where in general the F1 is higher and the F2 is lower in stressed vowels, indicating that stressed vowels are produced at a lower and further back tongue position than unstressed vowels. In terms of duration, stress is indicated by longer vowels, but unstressed long vowels are not significantly different from stressed long vowels. The acoustic evidence for the three claims made in Beck (2004) on the relation of stress and duration of vowels in UNT is summarized in (i)–(iii). The data demonstrate that the impressionistic observation about stress and duration were correct in two of the three statements.
(i) Stressed vowels have increased duration. (TRUE)
(ii) Stressed short vowels have the same duration as long vowels. (FALSE)
(iii) Stressed long vowels are not consistently longer than unstressed long vowels. (TRUE)
That vowel duration is consistently longer in stressed vowels supports that duration is a significant cue in stress even though it may not be the only one. Furthermore, while laryngeal vowels made no difference in the formant analysis, there were some notable differences in the duration in interactions with stress, which indicates that stressed modal vowels are significantly longer than the stressed laryngeal vowels, an observation that is counter to other phonetic studies concerning non-modal phonation (Kirk et al. Reference Kirk, Ladefoged, Ladefoged, Mattina and Montler1993).
One observation concerning the lengthening effect of stress on short vowels, but not on long vowels, may be explained by the differences in vowel quality in stressed environments overall. This observation, which has been termed target undershoot in Lindblom (Reference Lindblom1963), indicates that the shorter the vowel, the less time the articulators have in transitioning and therefore the faster the articulators must move. Flemming (Reference Flemming2006) further notes that target undershoot is a consequence of minimizing the effort it takes to move the articulators quickly at the expense of not reaching the vowel target. If stressed vowels in general are produced with higher F1 and lower F2 values, stressed short vowels may require more time for transitioning from a lower and further back tongue position which may result in vowel lengthening. Since stressed long vowels are also produced with a lower and further back tongue position, there may be enough time in the articulation of long vowels for formant transition, and no need for further vowel lengthening in prosodic contexts.
Even though stressed vowels are acoustically different, it would be of notable value to conduct perceptual experiments that could elucidate the cues listeners are using to differentiate stress from other unstressed (long) vowels. For instance, while there is a lengthening effect for stress, that effect does not occur for long vowels. One observation from a perceptual perspective is that if there were no other cues differentiating long stressed from long unstressed vowels, then the stressed long vowels would be perceptually indistinguishable with the unstressed long vowels making this aspect of the vowel system confusing for a listener. However, the results suggest that distinguishing long stressed vowels from long unstressed vowels may be reliant on correlations with f0. Fundamental frequency was found to be a significant cue for stress, in which stressed vowels have higher f0 values overall though this effect was weakest for the long stressed vowels.
5 Conclusion
The Totonacan languages have a number of interesting typological properties including vowel systems that contrast in both length and phonation. This study provides a first investigation of the frequency and durational characteristics of modal and non-modal vowels in Upper Necaxa Totonac. The acoustic measurements support previous descriptions of the quality and quantity for long, short, modal and laryngeal vowels. The results indicate that the short, long, modal, and laryngeal vowels occupy the same space and distribution in the vowel system, with some differences in formant frequency values due to the effect of stress. Vowel duration was also a significant predictor of stress but only for short vowels, indicating that duration is not a significant cue for long stressed vowels. The phonetic analysis was also used to test Beck’s (Reference Beck2004, Reference Beck2011) observations between stress and duration in Upper Necaxa Totonac. The study demonstrated that Beck’s observations were correct for two out of three predictions on his perceptual correlates of stress and length. Stressed vowels were significantly longer than unstressed vowels, but long-vowels appeared with greater duration than short-stressed vowels. Long-stressed vowels were not consistently longer than long-unstressed vowels. These results imply that speakers might use duration as a distinguishing factor between these categories, but must also use a variety of other cues like format frequency and f0 to distinguish stress. The study further investigates some of the interactions concerning f0, syllable position and repetitions in relation to quality and quantity distinctions, such that for example, vowel duration was longer in syllable-initial and syllable-final positions; however, effects became weaker with every repetition. Future research needs to investigate how vowel and syllable length plays a role in prosody and phrase-level marking, as has been investigated in two Apachean languages, which demonstrated that morphological factors can be used to predict certain lengthening environments (Tuttle Reference Tuttle, Hargus and Rice2005). Upper Necaxa, like most indigenous languages of the world, is still under-described, with technical acoustic descriptions of the sound inventories representing an especially glaring lacuna. Acoustic studies of these languages represent an underdeveloped but critical source of typological data on the properties of sound and primary cues in sound perception and production. Phonetic descriptions of this type not only contribute to linguistic typology and the acoustic signals associated with vowel sounds, but also the prosodic factors that guide native-like pronunciations important to language learning and language revitalization.
Acknowledgements
Our gratitude goes to our participants in Patla and Chicontla for their engagement and enthusiasm with the research project. Many thanks to David Beck for his support and connections to community members, and to Conor Snoek and the anonymous reviewers for their helpful comments and feedback. This project was funded by a grant awarded to the first author from the Jacobs Research Fund and in part by the Social Sciences and Humanities Research Council for the Upper Necaxa Totonac Field Project.
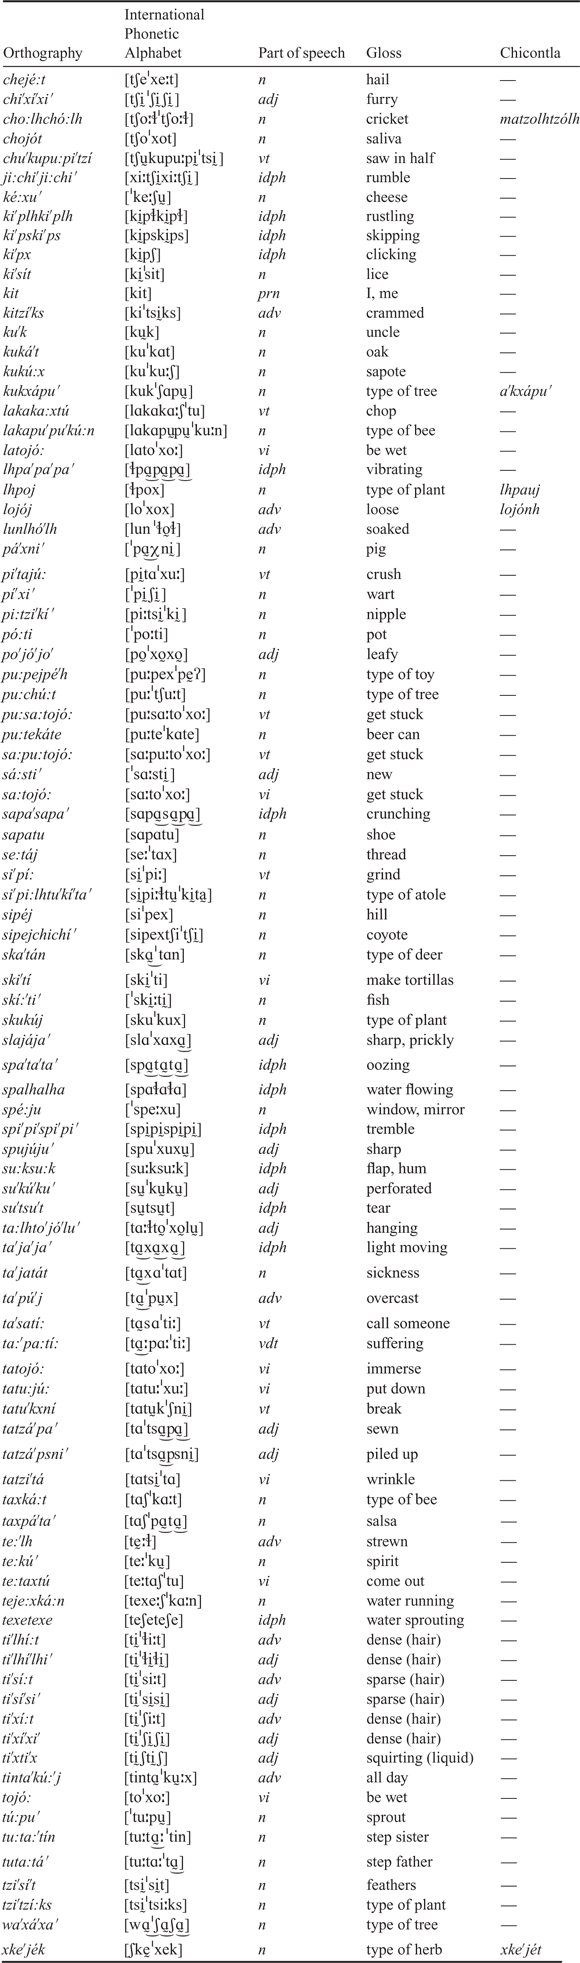
Appendix. Wordlist for Patla and Chicontla