I. INTRODUCTION
Maraging steels combine high strength with excellent toughness. Reference Sha and Guo1 This combination of properties is achieved by a microstructure consisting of a cubic martensitic matrix with a high number density of nanometer-sized precipitates of different types of intermetallic phases. These precipitates are induced by an aging heat treatment at temperatures below the austenite start temperature (following initial quenching). Depending on alloy composition, a limited amount of austenite reversion can take place during the heat treatment, in addition to the potentially present retained austenite after quenching.
Maraging steels are typically manufactured via block casting in conjunction with subsequent breakdown hot rolling, solution heat treatment, quenching, machining, and a final aging treatment. To also manufacture small, custom-made high-precision parts directly from metallic material in powder form, selective laser melting (SLM), an additive manufacturing process, has become a primary objective of current research. Reference Gu, Meiners, Wissenbach and Poprawe2,Reference Kruth, Levy, Klocke and Childs3 SLM is a process by which workpieces are generated layer by layer directly from a computer-aided design (CAD) file. The shape of the part to be manufactured is sliced into individual layers by a computer algorithm. In the SLM machine, layers of powder are successively spread out and consolidated locally by melting the powder material using a laser beam. By scanning the laser beam only in regions where the current layer intersects the shape of the part to be built, the part is manufactured in near net shape.
Maraging steels are very well suited for the SLM process for two main reasons. Firstly, as materials with martensitic matrix, they need to be quenched rapidly from the austenitic region to temperatures below the martensite start temperature. Because of the small size of the melt pool in the SLM process (relative to the size of the substrate), cooling rates are typically very high (103 to 108 K/s; see, e.g., Refs. 2, 4, and 5). Secondly, maraging steels have thus far found their application mainly in the aerospace and tool-manufacturing industries due to their substantial cost. These industries often call for geometrically complex components with excellent mechanical properties in not too large quantities, a combination of demands that can be well fulfilled by the SLM process.
The maraging steel produced by SLM has a significantly higher yield strength and ultimate tensile strength than conventionally processed material in the non-heat-treated state. Reference Kempen, Yasa, Thijs, Kruth and Van Humbeeck6 On the one hand, this can be attributed to the very fine microstructure after SLM: the elongated grains (cells) that result from cellular solidification have a diameter ≤1 µm. On the other hand, precipitation hardening may also contribute to this high strength: Upon depositing subsequent layers, the underlying material is partially remelted (the layer immediately below the new layer) or reheated to considerably high temperatures, i.e., the material in one layer is in the heat-affected zone of the layer above (and even subsequent layers, with diminishing intensity). Reference Zheng, Zhou, Smugeresky, Schoenung and Lavernia4,Reference Zheng, Zhou, Smugeresky, Schoenung and Lavernia5,Reference Qian, Mei, Liang and Wu7 This might lead to clustering or to nucleation of precipitate phases during this “intrinsic heat treatment.” Some maraging steels were reported to show hardening because of solute clustering even after heat treatments of only a few seconds in duration. Reference Shekhter, Aaronson and Miller8,Reference Pereloma, Stohr, Miller and Ringer9
The chemistry of the precipitate phase(s) and the amount of martensite-to-austenite transformation depend on the alloy composition. For the classical Ni maraging steels introduced by Decker et al., Reference Decker, Eash and Goldman10,Reference Decker11 typically, the high content of Ni in combination with Ti leads to precipitation of the Ni3Ti phase. Reference Sha, Cerezo and Smith12–Reference Servant and Bouzid17 In this phase, atoms on the Ni sublattice can be (partially) substituted by Fe and Co, while atoms on the Ti sublattice can be substituted by Al and Mo. Upon continued heat treatment, Mo-bearing maraging steels also show precipitation of a Mo-rich phase. This has been identified as Fe2Mo in some works employing transmission electron microscopy (TEM); Reference Vasudevan, Kim and Wayman15,Reference Lecomte, Servant and Cizeron18,Reference Viswanathan, Dey and Asundi19 however, thorough studies employing atom-probe tomography (APT) have determined the composition of this phase to be of the type Fe7Mo6 (Refs. Reference Sha, Cerezo and Smith12–Reference Sha, Cerezo and Smith14; see Ref. 20 for a review). Also for this phase, partial substitution of atoms on the two sublattices is possible.
APT is a technique that is very well suited for the study of clustering and precipitation reactions in metallic materials. Reference Marquis and Hyde21,Reference Gault, Moody, Cairney and Ringer22 In an APT experiment, a high DC voltage is applied to a needle-shaped specimen with a tip radius typically <50 nm. By applying an additional voltage or laser pulse to the specimen, atoms are removed one by one from the tip apex by field evaporation and field ionization. Accelerated by the voltage between the tip and a counter electrode, the ions hit a 2D-detector system and their position as well as their time of flight (between the pulse and the detection event) are recorded. Using a point-projection algorithm, the original positions of the ions in 3D space are reconstructed and their chemical identities are revealed by their mass-to-charge ratios, as calculated from the time of flight. This technique offers the unique combination of a very high chemical sensitivity combined with near-atomic resolution. Even very small clusters consisting of only a few tens of atoms can be identified using statistical methods.
In the current work, we employ APT to investigate the precipitation behavior of maraging steel produced by SLM. We first determine if there is any clustering or precipitation present in the as-produced state. Subsequently, we investigate the heat-treated material in the peak-aged condition. We identify the intermetallic phases present and compare the findings with results from previous works.
II. EXPERIMENTAL
The material was obtained in powder form from LPW Technology Ltd. (Runcorn, Cheshire, UK) and was processed using a Concept Laser M3 SLM machine (Lichtenfels, Germany) using a layer thickness of 30 µm, a laser scan speed of 150 mm/s, and a scan spacing of 112 µm. Details about the production process are described elsewhere. Reference Kempen, Yasa, Thijs, Kruth and Van Humbeeck6 The material investigated here is the same as that used in Ref. Reference Kempen, Yasa, Thijs, Kruth and Van Humbeeck6. The heat treatment was conducted in a box furnace under air.
Scanning electron microscopy was performed using a Zeiss Merlin field emission scanning electron microscope (SEM; Oberkochen, Germany) equipped with a Bruker Quantax EBSD system (Billerica, MA) on specimens prepared by the usual metallographic techniques and etched with a solution of HNO3 in ethanol.
APT specimens were prepared from polished specimen surfaces in a FEI Helios NanoLab 600i FIB/SEM dual beam device (Hillsboro, OR), equipped with a micromanipulator using a conventional liftout technique. Reference Larson, Prosa and Kelly23 Annular focused ion beam (FIB) milling was concluded with a final step at 5 kV acceleration voltage and 40 pA beam current to eliminate any Ga contamination at the specimen surface. All APT experiments were conducted in a Cameca LEAP 3000 X HR (Madison, WI) at a pressure of less than 10E-10 mbar. Both laser pulsing and voltage pulsing experiments were conducted and the base temperature as well as the pulse height and repetition rate were varied to determine any influence on the measured concentration. No systematic dependence was found and most measurements were conducted at a base temperature of 60 K and a pulse repetition rate of 200 kHz either in laser pulsing mode at a pulse energy of 0.4 nJ or in voltage pulsing mode at a pulse fraction of 20%. After data acquisition, the 3D datasets were reconstructed using the software package IVAS (version 3.6.6) and a SEM image of the APT tip prior to the experiment. All voxel-based analyses presented in the current paper (e.g., isoconcentration surfaces Reference Hellman24 ) were performed with a grid spacing of 1 nm and a delocalization value of 3 nm.
All thermodynamic calculations were performed using the Thermocalc software (version 3.1), using the database TCFE7.
III. RESULTS
A. Samples obtained after SLM
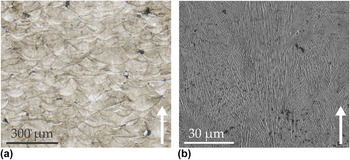
The microstructure of the maraging steel after the additive manufacturing process is shown in Fig. 1(a) as a light-optical micrograph and in Fig. 1(b) as a scanning-electron micrograph. The sample was prepared from a plane perpendicular to the laser tracks. The boundaries of these tracks were made visible by etching. In the SEM micrograph, bundles of very fine solidification cells can be seen. These are due to the high cooling rates during solidification and grow mainly along the direction of fastest heat removal, i.e., perpendicular to the laser track direction. It is not entirely clear if the structures are solidification cells or dendrites with very short secondary arms (and very fine arm spacing, indicating a high cooling rate). For the remainder of this article, we will call the structures “cells.” Evidently, the orientation of the solidification cells does not change at the track interface. This is expected, since every layer is partially remelted upon deposition of the subsequent layer, thereby alleviating the need for repeated nucleation. All APT specimens were prepared with the tip axis parallel to the laser track direction, i.e., perpendicular to the long axis of the solidification cells/perpendicular to the build direction (see the arrows in Figs. 1 and 3). The samples were taken from approximately the middle of the specimen (in build direction), to minimize any potential influence of the substrate or the top surface, and approximately from the middle of a scan track.
LM and SEM micrographs of an etched cross section of the material. The deposition tracks and the fine solidification cells are clearly visible. The arrows denote the SLM build direction.

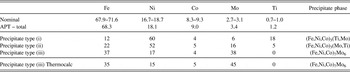
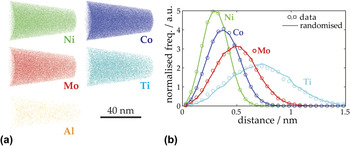
The material in the as-produced condition was investigated first. The overall concentrations of the major elements, as determined by APT in multiple experiments, are shown in Table I together with the nominal concentrations of the powder used in the SLM process. All values are very similar, indicating that the chosen measurement parameters (in this case, voltage pulsing) were suitable for the current material. In Fig. 2(a), projections of 3D atom maps of a representative measurement are shown separately for the major solute elements. It is obvious that no precipitation has occurred during cooling after solidification. To exclude the presence of small clusters, which are difficult to discern by eye, the first-nearest-neighbor distance distributions of the same elements are plotted in Fig. 2(b). The markers denote the measured distributions and the lines denote the same distributions measured in a dataset with the same spatial arrangement of atoms, but with randomized chemical identity. Any clustering would be visible as a difference between these two curves, in particular by a maximum of the data at smaller spacing compared to the randomized data. Reference Marquis and Hyde21,Reference Gault, Moody, Cairney and Ringer22,Reference Stephenson, Moody, Gault and Ringer25 No such difference is observed in the current APT experiments (also when repeating the analysis with fifth-nearest-neighbor distributions) and hence clustering or incipient nucleation in the as-produced state can also be excluded.
Nominal composition of the maraging steel, together with the overall composition as measured by APT (relative accuracy approx. ±1%). Also given are the concentrations inside the three precipitate types as determined from proxigrams (Fig. 6, accuracy approx. ±2%), together with a Thermocalc equilibrium calculation for type (iii) precipitates (µ phase). All values are given in at.%.

(a) Atom maps and (b) nearest-neighbour-distance distributions of the solute elements in an APT measurement of as-produced material. Note that in panel (a) only 30% of the captured Ni ions are shown and that the Ti and AL ions are displayed twice as large as the other ions.

B. Heat-treated state: Precipitation in SLM-produced maraging steel
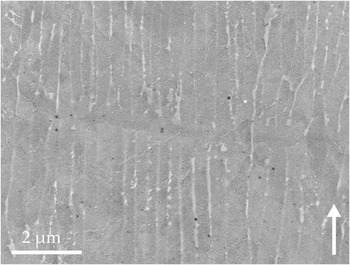
The material was aged at 480 °C for 5 h to peak hardness (53 HRC as compared to 32 HRC in the as-produced state) and analyzed by SEM and APT. Figure 3 shows a SEM micrograph of the material after aging and light etching. A development of new phases both within the solidification cells and at the cell boundaries is visible. While the fine structures within the cells are too small to be investigated in detail by a SEM, the second phase at the cell boundaries was characterized by electron backscatter diffraction (EBSD) and it was determined that it consists of austenite.
SEM micrograph of the microstructure after aging at 480 °C for 5 h. Horizontally in the middle, a layer boundary is visible. The development of new phases inside the solidification cells and in the space between cells is visible. The arrow denotes the SLM build direction.

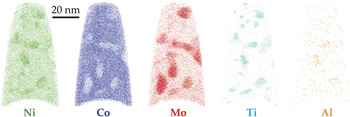
The aged material was investigated using APT next. A 10-nm thick slice through a small APT dataset is displayed in Fig. 4 separately for all major solute elements. This dataset was chosen for better visualization; we also obtained much larger datasets (>20 million ions) which quantitatively show the same results. Obviously, precipitation has occurred as indicated by the regions enriched in Ni, Mo, Ti, and Al and depleted in Co. Closer inspection reveals that not all precipitates show the same enrichment/depletion or the same morphology. Three different types of precipitates can be distinguished: (i) Ni–Ti-rich (with slight Mo enrichment), (ii) Ni–Mo-rich (with slight Ti enrichment), and (iii) Mo-rich (with slight Ni depletion, see e.g., bottom left).
Slices of 10 nm thickness through an APT dataset of aged maraging steel showing the major solute atoms. Precipitates are clearly visible. Note that only 30% of the captured Ni ions are shown and that the Al ions are displayed twice as large as the other ions.

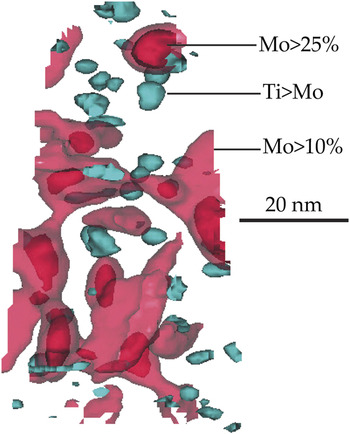
To investigate the precipitates further, three isoconcentration surfaces (isosurfaces) are applied to the dataset which are specific to the three types of precipitates: (i) an isosurface showing regions with a Ti/Mo ratio larger than one, (ii) an isosurface for regions with Mo concentrations >10 at.%, and (iii) an isosurface for Mo concentrations >25 at.%. The values chosen for the isosurfaces are not critical: slightly different concentrations lead to the same identified precipitates (same morphology and location, but slightly different sizes). See the supplementary material for additional proof for the existence of three separate kinds of precipitates. The isosurfaces are shown in Fig. 5 for the same APT dataset as presented in Fig. 4 (note that isosurface (ii) is shown semitransparently). There is a high number density of type (i) precipitates. They are nearly equiaxed in shape and 2–7 nm in diameter. Type (ii) precipitates are fewer in number and have the shape of elongated plates. Inspection of the entire analyzed volume (as opposed to a slice through the volume as in Fig. 4) reveals that these precipitates form an interconnected network and that they are oriented along certain favorable directions. Type (iii) precipitates are even fewer in number and are again rather equiaxed in shape. They are typically 5–11 nm in diameter and are located at the corners or nodes of the network of type (ii) precipitates, indicating that the former might have served as nucleation sites for the latter.
The same dataset as in Fig. 4; three different isoconcentration surfaces (as specified in the figure) are shown.

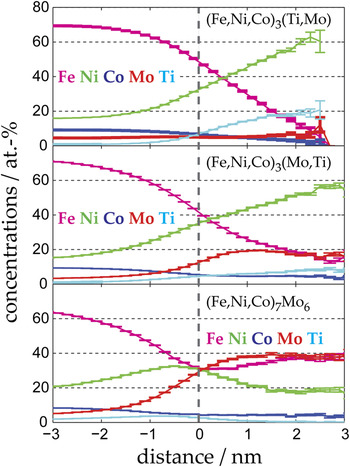
Proximity histograms based on the three isosurfaces described above (i.e., averages over all isosurfaces of each type) are shown in Fig. 6. From left to right, they show the concentrations in the matrix surrounding the respective precipitates, the concentrations at the generating isosurface, and the concentrations inside the precipitates. The average compositions in the center of the precipitates, determined from the proxigrams, are compiled in Table I. Note that all results were reproduced in several measurements, all of which are much larger than the one shown here for visualization purposes. Based on these compositions, type (i) precipitates can be identified as Ni3Ti-type precipitates, in which Fe and Co atoms substitute on the Ni sublattice and Mo atoms substitute on the Ti sublattice. The resulting ratio Fe + Ni + Co to Ti + Mo is almost exactly 3 to 1, i.e., (Fe,Ni,Co)3(Ti,Mo). Likewise, type (ii) precipitates can be identified as (Fe,Ni,Co)3(Mo,Ti) precipitates. Interestingly, there seem to be two kinds of A3B-type precipitates present at the same time in the same material, one with mainly Ti as “B” element and one with mainly Mo as “B” element. Apparently, both elements favor precipitation of this stoichiometry, but do not tolerate a too high concentration of substitution on their sublattice.
Proximity histograms from the same dataset as in Fig. 4, based on (from top to bottom) the Ti > Mo isosurface, on the Mo > 10% isosurface (after removing regions where Mo > 25%), and on the Mo > 25% isosurface. On the left-hand side, they show the composition of the martensite matrix; on the right-hand side, they show the concentrations inside the three kinds of precipitates. The error bars denote the counting error of the concentrations.

Finally, type (iii) precipitates can be identified as Fe7Mo6 precipitates (µ phase) with some substitution of Co and Ni on the Fe sublattice: (Fe,Ni,Co)7Mo6 (note the complete absence of Ti in this kind of precipitate). Since the ratio Fe + Ni + Co to Mo as determined from APT is not exactly 7/6, the composition of µ phase in equilibrium with ferrite (with nominal composition of the maraging steel) at 480 °C was calculated using Thermocalc. The result of this calculation is shown in the last row of Table I. Even though the thermodynamic calculation predicts a slightly higher enrichment in Mo, the relation of concentrations matches the experimental values very well and it can be concluded that type (iii) precipitates are indeed µ phase. There appears to be an enrichment in nickel at the interface of the (Fe,Ni,Co)7Mo6 precipitates (see Figure 6, bottom). However, this apparent enrichment is due to the fact that these precipitates are always found in the immediate vicinity of the Ni-rich (Fe,Ni,Co)3(Mo,Ti) precipitates, and so it is not an interface property of the µ-phase precipitates themselves.
C. Heat-treated state: Reaustenitization in SLM-produced maraging steel
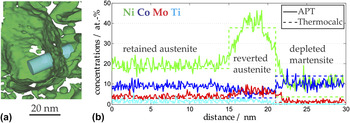
In one of the APT measurements, a large (approx. 50 nm wide) region free of precipitates is observed, which is surrounded by a Ni-rich shell. Ni isosurfaces of 26 at.% in this region of the dataset delineate this shell [see Fig. 7(a)]. In Fig. 7(b), a 1D-concentration profile along the cylinder displayed in panel (a) is shown, crossing from the precipitate-free region, through the Ni-rich shell into the region with precipitates. The concentration inside the precipitate-free region corresponds to the nominal concentration of the alloy [as indicated by the dashed lines in the left part of Fig. 7(b)]. This indicates that this region consists of retained austenite, which was not transformed to martensite during cooling after solidification. The Ni-rich shell might then correspond to reverted austenite that formed during the aging treatment. To test this hypothesis, a Thermocalc calculation was performed to determine the equilibrium concentrations of austenite and ferrite of a material with the nominal concentration of the maraging steel at 480 °C. The results are shown as dashed lines in the middle and right part of Fig. 7(b). The concentrations measured in the Ni-rich shell correspond very well with the equilibrium concentration of austenite at 480 °C. The measured concentrations in the martensite do not correspond exactly to the calculated concentrations in the ferrite. In particular, the calculated concentration of Ni is approximately 4 at.%, while the measured concentration is around 10 at.%. This might be due to the high number density of precipitates in the martensite influencing the composition profile, or simply because diffusion in ferrite at 480 °C is sluggish, and hence the martensite is not yet completely depleted of Ni. In any case, all general trends (depletion in Ni, Mo, and Ti and enrichment in Co) are clearly captured and it can be concluded that the Ni-rich shell is indeed reverted austenite formed in a local-equilibrium phase transformation during aging.
(a) A part of an APT dataset, represented by a 26 at.% Ni isosurface. (b) A 1D-concentration profile taken along the cylinder in panel (a), together with concentrations calculated by Thermocalc, indicating austenite reversion during aging.

IV. DISCUSSION
It is well known that the cooling rates achieved during the SLM process are quite high, so it is not surprising that the microstructure of the maraging steel in the as-processed state mainly consists of martensite. However, given the propensity of maraging steels to form intermetallic precipitates, and given the “intrinsic heat treatment” of the material during the deposition of subsequent layers, it is more surprising that the material shows no indication of precipitation, nucleation, or clustering whatsoever. It would be interesting to perform short-term annealings to investigate the minimum annealing time needed to induce precipitation and to compare the current results with SLM-processed maraging steels known to show clustering after very short heat treatment times, e.g., maraging steels containing Mn and Al. The high hardness of maraging steel produced by SLM in the as-processed state must be caused by effects other than precipitation, such as the very small grain size of solidification cells or residual stresses introduced by large thermal gradients during processing.
After aging the material to peak hardness condition, three different kinds of precipitates are detected: (Fe,Ni,Co)3(Ti,Mo), (Fe,Ni,Co)3(Mo,Ti), and (Fe,Ni,Co)7Mo6. The precipitation of Ni3X-type phases and µ phase (Fe7Mo6) in maraging steels is well reported. Typically, the Ni3Ti phase is very quick to precipitate and may also act as a nucleation site for later precipitation for µ-phase precipitates. Reference Sha, Cerezo and Smith14 However, to the authors' knowledge, there are no reports of the simultaneous presence of two different kinds of Ni3X precipitates in commercial maraging steels (as detected by APT). We found one kind relatively rich in Mo and poor in Ti (ratio 3:1) and one relatively poor in Mo and rich in Ti (ratio 1:3). Usually, Ti-rich precipitates form very quickly upon aging, so the latter type might nucleate and grow first, with the remaining Ti in the matrix being incorporated later into the relatively Mo-rich Ni3X precipitates. These Mo-rich precipitates might then act as nucleation sites for the µ phase, which is the last precipitate phase to form. Note that Co is rejected from all three types of precipitates, which corresponds with its intended purpose in the alloy of lowering the solubility of Mo in the martensite.
In addition to precipitation, austenite reversion is observed in the material upon aging. The reverted austenite forms a thin shell around regions of retained austenite. This growth location alleviates the need for nucleation and is hence energetically favorable. The reverted austenite grows at concentrations close to the equilibrium values calculated by Thermocalc for the aging temperature. This behavior is very similar to the austenite reversion behavior observed in a lean (i.e., low-Ni) maraging steel. Reference Dmitrieva, Ponge, Inden, Millán, Choi, Sietsma and Raabe26 Although a large volume fraction of austenite in maraging steels is not desired because it lowers the overall strength, it can also contribute to ductility via the transformation-induced plasticity (TRIP) effect and may hence have a beneficial effect, depending on the intended application of the material.
V. CONCLUSIONS
We investigated the microstructure of Co-bearing maraging steel (Fe–18Ni–9Co–3.4Mo–1.2Ti) produced by SLM in the as-produced and in the peak-aged state by electron microscopy and APT. The following conclusions can be drawn:
-
(1) In the as-produced state, the material consists of a martensitic matrix with small regions of retained austenite.
-
(2) Quantitative analysis of APT datasets revealed that there are no precipitates or clusters present in the material in the as-produced state, even though each layer has experienced significant reheating during the layer-by-layer manufacturing process of SLM.
-
(3) Upon aging, three kinds of precipitates emerge, presumably in this order: (Fe,Ni,Co)3(Ti,Mo), (Fe,Ni,Co)3(Mo,Ti), and (Fe,Ni,Co)7Mo6 (µ phase). The simultaneous occurrence of two different kinds of Ni3X precipitates with different amounts of substitution of Mo on the Ti sublattice in commercial maraging steels has not been described in the literature as yet. The Mo-rich Ni3X precipitates may act as nucleation sites for the later precipitation of µ-phase precipitates. The observed concentration of the µ phase corresponds well with thermodynamic calculations.
-
(4) Additionally, austenite reversion is observed during aging. A new layer of Ni-rich austenite is observed forming around a region of retained austenite, thus alleviating the need for nucleation. The concentrations of reverted austenite and depleted martensite correspond well with thermodynamic equilibrium at the aging temperature.
Supplementary Material
To view supplementary material for this article, please visit http://dx.doi.org/jmr.2014.204.