Introduction
Is nonnative language processing similar to native language processing? This question has been pursued from both psycholinguistic and neurocognitive perspectives, and insights into the question have implications for theory and research across a number of disciplines including cognitive psychology, cognitive neuroscience, bilingualism, and second language acquisition (e.g., Abutalebi, Reference Abutalebi2008; Caffarra et al., Reference Caffarra, Molinaro, Davidson and Carreiras2015; Clahsen & Felser, Reference Clahsen and Felser2006b; Kotz, Reference Kotz2009; Morgan-Short, Reference Morgan-Short2014). Within the last 15 years, there has been increasing interest in using the Event-Related Potential (ERP) technique to study nonnative language processing. ERPs reflect real-time electrophysiological brain activity and their excellent temporal precision enables researchers to examine aspects of language in close detail. As such, they are a useful tool for studying the neural correlates of nonnative language (L2) processing, and its comparability to native language (L1) processing. With the expansion of this research area, new questions are emerging and revealing limits in our knowledge of L2 neurocognitive processing. This study addressed gaps in L2 ERP research by examining individual differences in the N400 and P600 ERP correlates of L1 and L2 sentence processing of semantic and grammar information, within-subjects.
ERPs and language
Neurocognitive measures of language processing, and in particular ERPs, are able to provide novel, disambiguating insight into group-level and individual-level differences, and they are also useful for uncovering qualitative differences in how language information is processed (e.g., Grey et al., Reference Grey, Sanz, Morgan-Short and Ullman2018; Morgan-Short, Finger et al., Reference Morgan-Short, Finger, Grey and Ullman2012; Morgan-Short, Steinhauer et al., Reference Morgan-Short, Steinhauer, Sanz and Ullman2012; Tanner et al., Reference Tanner, Inoue and Osterhout2014; Tanner & Van Hell, Reference Tanner and Van Hell2014).
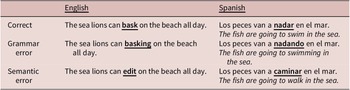
ERPs are derived through recording naturally occurring electroencephalogram (EEG) data and consist of changes in the brain’s electrical activity in response to a time-locked external event, such as a word in a sentence. ERP language studies often use “violation” paradigms in which the neural activations of correct (or standard) stimuli are compared to matched “violation” stimuli, for example a grammar error or semantic error,Footnote 1 often called a semantic anomaly, as in the examples in Table 3 (Grey & Tagarelli, Reference Grey, Tagarelli, Phakiti, de Costa, Plonsky and Starfield2018; Kaan, Reference Kaan2007). ERPs have been used to study language processing for more than 40 years and the present study focused on two well-researched and reasonably well-understood ERP effects: N400 and P600.
The N400 is a negative-going waveform with a broad central-posterior scalp distribution; it is typically understood to reflect lexical/semantic processing in the brain (e.g., Kaan, Reference Kaan2007; Kutas & Federmeier, Reference Kutas and Federmeier2011; Lau et al., Reference Lau, Phillips and Poeppel2008). The amplitude of the N400 covaries with a number of lexical and semantic factors, including word frequency, the predictability and contextual felicity of a word in a sentence or discourse, and interpretative relevance of the target (Choudhary et al., Reference Choudhary, Schlesewsky, Roehm and Bornkessel-Schlesewsky2009; Kutas & Federmeier, Reference Kutas and Federmeier2011; Nieuwland & Van Berkum, Reference Nieuwland and Van Berkum2006b, Reference Nieuwland and Van Berkum2006a; Van Berkum et al., Reference Van Berkum, Brown and Hagoort1999). Since its discovery, the N400 has been widely accepted as indexing difficulty in accessing semantic information (Kutas & Hillyard, Reference Kutas and Hillyard1980; Kutas & Federmeier, Reference Kutas and Federmeier2011; for an alternative account suggesting that semantic inhibition underlies the N400, see Debruille, Reference Debruille2007; Debruille et al., Reference Debruille, Ramirez, Wolf, Schaefer, Nguyen, Bacon and Brodeur2008).
The second ERP effect of interest, the P600, is a positive-going waveform with a posterior scalp distribution. P600s are typically elicited in response to violations of morphosyntax, for example in verb tense (e.g., Grey et al., Reference Grey, Tanner and Van Hell2017; Osterhout & Nicol, Reference Osterhout and Nicol1999) and subject-verb agreement (Coulson et al., Reference Coulson, King and Kutas1998; Kaan, Reference Kaan2002; Osterhout & Mobley, Reference Osterhout and Mobley1995; Silva-Pereyra & Carreiras, Reference Silva-Pereyra and Carreiras2007; Tanner et al., Reference Tanner, Grey and van Hell2017), and they have also been elicited with semantic manipulations, such as thematic role or animacy errors and semantic anomalies (e.g., Chow & Phillips, Reference Chow and Phillips2013; Kim & Osterhout, Reference Kim and Osterhout2005; Kuperberg et al., Reference Kuperberg, Kreher, Sitnikova, Caplan and Holcomb2007). The precise nature of P600 effects is a topic of discussion in the literature (e.g., Bornkessel-Schlesewsky & Schlesewsky, Reference Bornkessel-Schlesewsky and Schlesewsky2008; Chow & Phillips, Reference Chow and Phillips2013; Coulson et al., Reference Coulson, King and Kutas1998; Friederici et al., Reference Friederici, Hahne and Saddy2002; Kolk & Chwilla, Reference Kolk and Chwilla2007; Osterhout et al., Reference Osterhout, Kim, Kuperberg, Spivey, Joannissee and McCrae2012; van de Meerendonk et al., Reference van de Meerendonk, Kolk, Vissers and Chwilla2010), but several decades of research demonstrate that the P600 is sensitive to and reliably elicited by morphosyntactic (i.e., grammar) violations. And despite differences in current theoretical descriptions of P600 effects, there is general agreement that P600s reflect processing of a stimulus in conflict with an expected linguistic representation and a late attempt at repair or reanalysis, and that the P600 effect reflects a set of processes that are neurocognitively distinct from the processes reflected in the N400 (Allen et al., Reference Allen, Badecker and Osterhout2003; Bornkessel-Schlesewsky & Schlesewsky, Reference Bornkessel-Schlesewsky and Schlesewsky2008; Chow & Phillips, Reference Chow and Phillips2013; DeLong et al., Reference DeLong, Quante and Kutas2014; Kolk & Chwilla, Reference Kolk and Chwilla2007; Kuperberg, Reference Kuperberg2007; Osterhout & Nicol, Reference Osterhout and Nicol1999; van de Meerendonk et al., Reference van de Meerendonk, Kolk, Vissers and Chwilla2010).
In L2, N400s have been observed for semantic processing and both N400s and P600s have been reported for grammar processing. One trend in the L2 ERP grammar processing literature is that N400s, instead of P600s, are occasionally reported for grammar at lower L2 proficiency (but see Gabriele et al., Reference Gabriele, Alemán Bañón, Hoffman, Covey, Rossomondo and Fiorentino2021 for P600s in novice learners). With increasing L2 proficiency, P600s are more likely to be found. For reviews, see Caffarra et al. (Reference Caffarra, Molinaro, Davidson and Carreiras2015), Morgan-Short (Reference Morgan-Short2014), Steinhauer (Reference Steinhauer2014), Steinhauer et al. (Reference Steinhauer, White and Drury2009), and Van Hell and Tokowicz (Reference Van Hell and Tokowicz2010).
Individual differences in the ERP correlates of L1 and L2 sentence processing
Most ERP research on L2 sentence processing has either examined L2 compared to L1 literature, that is, compared L2 results to previous findings reported in the ERP literature on L1 processing (e.g., Batterink & Neville, Reference Batterink and Neville2013), or compared the L2 group to a separate L1 group (e.g., Bowden et al., Reference Bowden, Steinhauer, Sanz and Ullman2013; Fromont et al., Reference Fromont, Royle and Steinhauer2020). Using these between-subjects designs, deviations in L2 from L1 patterns have led to conclusions about qualitative and quantitative differences in L2 (for reviews, see e.g., Morgan-Short, Reference Morgan-Short2014; Steinhauer, Reference Steinhauer2014; Van Hell & Tokowicz, Reference Van Hell and Tokowicz2010), which have informed theoretical models of L2 neurocognition (e.g., Clahsen & Felser, Reference Clahsen and Felser2006b, 2006a; Paradis, Reference Paradis2009; Ullman, Reference Ullman2001, Reference Ullman, VanPatten, Keating and Wulff2020). However, ERP language research increasingly demonstrates that even L1 processing deviates from “the norm.” This work indicates that L1 processing shows individual-level variability and highlights that L1 groups are not, as is often assumed, homogenous in their L1 processing (e.g., Grey et al., Reference Grey, Tanner and Van Hell2017; Kim et al., Reference Kim, Oines and Miyake2018; Kos et al., Reference Kos, Van den Brink and Hagoort2012; Nakano et al., Reference Nakano, Saron and Swaab2010; Pakulak & Neville, Reference Pakulak and Neville2010; Tanner & Van Hell, Reference Tanner and Van Hell2014).
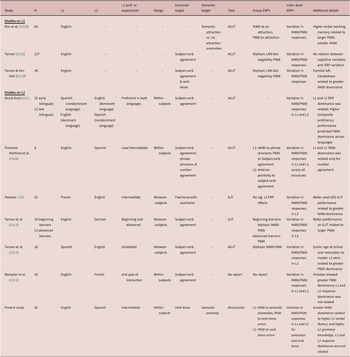
For example, building off of Osterhout (Reference Osterhout1997), Tanner and Van Hell (Reference Tanner and Van Hell2014) demonstrated that L1 English speakers exhibited individual variability in ERP responses to subject-verb agreement and verb tense errors during sentence processing. In the study, the grand mean analyses suggested a biphasic left anterior negativity (LAN)-P600 effect, a pattern that has been implicated in theoretical accounts of native and nonnative language morphosyntactic processing (e.g., Caffarra et al., Reference Caffarra, Mendoza and Davidson2019; Clahsen & Felser, Reference Clahsen and Felser2006b, Reference Clahsen and Felser2006a; Friederici, Reference Hahne and Friederici2002; Molinaro et al., Reference Molinaro, Barber, Caffarra and Carreiras2015; Molinaro et al., Reference Molinaro, Barber and Carreiras2011). However, examination of individual-level ERP responses with a Response Dominance Index (RDI) indicated that the apparent LAN-P600 biphasic pattern was a product of some individuals showing N400-dominant effects and others showing P600-dominant effects. N400 and P600 effects are both characterized by central-posterior scalp distributions and Tanner and Van Hell (Reference Tanner and Van Hell2014) argued that this overlap masked part of the N400 in the grand mean analyses, leaving the nonoverlapping distribution that appeared to be a left anterior negativity (for more detailed discussion on this perspective, see Caffarra et al., Reference Caffarra, Mendoza and Davidson2019; Molinaro et al., Reference Molinaro, Barber, Caffarra and Carreiras2015; Tanner, Reference Tanner2015, Reference Tanner2019). In sum, the group-level grand mean information obscured individual differences in N400- and P600-related mechanisms employed to process grammar information during L1 sentence comprehension (see also Grey et al., Reference Grey, Tanner and Van Hell2017). For summary information on this study and the related research reviewed in this section, see Table 1.
Summary of ERP studies on N400/P600 individual differences during sentence processing

†The information in this column is based on the descriptions and/or labels provided in the original studies. Prof. = proficiency; Indiv. = individual. *See also Grey et al. (Reference Grey, Tanner and Van Hell2017); AJT = acceptability judgment task, decision is meaning-focused; AGJT = acceptability/grammaticality judgment task, decision includes both meaning and form; GJT = grammaticality judgment task, decision is form-focused.
Tanner (Reference Tanner2019) further examined N400/P600 variability during grammar processing in a large cohort of L1 English speakers and obtained similar results. Grand mean analyses suggested a biphasic LAN-P600 pattern but when examining individual-level processing ERP responses to subject-verb agreement errors systematically varied, with some individuals showing N400-dominant effects and others showing P600-dominant effects. This pattern of N400/P600 individual differences was sustained regardless of whether agreement was based on inflectional morphology or lexical information and when using different sentence reading paradigms (Rapid Serial Visual Presentation or Self-Paced Reading). Tanner (Reference Tanner2019) also gathered measures of verbal working memory and language experience to examine whether these factors could help explain N400/P600 variability in grammar processing, but no relationships were found.
This individual-level N400/P600 variation in L1 is not limited to grammar processing. Kim et al. (Reference Kim, Oines and Miyake2018) investigated individual differences in L1 English speakers’ processing of verb-based semantic anomalies with or without semantic attraction (semantic attraction example: The hearty meal was *devouring with gusto; no semantic attraction example: The dusty tabletops were *devouring with gusto; *marks the anomaly; examples are from Kim et al., Reference Kim, Oines and Miyake2018). The group-level results indicated N400s for no-attraction sentences and P600s for attraction sentences, but at the individual-level the authors observed similar patterns of variability for semantic processing as observed for grammar by Tanner (Reference Tanner2019) and Tanner and Van Hell (Reference Tanner and Van Hell2014). Some individuals exhibited N400 effects, as would typically be expected for semantic anomalies, and others showed P600 effects. Kim et al. (Reference Kim, Oines and Miyake2018) assessed verbal and nonverbal working memory as well as language experience in relation to individuals’ N400/P600 effects and found that higher verbal working memory capacity was related to larger P600s and smaller N400s during semantic processing.
Notably, these individual differences in N400/P600 responses have also been observed for L2 learners. Tanner, McLaughlin, Herschensohn, and Osterhout (Reference Tanner, McLaughlin, Herschensohn and Osterhout2013) investigated the ERP correlates of subject-verb agreement processing in L2 German learners of varying proficiency compared to L1 German speakers and probed individual differences in processing. Grand mean results suggested that the L1 group and more advanced L2 learner group exhibited P600s during sentence processing whereas the less advanced L2 group showed a biphasic N400-P600 response. Individual-level analyses demonstrated that these learners varied along a similar N400/P600 dominance continuum as observed in the L1 studies discussed previously: some learners were N400-dominant and others were P600-dominant. Further, the magnitude of less and more advanced learners’ P600 effect was positively related to their behavioral ability to detect the L2 grammar errors on a grammaticality judgment test (GJT); this relationship was not observed for the L1 group.
In a subsequent study, Tanner, Inoue, and Osterhout (Reference Tanner, Inoue and Osterhout2014) examined N400/P600 individual differences in L1 Spanish–L2 English late bilinguals’ processing of L2 English grammatical agreement. The grand mean group-level ERP results indicated a biphasic N400-P600 response, but examination of individual-level ERP responses showed that participants varied in their L2 processing along an N400/P600 dominance continuum, as in Tanner et al. (Reference Tanner, McLaughlin, Herschensohn and Osterhout2013). The authors additionally assessed whether a host of language experience variables could explain this variability and found that earlier age of arrival to the L2 environment and higher motivation to master the L2 were associated with greater P600 dominance.
Finally, Pélissier (Reference Pélissier, Edmonds, Leclerq and Gudmestead2020) examined individual differences in intermediate L1 French–L2 English learners’ and a group of L1 English speakers’ processing of past tense verb morphology with auxiliaries. The group-level results indicated that only the L1 English speakers showed a P600. At the individual level, the results showed that both the L1 group and L2 learner group varied in their processing along an N400/P600 continuum, showing either an N400 in response to the grammar errors or a P600, but not both. The author also examined whether performance on a GJT administered after the EEG/ERP task related to ERP responses and found that performance on the GJT was positively correlated with N400 amplitude in the L2 learners, with no relationships observed for the L1 group.
Overall, these L2 ERP studies parallel the L1 work and, when considered together, this research indicates that native as well as nonnative language users exhibit systematic individual variation in whether they rely more on lexical/semantic access (N400) or repair/reanalysis (P600) mechanisms while processing semantic and grammar information during sentence comprehension. With respect to L2 ERP research, this complicates the general tendency of interpreting between-subjects L1 versus L2 differences as being due to a “deviant,” “nonnativelike” L2 system.
To develop a more sophisticated understanding of how L2 processing compares to L1, there is a need for work that examines L2 and L1 processing within-subjects during sentence processing. Very little research has done this, let alone investigate individual-level variability. In fact, of the 41 L2 grammar ERP articles published between 2002–2016, identified by and discussed in Bowden et al. (Reference Bowden, Grey, Reichle and Ullmanin preparation; see also Morgan-Short, Reference Morgan-Short2014), only one employed a within-subjects design (Tokowicz & MacWhinney, Reference Tokowicz and MacWhinney2005).
There are two unpublished reports and one published study that have tested L1 and L2 together using a within-subjects approach (Bice & Kroll, Reference Bice and Kroll2021; Finestrat Martinez et al., Reference Finestrat Martinez, Luque, Abugaber and Morgan-Short2018; Wampler et al., Reference Wampler, McLaughlin and Osterhout2014); each of the studies tested grammar processing but did not test semantic processing. Because these studies measured individual-level variability in N400/P600 ERP responses across L1 and L2 they are informative points of reference for the present work.
Wampler et al. (Reference Wampler, McLaughlin and Osterhout2014) measured L1 and L2 processing of subject-verb agreement in L1 English–L2 French learners in their second year of L2 instruction and found that participants demonstrated variability in their N400/P600 dominance for both their L1 and L2. This variability was not related between L1 and L2; that is, N400 (or P600)-dominant processing for L1 grammar was not related to N400 (or P600)-dominant processing for L2 grammar. Finestrat Martinez et al. (Reference Finestrat Martinez, Luque, Abugaber and Morgan-Short2018) tested a small group of L1 English-low/intermediate L2 Spanish learners and, like Wampler et al. (Reference Wampler, McLaughlin and Osterhout2014), observed variability in N400/P600 dominance for both L1 and L2. Of the three grammar structures they examined (word order, subject-verb agreement, noun phrase number agreement), L1 and L2 variability was related only for P600 magnitudes for noun-phrase number agreement. Finally, Bice and Kroll (Reference Bice and Kroll2021) investigated ERP individual differences in L1 Spanish–L2 English early heritage bilinguals’ and late L1 English–L2 Spanish bilinguals’ subject-verb agreement processing; they also included an L1 English monolingual control group. The results showed variability in N400/P600 responses in the bilinguals’ L1 and L2, in line with Wampler et al. (Reference Wampler, McLaughlin and Osterhout2014) and Finestrat Martinez et al. (Reference Finestrat Martinez, Luque, Abugaber and Morgan-Short2018). Further, L1/L2 proficiency was related to N400/P600 variation, with higher proficiency relating to more P600-dominant responses and smaller N400-dominant responses. The authors also note that bilinguals for whom L1 and L2 proficiency was roughly equivalent tended to show similar brain responses. To summarize, this small body of work indicates that N400/P600 processing of grammatical information varies systematically within individuals’ native and nonnative language, though the research is inconclusive regarding whether such variability is related across individuals’ two languages because the studies report different findings.
As mentioned in the preceding text, these L2 studies tested grammar, but not semantic, processing. In the L2 ERP literature as a whole, there are remarkably few reports of L2 sentence-level semantic processing (for review, see Bowden et al., Reference Bowden, Steinhauer, Sanz and Ullman2013) and conclusions from these studies are difficult to reconcile. This is partly because some of the work tested fluent bilinguals rather than L2 learners (Ardal et al., Reference Ardal, Donald, Meuter, Muldrew and Luce1990; Moreno & Kutas, Reference Moreno and Kutas2005) and partly because the studies that tested L2 learners compared L1 and L2 patterns between subjects (Bowden et al., Reference Bowden, Steinhauer, Sanz and Ullman2013; Fromont et al., Reference Fromont, Royle and Steinhauer2020; Hahne, Reference Hahne2001; Hahne & Friederici, Reference Hahne and Friederici2001; Newman et al., Reference Newman, Tremblay, Nichols, Neville and Ullman2012; Ojima et al., Reference Ojima, Nakata and Kakigi2005). Thus, although most of the small amount of work reports differences for L2 semantic processing, for example in N400 latency or distribution, explanations for these differences are poorly understood.
The present study
This study addressed two main issues in current L2 ERP sentence processing research. First, the research has centered on between-subjects L2 comparisons to L1 control groups or L1 ERP literature, largely with the assumption that the L1 is a homogenous point of comparison and group-level grand mean information is representative of the individuals within the group. Given that group-level grand mean-based L1 ERP work seems to not always accurately capture L1 processing, it seems likely that previous L2 comparisons to the L1 ERP literature or monolingual L1 control groups have not always accurately characterized L2 processing. Further, comparing L2 speakers to monolingual L1 groups (the “monolingual bias”) may not be an appropriate analytic approach more generally because bilinguals/L2 learners and monolinguals are fundamentally different in their language use and linguistic experiences (Ortega, Reference Ortega2013b, Reference Ortega2013a).
A second issue is that the majority of L2 ERP sentence processing research has tested grammar only, with remarkably few reports of sentence-level semantic processing. This is surprising given that prominent theoretical discussions of L2 processing posit differential reliance on lexical/semantic versus structural, morphosyntactic processes during L2 learning and development (Clahsen & Felser, Reference Clahsen and Felser2006b; Paradis, Reference Paradis2009; Ullman, Reference Ullman2001, Reference Ullman, VanPatten, Keating and Wulff2020). Furthermore, as the N400/P600 individual differences research continues to mount, including for L2, it is increasingly important to examine semantic processing patterns together with grammar processing patterns because the two ERP effects that are showing this systematic variation are qualitatively different, functionally dissociable brain responses generally linked with lexical/semantic access (N400) or structural repair/reanalysis (P600) processes. To address these issues, the study investigated the ERP correlates of L1 English and L2 Spanish semantic and grammar processing, within-subjects and from both group-level and individual-level perspectives.
Methods
Participants
Participants were recruited at a private university in a large city in the Northeast region of the United States of America. Thirty-eight participants were tested after providing written informed consent. Of these, 12 were excluded from data analysis: 3 were pilot participants, 8 had excessive EEG artifact (i.e., recorded activity that is not generated by the brain, such as eye blinks), and 1 set of data was lost due a testing session error. Data from 26 participants (4 males, 22 females; M age = 19.3 years) were therefore included in the analyses. This sample size is comparable to or exceeds samples sizes in related L2 ERP research, including the studies that inform the present work (see the Studies on L2 section in Table 1). According to calculations based on medium-sized effects in G*Power, 27 participants would be needed to satisfy 80% statistical power and the final sample size of 26 participants satisfies 78.8% statistical power.
All participants were right-handed (Oldfield, Reference Oldfield1971) native speakers of English who had learned Spanish as a nonnative second language beginning after the age of 6 years old in a foreign language classroom setting (M age of Spanish language learning onset = 11.3 years; SD = 2.8). On a language background questionnaire, 14 participants reported only having studied Spanish and 12 reported having studied other languages in addition to Spanish, including French, German, Hebrew, Italian, Latin, Mandarin, and Russian, with self-described proficiency in these languages ranging from beginner to advanced.
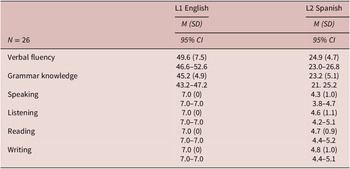
Participants were recruited mainly from the final course in the university’s required foreign language sequence, equivalent to an upper-intermediate Spanish language course, which utilized a content-based instructional approach that included grammar and vocabulary practice as well short-form literary reading comprehension and analysis. All participants had studied Spanish in high school and they had taken an average of 2.7 university-level Spanish language courses at the time of testing. Four participants were pursuing Spanish majors at the time of testing and nine were pursing Spanish minors. Although proficiency can be a challenging construct, a series of additional measures were gathered to help ascertain aspects of participants’ L1 and L2 abilities. Participants self-rated their Spanish and English proficiency and additionally completed independent tests of language ability consisting of Spanish and English semantic verbal fluency tasks and Spanish and English grammar knowledge tests, see Table 2 (for task administration, description, and coding information, see Online Supplementary Materials). Based on this information, participants are considered to be intermediate-level Spanish L2 learners.
Descriptive information on language ability

Notes. Grammar knowledge assessed using the Michigan English Language Institute College Entrance Test (MELICET) for English and the Diploma de Español como Lengua Extranjera (DELE) for Spanish, max. score = 50 each. Speaking, listening, reading, and writing were self-rated on a scale of 1–7 where 7 = “nativelike” and 1 = “beginning learner.”
Materials
Stimuli and sentence reading task
The study employed a sentence reading task with word-probe verification while EEG/ERP data were recorded. Stimuli for the sentence reading task were designed following the well-established violation paradigm (Grey & Tagarelli, Reference Grey, Tagarelli, Phakiti, de Costa, Plonsky and Starfield2018; Kaan, Reference Kaan2007), wherein the electrophysiological brain response to language errors, such as a semantic error or grammar error, is compared to correct items. Sentences were extended from and based on the stimuli used in the ERP study by Osterhout and Nicol (Reference Osterhout and Nicol1999).
Two sets of stimuli were used, one in English and one in Spanish. Stimuli across the two languages were equivalent in sentence length (6–15 words; English M = 10.3, Spanish M = 9.4) and they were all novel sentences, that is, they were not translations of each other. In both English and Spanish, the critical word (bold underlined words in Table 3) was in sentence-medial position to avoid potential end-of-sentence wrap-up effects (for a recent reflection on sentence wrap-up effects in ERP language research, see Stowe et al., Reference Stowe, Kaan, Sabourin and Taylor2018).
Example English and Spanish sentences used in the study

The target items in the study were correct declarative sentences and declarative sentences with a semantic error or grammar error in verb tense (see Table 3 for examples; for a complete list of sentence stimuli see Online Supplementary Materials). In each language, correct/semantic error/verb error sentences were distributed across four experimental lists in a Latin-square design such that no list contained two versions of the same experimental sentence. Each experimental list contained 240 sentences with 40 correct items, 40 semantic error items, 40 verb tense error items, and an additional 120 sentences (80 filler items and 40 combined semantic + verb tense error items that are not discussed here).
For each sentence that participants read, they performed a word-probe verification by indicating using a button press whether a visually presented word had appeared in the preceding sentence or not. For similar procedures, see Schacht et al. (Reference Schacht, Sommer, Shmuilovich, Martíenz and Martín-Loeches2014). In each list, 50% of the sentences were followed by a word (noun, verb, or adjective) that had appeared in the sentence (yes-probe), and 50% were followed by a word (noun, verb, or adjective) that had not appeared in the sentence (no-probe). Yes/no probes were evenly distributed across experimental conditions. For yes-probes, half the words had appeared before the critical word and half had appeared after; the word probe was never the critical word. Participants were instructed to read each sentence carefully and answer the word probe as quickly and accurately as possible. Sentences were presented in randomized order across six blocks of 40 sentences each.
Each trial began with a fixation cross for 350 ms followed by a sentence presented one word at a time in Rapid Serial Visual Presentation (RSVP) format. Words were presented for 350 ms each with a 200 ms ISI (interstimulus interval). After each sentence, the word probe appeared with a question mark; this remained on screen for 5,000 ms or until participants made their response, whichever event occurred first. The response hand (left/right) for “yes” was counterbalanced across participants. Between sentence trials, a screen with the word “Ready?” (or “¿Listo/a?” in Spanish) appeared. Participants were instructed to use this screen to blink or rest their eyes and were asked not to blink during the presentation of the sentences. Participants self-initiated the next trial with a button press.
Note that word-probe verification diverges from the predominance of acceptability/grammaticality judgment tasks in L2 ERP sentence processing research. Although acceptability/grammaticality judgment tasks are solidly grounded in the historical context of Second Language Acquisition research and appropriate for ERPs, asking participants to make such explicit evaluations of the language stimuli may affect ERP outcomes in nonnegligible ways (Martin-Loeches et al., Reference Martin-Loeches, Nigbur, Casado, Hohlfeld and Sommer2006; Schacht et al., Reference Schacht, Sommer, Shmuilovich, Martíenz and Martín-Loeches2014). Furthermore, all the previous work on individual differences in N400/P600 effects has asked participants to provide explicit judgments about the sentences using acceptability/grammaticality judgment tasks (see Table 1). It is worthwhile and important to determine whether the systematic variation observed across those studies is related to processing the sentences in the context of an explicit judgment task and implementing different task-solving strategies, as opposed to reflecting a natural tendency to employ different processing mechanisms during sentence comprehension (Pélissier, Reference Pélissier, Edmonds, Leclerq and Gudmestead2020). By using a task that does not require explicit metalinguistic evaluation, the present study can begin to address this point.
Procedure
Participants were tested in a single session lasting approximately 3 hours. Following the completion of a language background survey, participants were seated in a comfortable chair in a sound-attenuated room to complete the L1 English and L2 Spanish sentence reading tasks while EEG/ERP data were recorded. Practice was completed prior to the experimental lists and the order in which the L1 and L2 tasks were administered was counterbalanced across participants. After the L1 and L2 sentence reading/EEG tasks, participants completed a suite of behavioral tasks that assessed L1 and L2 abilities (see Table 2). Participants received $30 in Amazon gift cards for participating in the study.
EEG acquisition and analysis
Scalp EEG was recorded at a sampling rate of 1,000 Hz from 32 Ag/AgCl active electrodes (extended 10–20 system; Jasper, Reference Jasper1958) mounted in an elastic cap (Brain Products ActiCap, Germany). EEG was amplified with a BrainVision BrainAmp DC system (Brain Products, Germany) and filtered online with a .016–250 Hz bandpass filter. Scalp electrodes were referenced online to a vertex reference. Electrodes above and below the left eye and at the outer canthus of each eye, referenced in bipolar montages, monitored eye movements. Impedances were kept below 10kΩ.
EEG/ERP processing was carried out using EEGLAB (Delorme & Makeig, Reference Delorme and Makeig2004) and ERPLAB (Lopez-Calderon & Luck, Reference Lopez-Calderon and Luck2014) plugins in MATLAB (Version R2016_b). At the first stage of processing, a 30 Hz half-amplitude low-pass filter (24dB/octave roll-off) was applied to the data and scalp electrodes were re-referenced to the average activity from the right and left mastoids. Trials that were characterized by eye or muscle artifacts were excluded from analyses. ERPs were time-locked to the onset of the critical word for each sentence (the bold underlined words in Table 3) and averaged for the correct, semantic, and grammar (i.e., verb tense) conditions in each participant (200 ms prestimulus baseline) for L1 English and L2 Spanish.
To be included in the analysis, datasets had to retain at least 60% of trials (24/40 trials) in each condition after artifact rejection. Included trials represented both correct behavioral responses to the yes/no probes on the word-probe verification task and incorrect responses (note that performance was very high for this task in both languages, see “Results”). Trials included in the analysis were similar across English and Spanish: On average in L1 English, each participant’s final dataset contained 32 correct trials (SD = 5.06), 31 semantic error trials (SD = 4.82), and 31 grammar error trials (SD = 5.99). In L2 Spanish, each participant’s final dataset contained 32 correct trials (SD = 5.30), 32 semantic error trials (SD = 6.01), and 31 grammar error trials (SD = 5.76). Informed by previous research and visual evidence from the ERP waveforms, 300–500 ms and 500–900 ms time-windows were selected to capture N400 and P600 effects, respectively. These time-windows are representative of the ERP effects of interest and attested in the ERP language processing literature for L1 and L2 (e.g., Batterink & Neville, Reference Batterink and Neville2013; Gillon Dowens et al., Reference Gillon Dowens, Vergara, Barber and Carreiras2010; Grey et al., Reference Grey, Schubel, McQueen and Van Hell2019; Osterhout & Nicol, Reference Osterhout and Nicol1999; Tanner et al., Reference Tanner, Grey and van Hell2017).
Group-level analysis
The main interest of the present work is individual-level ERP patterns. Nonetheless, to parallel the analytical approaches conducted in the related research in this area (e.g., Tanner & Van Hell, Reference Tanner and Van Hell2014; Kim et al., Reference Kim, Oines and Miyake2018), group-level grand mean analyses were performed. Group-level analyses were conducted on data from lateral electrodes that were grouped into four regions of interest (ROIs): left frontal (F7, F3, FC1), right frontal (F8, F4, FC2), left posterior (CP5, CP1, P7, P3), and right posterior (CP6, CP2, P8, P4). This ROI approach aligns with analytical approaches in L1 and L2 ERP research, see, for example, Chow and Phillips (Reference Chow and Phillips2013), Grey et al. (Reference Grey, Tanner and Van Hell2017), Tanner and Van Hell (Reference Tanner and Van Hell2014) and the specific ROIs selected cover a similar distributional area as Tanner and Van Hell (Reference Tanner and Van Hell2014) and Grey et al. (Reference Grey, Tanner and Van Hell2017), who also examined N400 and P600 individual differences in sentence processing.
To minimize Type 1 error rate and following the suggestions of Luck and Gaspelin (Reference Luck and Gaspelin2017), the global ANOVAs contained a limited number of factors and step-down ANOVAs were only conducted for the main effects and interactions of theoretical interest in the study. Global ANOVAs included the factors Language (L1 English, L2 Spanish), Condition (correct, semantic error, verb tense error), Anterior/posterior (anterior, posterior), and Hemisphere (left, right) as within-subjects factors. Greenhouse–Geisser corrected p-values are reported for data with more than one degree of freedom in the numerator. Partial-eta squared effect sizes are reported with the ANOVA outcomes. Significant main effects of or interactions with the factors of Language or Condition were followed-up with step-down ANOVAs to clarify the effect.
Individual-level analysis
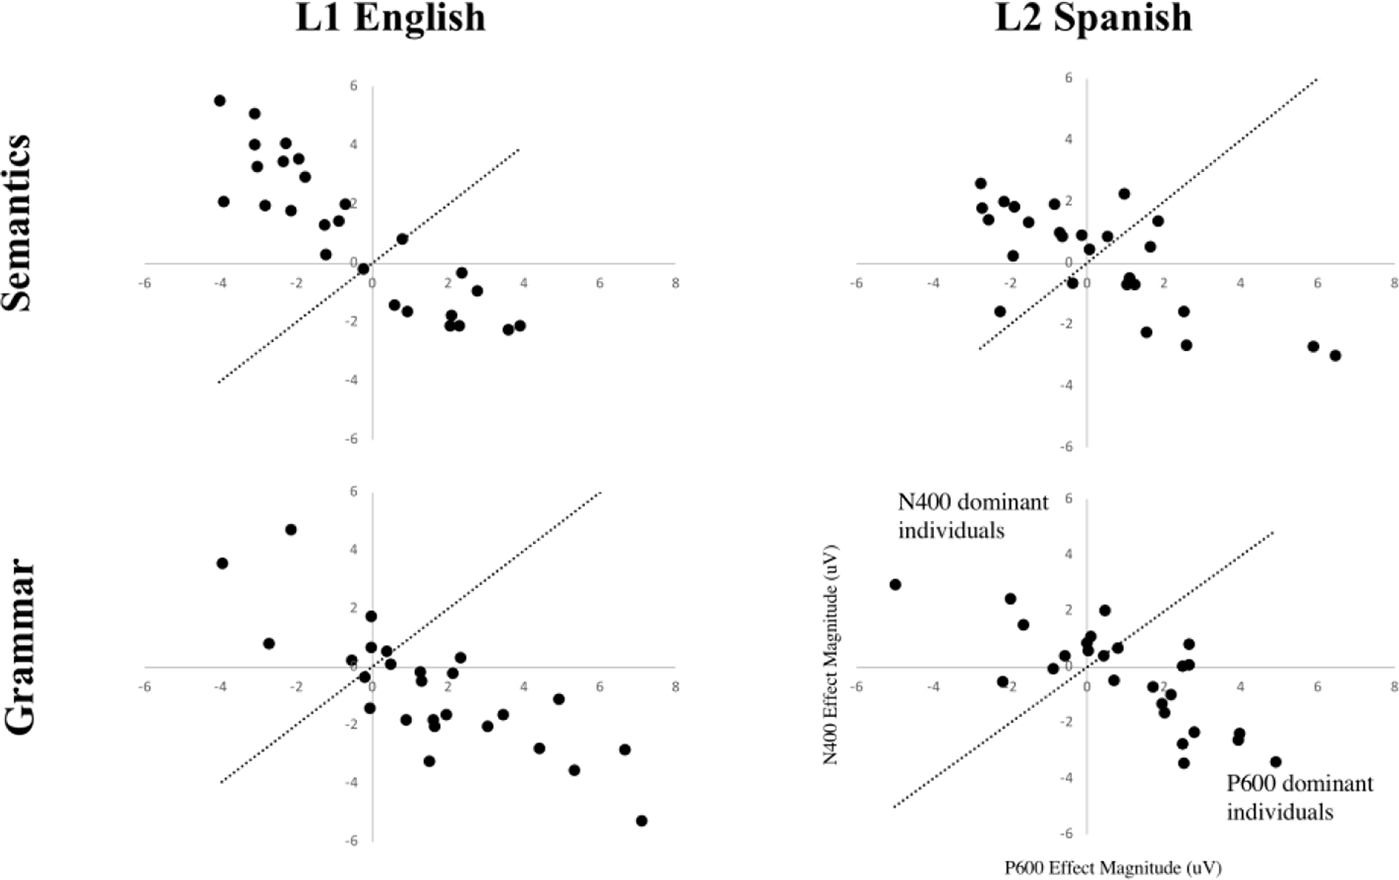
To examine patterns of individual-level variability in L1 and L2 semantic and grammar processing, each participant’s N400 and P600 effect magnitudes were calculated for both the semantic and grammar conditions. These effect magnitudes were calculated over a central-posterior ROI consisting of electrodes CP1, CP2, Cz, C3, C4, Pz, P3, and P4, where N400 effects and P600 effects are typically largest (for similar approaches, see e.g., Grey et al., Reference Grey, Tanner and Van Hell2017; Kim et al. Reference Kim, Oines and Miyake2018; Tanner & Van Hell, Reference Tanner and Van Hell2014). The effect magnitudes were then used to calculate each individual’s relative response dominance for N400 or P600 effects during L1 and L2 semantic and grammar processing. This metric, termed a Response Dominance Index (RDI), is made by fitting the individual’s least squares distance from the equal effect sizes line (the dashed line in Figure 4) with perpendicular offsets. An RDI value near zero indicates that the individual showed N400 and P600 effects of relatively equal size. More negative RDIs (above and to the left of the dashed line) indicate that an individual is N400-dominant in their processing of the linguistic target whereas more positive RDIs (below and to the right of the dashed line) indicate that an individual is P600-dominant. The equation for calculating the RDI follows (see also Grey et al., Reference Grey, Tanner and Van Hell2017; Tanner & Van Hell, Reference Tanner and Van Hell2014).
 $$ \mathrm{RDI}=\frac{\left(\mathrm{P}6{00}_{\mathrm{Error}}\hbox{--} \mathrm{P}6{00}_{\mathrm{Correct}}\right)\hbox{--} \left(\mathrm{N}4{00}_{\mathrm{Correct}}\hbox{--} \mathrm{N}4{00}_{\mathrm{Error}}\right)}{\sqrt{2}} $$
Results
Behavioral results for word-probe verification
For both L1 English and L2 Spanish, participants were highly accurate in deciding whether or not the word probes had appeared in the sentences. For English, mean word probe accuracy was 96.80 (SD = 1.81; 95% CI 96.1 – 97.7) and for Spanish, mean accuracy was 96.65 (SD = 2.28; 95% CI 95.7 – 97.6) with no significant difference between the two, t(25) = .530, p = .601.
Group-level ERP results
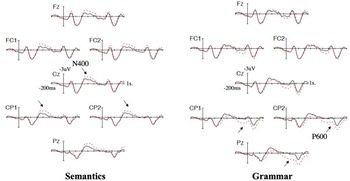
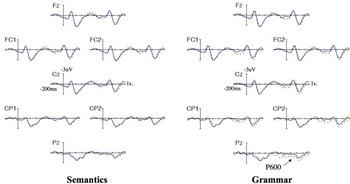
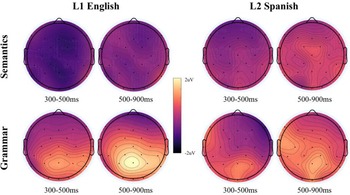
Grand mean ERP waveforms for L1 and L2 semantic and grammar conditions are presented in Figure 1 and Figure 2; Figure 3 presents topographic maps for these conditions. Visual examination of the ERP waveforms for L1 English suggested an N400 effect for semantics and P600 effect for grammar. For L2 Spanish, visual examination suggested no significant ERP effects for semantics and a P600 effect for grammar.
Grand mean ERP waveforms for L1 English semantic and grammar processing for correct (solid black line) and error conditions (semantic anomaly or verb tense; red dotted line). Each tick mark represents 100 ms; negative voltage is plotted up. These and all subsequent waveforms were filtered with a 15 Hz low-pass filter for presentation purposes only. The black arrows indicate the N400 (Semantics panel) and P600 (Grammar panel) effects.

Grand mean ERP waveforms for L2 Spanish semantic and grammar processing for correct (solid black line) and error conditions (semantic anomaly or verb tense; blue dotted line). Each tick mark represents 100 ms; negative voltage is plotted up. The black arrow indicates the P600 effect.

Topographical maps showing the scalp distribution of activity in the semantic anomaly minus matched correct condition and grammar error (verb tense) minus matched correct condition for L1 English and L2 Spanish, averaged for the 300–500 and 500–900ms time windows. Calibration scale is ±2μV.

Global ANOVA 300–500 ms time-window
The statistical results from the global ANOVA in the 300–500 ms time-window are summarized in Table 4. As can be seen, there were significant main effects for Language and Condition as well as significant interactions for Condition × Anterior/posterior, Language × Hemisphere, Language × Condition × Hemisphere, and Condition × Anterior/posterior × Hemisphere.
F-statistics from the grand mean ANOVA on mean ERP amplitudes in the 300–500 ms time window

Notes. Significant effects are in bold text. Cond. = Condition (correct, verb tense error, semantic error); AP = Anterior/posterior; Hemi. = Hemisphere.
Examining the significant main effect of language
Separate analyses were conducted for L1 English and L2 Spanish to examine the main effect of Language. Follow-up analysis for L1 English sentences showed a significant Condition × Anterior/posterior interaction, F(2,50) = 4.269, p = .033, ηp2 = .15 with no other significant effects. This interaction was due to ERPs elicited by semantic errors being more negative than ERPs elicited by correct items and verb tense errors, and ERPs elicited by verb tense errors being more positive than ERPs elicited by correct items and semantic errors, specifically in the posterior region: posterior main effect of Condition, F(2,50) = 11.320, p < .001, ηp2 = .31 (semantic error M μV = –1.311, SE = .295; verb tense error M μV = .236, SE = .200; correct M μV = –.455, SE = .354; anterior main effect of Condition, F(2,50) = 3.258, p = .052, ηp2 = .12). This outcome indicated an N400 effect for L1 English semantic errors and the onset of a P600 effect for L1 English verb tense errors.
For L2 Spanish sentences, the follow-up ERP analysis showed a significant Condition × Hemisphere interaction, F(2,50) = 4.757, p = .014, ηp2 = .16, which was qualified by a significant three-way Condition × Anterior/posterior × Hemisphere interaction, F(2,50) = 4.84, p = .015, ηp2 = .16. Further analysis on the three-way interaction indicated a significant Condition × Hemisphere interaction in the anterior region, F(2,50) = 11.53, p < .001, ηp2 = .32 that did not lead to any further significant effects in follow-up analyses (anterior left, main effect of Condition, F(2,50) = 1.637, p = .205, ηp2 <.10; anterior right, main effect of Condition, F(2,50) = 1.661, p = .200, ηp2 <.10; posterior region, main effect of Condition, ns; Condition × Hemisphere, ns). In sum, there were no discernible significant ERP effects for L2 Spanish sentences in this analysis.
Examining the significant Language × Condition × Hemisphere interaction
Analysis of the Language × Condition × Hemisphere interaction in the global ANOVA produced no significant effects, all ps > .10.
Examining the significant Condition × Anterior/posterior × Hemisphere interaction
Analysis of the three-way Condition × Anterior/posterior × Hemisphere interaction revealed in the global ANOVA showed a marginally significant main effect of Condition, F(2,50) = 3.135, p = .055, ηp2 =.11 and a significant Condition × Hemisphere interaction at the anterior region, F(2,50) = 3.897, p = .031, ηp2 =.14, which appeared to be due to ERPs elicited by semantic errors being more negative than ERPs elicited by correct items and verb tense errors, as indicated by a marginally significant main effect of Condition, F(2,50) = 3.230, p = .051, ηp2 = .11 (semantic error M μV = –0.822, SE = .328; verb tense error M μV = –.094, SE = .385; correct M μV = –.095, SE = .295). At the posterior region, there was a significant main effect of Condition, F(2,50) = 16.708, p < .001, ηp2 = .40, due to ERPs elicited by semantic errors being more negative than ERPs elicited by correct items and verb tense errors, and ERPs elicited by verb tense errors being more positive than correct items and semantic errors (semantic error M μV = –0.478, SE = .199; verb tense error M μV = .769, SE = .252; correct M μV = .247, SE = .246). This outcome indicated an N400 effect for semantic errors and the onset of a P600 effect for verb tense errors, effects that were driven by responses to L1 English sentences, as shown in the analysis on each language separately, reported in the preceding text.
Global ANOVA 500–900 ms time-window
The statistical results from the global ANOVA in the 500–900 ms time-window are summarized in Table 5. There was a significant main effect of Condition, a significant interaction for Condition × Anterior/posterior and a marginally significant Condition × Anterior/posterior × Hemisphere interaction.
F-statistics from the grand mean ANOVA on mean ERP amplitudes in the 500–900 ms time window

Notes. Significant effects are in bold text. Cond. = Condition (correct, verb tense error, semantic error); AP = Anterior/posterior; Hemi. = Hemisphere.
Examining the significant Condition × Anterior/posterior interaction
Follow-up analysis of the Condition × Anterior/posterior interaction demonstrated a significant main effect of Condition at the posterior region, F(2,50) = 11.101, p < .001, ηp2 = .31. This was due to ERP effects elicited by verb tense errors being more positive than ERPs elicited by correct sentences and semantic errors (semantic error M μV = .347, SE = .230; verb tense error M μV = 1.553, SE = .292; correct M μV = .478, SE = .231). This result confirms a P600 effect in response to verb tense errors, across both L1 English and L2 Spanish sentences.
To summarize, the group-level ERP results indicated an N400 effect for semantic errors in L1 English, with no significant ERP effects for L2 Spanish in this condition. For verb tense errors, results showed a P600 effect for L1 English and L2 Spanish.
Individual-level ERP results
As discussed, group-level information does not always reflect individual ERP responses within the group, and individuals can systematically vary in the processing approaches they employ during sentence comprehension (Grey et al., Reference Grey, Tanner and Van Hell2017; Kim et al., Reference Kim, Oines and Miyake2018; Tanner, Reference Tanner2019; Tanner & Van Hell, Reference Tanner and Van Hell2014). N400 and P600 effect magnitudes were significantly negatively correlated with each other for L1 semantics (r = –.897, p < .001), L1 grammar (r = –.815, p < .001), L2 semantics (r = –.722, p < .001), and L2 grammar (r = –.778, p < .001). This indicates that, within each language and linguistic domain, individuals tended to exhibit either a P600 or N400 response, but not both. Thus, they exhibited a trade-off between either showing P600-dominant responses or N400-dominant responses. This trade-off in N400/P600 effects parallels previous reports (e.g., Bice & Kroll, Reference Bice and Kroll2021; Kim et al., Reference Kim, Oines and Miyake2018) and the RDI information calculated from these effect magnitudes can shed further light on individual-level processing approaches that may be hidden in group-level analyses.
Figure 4 presents RDI scatterplots for the L1 and L2 semantic and grammar conditions. As can be seen, variability in whether participants exhibited N400 or P600 responses was present for both languages and linguistic domains. For L1 grammar, many individuals were P600-dominant in their ERP responses to verb tense errors, which indicates that they were relying on repair/reanalysis mechanisms while processing grammar information, but some individuals were N400-dominant, suggesting they were relying lexical/semantic mechanisms. Variability for L2 grammar was slightly higher: about half of individuals were P600-dominant and about half were N400-dominant.
Plot of individuals’ N400/P600 response dominance for L1 English semantic and grammar processing and L2 Spanish semantic and grammar processing. More negative RDIs (above and to the left of the dashed line) indicate that an individual is N400-dominant in their processing of the linguistic target whereas more positive RDIs (below and to the right of the dashed line) indicate that an individual is P600-dominant.

For semantic processing in L1, most individuals were N400-dominant, indicating they were relying on lexical/semantic mechanisms to process semantic information. However, approximately one third of individuals were P600-dominant, which implies these individuals relied more on repair/reanalysis mechanisms to process the same semantic information. Variability for L2 semantics was slightly higher than for L1, with about half of individuals being N400-dominant and about half P600-dominant.
To examine whether individuals’ N400/P600 dominance was related between linguistic domains or L1 and L2, RDI values for L1 and L2 semantics and grammar were entered into a correlation analysis (two-tailed). A positive correlation between RDI values would suggest that individuals tended to employ similar processing approaches (N400 or P600) between the linguistic domains, and/or between L1 and L2. There was a positive correlation between semantic and grammar RDIs for L1, r = .608, p = .001. No other significant relationships were observed (L2 semantics and grammar, r = .332, p = .097; L1 and L2 semantics, r = .015, p = .942; L1 and L2 grammar, r = .180, p = .378).
Exploring relationships between individual-level ERPs and language ability measures
Some of the previous work on N400/P600 individual differences has shown that language experience/ability factors can (Bice & Kroll, Reference Bice and Kroll2021; Tanner et al., Reference Tanner, Inoue and Osterhout2014) but do not always (Kim et al., Reference Kim, Oines and Miyake2018; Tanner, Reference Tanner2019) relate to the observed N400/P600 variability. To examine whether N400/P600-dominant L1 or L2 semantic or grammar processing was related to participants’ L1 or L2 abilities, participants’ RDI values were entered into a correlation analysis with L1 and L2 verbal fluency and L1 and L2 grammar knowledge; for descriptive information on these tasks, see Table 2.
The results showed that L2 semantic RDIs were significantly negatively correlated with L2 verbal fluency, r = –.543, p = .004. Thus, higher L2 verbal fluency was associated with greater N400 dominance (i.e., more negative RDIs) during L2 semantic processing. There were also significant negative correlations between L2 semantic RDIs and L2 grammar knowledge, r = –.464, p = .017, as well as between L2 grammar RDIs and L2 grammar knowledge, r = –.585, p = .002. This indicates that individuals with greater L2 grammar knowledge tended to show greater N400 dominance during both L2 semantic and L2 grammar processing. There were no significant relationships between L1 processing and language ability measures (L1 semantic RDIs and L1 verbal fluency, r = –.092, p = .654; L2 verbal fluency, r = .316, p = .115; L1 grammar knowledge, r = –.011, p = .565; L2 grammar knowledge, r = .331, p = .099; L1 grammar RDISs and L1 verbal fluency, r = .293, p = .147; L2 verbal fluency, r = .195, p = .339; L1 grammar knowledge, r = –.019, p = .352; L2 grammar knowledge, r = –.199, p = .330). For a report on correlations between the behavioral language ability measures of verbal fluency and grammar knowledge see Online Supplementary Materials.
Discussion
This study extended research on the ERP correlates of sentence processing in native and nonnative language by (a) examining L1 and L2 processing within-subjects, (b) probing individual-level variability in reliance on lexical/semantic or repair/reanalysis mechanisms, and (c) testing semantic in addition to grammar processing. The group-level results suggested that participants were engaging the commonly expected processing mechanisms for L1 grammar (P600) and L1 semantics (N400). For L2, the group-level results indicated that participants employed P600-related mechanisms for grammar, which has been observed more frequently for L2 at higher than lower proficiency levels. For L2 semantics, which is rarely examined in L2 ERP sentence processing research, no significant ERP effects were observed at the group level.
Analysis of individual-level ERP patterns provided more nuanced details on participants’ language processing. For both languages and linguistic domains, individuals varied in whether they relied on lexical/semantic (N400) or repair/reanalysis (P600) mechanisms. This variability was not found to be related between L1 and L2 and was slightly higher for L2 than L1, with some of the L2 variability relating to L2 verbal fluency and grammar knowledge abilities.
The finding that the group-level grand mean ERP analyses did not fully represent the L1 or L2 processing profiles of the individuals within the group adds to the growing number of studies that have obtained similar results for L1 and L2 grammar processing (e.g., Bice & Kroll, Reference Bice and Kroll2021; Finestrat Martinez et al., Reference Finestrat Martinez, Luque, Abugaber and Morgan-Short2018; Grey et al., Reference Grey, Tanner and Van Hell2017; Osterhout, Reference Osterhout1997; Tanner, Reference Tanner2019; Tanner et al., Reference Tanner, Inoue and Osterhout2014; Tanner et al., Reference Tanner, McLaughlin, Herschensohn and Osterhout2013; Tanner & Van Hell, Reference Tanner and Van Hell2014; Wampler et al., Reference Wampler, McLaughlin and Osterhout2014) and the small amount of work that has been done on semantic processing, in L1 only (Kim et al., Reference Kim, Oines and Miyake2018). This body of research contributes importantly to our understanding of L2 processing and how it compares to L1.
As discussed in the “Introduction,” nearly all existing L2 ERP research has compared L2 processing to L1 ERP literature or separate L1 control groups. With this approach, deviations from benchmark L1 patterns have been interpreted as reflecting a nonoptimal, “nonnativelike,” “immature,” or “deficient” L2 system. For example, one predominant trend that has emerged in L2 ERP literature over the last 15 years is that at lower L2 proficiency, learners exhibit N400s to L2 grammar (e.g., McLaughlin et al., Reference McLaughlin, Tanner, Pitkanen, Frenck-Mestre, Inoue, Valentine and Osterhout2010)—potentially because they are processing grammar features using lexical associations or pattern matching—whereas at higher proficiency, they are considered more likely to show P600s during L2 grammar processing (e.g., Morgan-Short, Reference Morgan-Short2014; Van Hell & Tokowicz, Reference Van Hell and Tokowicz2010). This has implied that the process of adult nonnative language learning involves a neurocognitive progression from employing “nonnativelike” lexical/semantic N400 mechanisms during L2 grammar processing to using “nativelike” P600 repair/reanalysis processes. However, as has been demonstrated here and evidenced in the related reviewed research, highly proficient L1 speakers show N400s for their processing of grammar information. Thus, the perspective that N400s for L2 grammar processing underlie a “deviant” or nonoptimal language system is difficult to clearly support.
Variability during grammar processing
The finding that individuals demonstrated systematic variability in whether they were N400-dominant or P600-dominant during grammar processing parallels the previous research for L1 (Tanner, Reference Tanner2019; Tanner & Van Hell, Reference Tanner and Van Hell2014) and for L2 (Tanner et al., Reference Tanner, Inoue and Osterhout2014; Tanner et al., Reference Tanner, McLaughlin, Herschensohn and Osterhout2013), including the few L1/L2 within-subjects sentence processing studies (Bice & Kroll, Reference Bice and Kroll2021; Finestrat Martinez et al., Reference Finestrat Martinez, Luque, Abugaber and Morgan-Short2018; Wampler et al., Reference Wampler, McLaughlin and Osterhout2014). The patterns observed here reinforce that individuals do not uniformly engage the oft-expected structural repair/reanalysis P600 processes when they encounter language grammar information, in L2 or L1. Rather, some individuals, and in this study approximately one third of individuals for the L1 and 1/2 for their L2, employed lexical/semantic processes to handle the same grammar information. Although this study has framed the observed N400/P600 variation in terms of lexical/semantic access versus repair/reanalysis mechanisms, the results can be interpreted more broadly within other theoretical frameworks.
Fromont, Steinhauer, and Royle (Reference Fromont, Steinhauer and Royle2020), for example, used a similar stimuli design as the present study and observed biphasic N400-P600 effects across all of their experimental conditions (syntactic violation, semantic anomaly, combined syntactic + semantic anomaly) in L1 French speakers. They suggest that N400s in response to syntactic violations reflect a mismatch between a predicted word stem and the presented stimulus, and that this mechanism takes place simultaneously with lexical/semantic processing. Ultimately, they argue that results from balanced ERP stimuli designs (as was used in the present study) provide evidence against “syntax-first” approaches to sentence processing. This has implications for our understanding of what to expect from L1 speakers’ sentence processing and, by extension, what to expect from L2 learners’ sentence processing.
The finding that some individuals exhibited N400s in response to L1 and L2 grammar information may alternatively be a reflection of these individuals using a “good enough” processing approach wherein they rely on shallow lexical or heuristic processing more than on detailed, rule-based grammatical processing (for a review on “good enough” language processing, see Karimi & Ferreira, Reference Karimi and Ferreira2016). Aligning with this, the N400 has been theoretically linked with shallower lexical and heuristic processing and the P600 with more detailed, rule-based processing (e.g., Kuperberg, Reference Kuperberg2007; Tanner, Reference Tanner2011). This may thus be one theoretical dimension along which the participants in the present study varied in their grammar processing.
The fact that RDIs in L1 and L2 processing of grammar information were not related to each other indicates that N400-dominant participants did not have an individual tendency to default to “good enough” processing of grammar across their two languages. In fact, shallow lexical and heuristic processing seemed to be more likely for L2 than L1 grammar as indicated by the greater number of individuals who showed N400-dominant responses to L2 grammar than L1 grammar (see Figure 4). This suggests that L2 learners are more likely use “good enough” processing for grammar and interpreting the results from a “good enough” approach paves the way for research on what factors differentiate whether and when individuals use “good enough” processing in their L1 and L2.
Another theory that the present results relate to is the Declarative/Procedural (DP) Model of Language (e.g., Ullman, Reference Ullman2001, Reference Ullman2004, Reference Ullman, Hickok and Small2016, Reference Ullman, VanPatten, Keating and Wulff2020). In the DP model, L2 learners at lower levels of proficiency are predicted to rely on the declarative memory system to process both lexical/semantic and grammar information, and the model links N400s to declarative memory processing. With increased proficiency, L2 learners are predicted to gradually shift reliance to procedural memory for grammar processing, with procedural memory processing linked to the elicitation of LANs (with P600s) in response to grammar violations. Within the model, then, individuals who were N400-dominant in response to L1 or L2 verb tense errors may have been relying on declarative memory. However, aside from linking N400s to declarative memory, the model does not seem to account for the observation in this study and related research (see Table 1) of individual variability and N400s in response to L1 grammar. In particular, it will be interesting to consider what the findings for individual-level variability in N400/P600 dominance may entail for the model’s L1 and L2 ERP predictions, which have been informed mainly by between-subjects, group-level L1 and L2 ERP language research.
This study’s findings can also be interpreted with respect to the Shallow Structures Hypothesis (SSH; Clahsen & Felser, Reference Clahsen and Felser2006b, Reference Clahsen and Felser2006a, Reference Clahsen and Felser2018). The basic premise of the SSH is that L2 grammar may not be specified enough to provide the kinds of detailed structural information that are needed to process L2 grammar in an L1-like way. Thus, L2 learners parse L2 sentences shallowly—relying more on lexical, pragmatic, semantic, and other information, but less so or not at all on the more detailed, complex grammatical information that L1 speakers would use. Notably, shallow processing is not unique to the L2. L1 speakers can also use shallow processing, as noted by Clahsen and colleagues and shown in the “good enough” processing research (e.g., Karimi & Ferreira, Reference Karimi and Ferreira2016). Overall, the SSH claims that grammatical processing in L2 learners may be less robust than that of L1 speakers and that “L2 processing tends to rely more on nongrammatical information than on the grammatical route to interpretation” (Clahsen & Felser, Reference Clahsen and Felser2018, p. 701).
From an SSH perspective, the study’s findings indicate that, for L2 grammar, some participants exhibited shallow processing as evidenced by their N400-dominance when processing verb tense errors. However, L2 grammar processing was not restricted to shallow processing and was as robust as what might be expected from L1 speakers, as shown in the group-level P600 effect for L2 grammar and the P600-dominant effects observed at the individual level. The SSH, like the DP model, has been formulated based on L1/L2 between-subjects comparisons (Clahsen & Felser, Reference Clahsen and Felser2018) and it therefore does not seem to be quite articulated enough to capture the present study’s within-subjects, individual-level findings for L1 and L2 processing. With increased N400/P600 individual differences research in the second language acquisition and bilingualism fields, theoretical models of adult L2 learning and processing may need to incorporate more nuanced predictions that can more directly account for the patterns of systematic interindividual variability being observed within and across L1 and L2 (e.g., Bice & Kroll, Reference Bice and Kroll2021; Finestrat Martinez et al., Reference Finestrat Martinez, Luque, Abugaber and Morgan-Short2018; Wampler et al., Reference Wampler, McLaughlin and Osterhout2014).
Variability during semantic processing
In addition to grammar, the study also tested semantic processing. The results of variability in whether individuals relied on N400 or P600 mechanisms to process L1 semantic information are in line with Kim et al. (Reference Kim, Oines and Miyake2018). These results show that individuals varied in whether they relied on lexical/semantic access mechanisms or structural reanalysis mechanisms to process the semantic information. Observing P600s to the semantic anomalies may indicate that the same underlying neurocognitive resources are recruited for syntactic and semantic integration (Fromont et al., Reference Fromont, Royle and Steinhauer2020). The finding that individuals also varied in their processing of L2 semantic information, which had not yet been examined from an L1/L2 within-subjects, individual-level perspective, highlights the general systematicity of individual differences in the ERP correlates of sentence processing. Overall, the study’s findings underscore that language users follow multiple routes to comprehension, in the L1 as well as L2, and for both semantic and grammar domains of language.
Of note also is that the present study used a word-probe verification task, which diverges from the acceptability/grammaticality judgment tasks used in all of the previous reports on this systematic variability. This suggests, similar to the findings of Tanner (Reference Tanner2019) for stimuli presentation type, that the variability is not tied to the type of task participants are asked to carry out but rather seems to reflect a natural tendency for individuals to vary in the mechanisms they rely on during sentence processing.
This is not to say, however, that task effects can be excluded as such effects on ERP correlates of language are well-documented (e.g., Hahne & Friederici, Reference Friederici2002; Osterhout & Mobley, Reference Osterhout and Nicol1999; Nieuwland, Reference Nieuwland2014; Schacht et al., Reference Schacht, Sommer, Shmuilovich, Martíenz and Martín-Loeches2014). It could be the case, for example, that the lack of group-level N400 effects for L2 semantics was related to not drawing participants’ attention to well-formedness of the sentences within an acceptability/grammaticality judgment paradigm. For example, Schacht et al. (Reference Schacht, Sommer, Shmuilovich, Martíenz and Martín-Loeches2014) found that the N400 response to semantic anomalies in Spanish L1 speakers was smaller in amplitude when using a word-probe verification task than a grammaticality judgment task. However, as has been highlighted throughout this article, caution seems warranted in interpreting ERP effects—or a lack of ERP effects—at the group level because group-level results may not accurately reflect the ERP responses of all individuals in the group. Indeed, the individual-level results in this study show that participants were sensitive to L2 Spanish semantics in the word-probe task, even in the absence of being oriented to well-formedness—they were simply variable in whether they showed N400-dominant or P600-dominant brain responses, and this variability was comparable to that found in related research that has used acceptability/grammaticality judgment paradigms (see Table 1). Nonetheless, further examination of potential task effects on the patterns of N400/P600 variability in L1/L2 sentence processing will be warranted in future research.
Relationships between variability in brain responses and other factors
The negative correlation observed between N400 and P600 effect magnitudes indicates a trade-off relationship between the two ERP effects (Kim et al., Reference Kim, Oines and Miyake2018; Tanner & Van Hell, Reference Tanner and Van Hell2014; Tanner, Reference Tanner2019). Kim et al. (Reference Kim, Oines and Miyake2018) hypothesize that this trade-off arises due to brain responses competing with each other for expression, such that one occurs when the other does not, or stronger expression of one (i.e., larger effect magnitudes) corresponds to weaker expression of the other (i.e., smaller effect magnitudes). Similarly, Tanner et al. (Reference Tanner, McLaughlin, Herschensohn and Osterhout2013) suggest that this trade-off may be explained by processing models that posit a competitive dynamic between a shallower lexical processing stream and a more abstract, rule-based processing stream. The current study’s results support these perspectives of a competitive trade-off and provide evidence that the trade-off manifests within individuals’ L1 and L2 and for both semantic and grammar processing.
Although systematic interindividual variability in ERP responses was observed for both languages and linguistic domains, this variability was not related between individuals’ native and nonnative language. That is, individuals who demonstrated N400-dominance for L1 grammar processing did not also tend to demonstrate N400-dominance for L2 grammar processing (and vice versa for P600 responses). This aligns with Wampler et al. (Reference Wampler, McLaughlin and Osterhout2014) and Finestrat Martinez et al. (Reference Finestrat Martinez, Luque, Abugaber and Morgan-Short2018; interpret with caution because they report only eight participants; see Table 1). However, the lack of a relationship contrasts partially with Bice and Kroll (Reference Bice and Kroll2021) who found that individual-level ERP variation showed some overlap between L1 and L2 grammar processing.
Learners’ L2 proficiency level may explain these outcomes. Bice and Kroll tested fluent heritage bilinguals and proficient late bilinguals and suggested that language processing proceeds similarly in an individual’s two languages once proficiency in each language approaches similar levels. In contrast, the learners in Wampler et al. were only in their second year of L2 instruction, those in Finestrat Martinez et al. were classified as low/intermediate proficiency, and those tested in the present study were classified as intermediate proficiency. These lower proficiency learners may have not yet reached an L2 proficiency level at which their L2 and L1 processing preferences, be they N400-based or P600-based, converge. This lack of an L1–L2 relationship, for grammar or semantics, suggests that individual language processing preferences for L1 are not automatically transferred to the L2 and that L2 processing exhibits its own pattern of differential reliance on lexical/semantic or repair/reanalysis mechanisms during sentence processing, at least when L1/L2 proficiency is unbalanced and/or not at similarly high levels.
Recall that the group-based L2 ERP research has indicated a potential neurocognitive progression from N400 to P600-based processing (of grammar). The findings from the present study and future within-subjects, individual-level research may lead to a modification of that perspective. Specifically, rather than a progression from N400s to P600s as indicating that L2 grammar processing becomes more “nativelike,” it may be that a fruitful framework for elucidating similarities or differences between L1 and L2 is probing whether, and under what conditions, individuals’ language processing preferences align between their two languages, that is, whether and under what conditions individuals employ similar mechanisms for L2 comprehension as they do for L1, be they N400-based mechanisms or P600-based mechanisms. This individualized language processing perspective could apply to semantic processing as well and thus offers a broad yet comprehensive electrophysiological framework for understanding L1 and L2 sentence processing, for which L2 research and theory has focused mainly on explaining grammar. Continued research in this area will shed further light on the relationship between L1 and L2 at the level of individual differences in brain processes related to real-time language processing.
From the perspective of individual variation, it is of interest to not only illuminate the systematic individual differences in neural correlates of language but also attempt to identify the sources of this variation. Indeed, several of the N400/P600 individual differences studies discussed in this article attempted to uncover potential sources. For L1 semantic processing, Kim et al. (Reference Kim, Oines and Miyake2018) provided evidence that verbal working memory may be one source underlying N400/P600 variability. In their study, higher verbal working was linked with larger P600s and smaller N400s during semantic processing. For grammar processing, Bice and Kroll (Reference Bice and Kroll2021) observed that higher working memory was related to larger N400s and smaller P600s in the monolingual L1 control group whereas Tanner (Reference Tanner2019) did not find any relationships between N400/P600 responses and language experience/knowledge or cognitive factors in L1 speakers, including for working memory. The present study, though it did not focus on the potential sources of individual variation, similarly did not observe relationships between N400/P600 responses and L1 experience/knowledge.
In some studies, higher variability and an increased likelihood of N400 effects during L1 grammar processing has been related to the biological factor of self or familial left-handedness (Grey et al., Reference Grey, Tanner and Van Hell2017; Kos et al., Reference Kos, Van den Brink and Hagoort2012; Tanner & Van Hell, Reference Tanner and Van Hell2014). In this study, all participants were right-handed; seven reported having a left-handed blood relative (i.e., familial left-handedness). Of the seven, three were N400-dominant during L1 grammar processing. Only one of these three was also N400-dominant during L2 grammar processing. This information suggests that familial left-handedness was unlikely to be a contributor to the variability observed here for L1 or L2 grammar processing.
Although L1 processing was not linked with any of the assessed language experience/knowledge factors in the present study, L2 processing did show relationships with these factors. Related individual differences work (which studied L2 grammar only) has observed relationships between cognitive measures and N400/P600 individual differences. For example, Faretta-Stutenberg and Morgan-Short (Reference Faretta-Stutenberg and Morgan-Short2018a) found that working memory performance and procedural memory ability related to increased ERP magnitudes following a study abroad experience. These relationships were observed regardless of whether individual learners showed P600s or N400s to L2 syntactic violations. However, in an examination of the same learners’ processing of morphosyntactic gender agreement, Faretta-Stutenberg and Morgan-Short (Reference Faretta-Stutenberg and Morgan-Short2018b) observed no significant relationships between L2 processing and the language experience factors of initial L2 proficiency measured before beginning study abroad or reports of L2 contact during study abroad.
The current study revealed relationships between L2 processing and L2 verbal fluency and L2 grammar knowledge. The interpretations offered here are tentative and work with larger sample sizes will help to confirm or complicate them. The relationship between L2 verbal fluency and N400-dominance for L2 semantics indicates that individuals with higher L2 verbal fluency tended to be more N400-dominant when processing semantic information. The verbal fluency task used in the study was a semantic fluency task, which represents lexical knowledge and indexes word retrieval efficiency under time pressure (Portocarrero et al., Reference Portocarrero, Burright and Donovick2007; Rosselli et al., Reference Rosselli, Ardila, Araujo, Weekes, Caracciolo, Padilla and Ostrosky-Solí2000; Santilli et al., Reference Santilli, Vilas, Mikulan, Caro, Muñoz, Sedeño and García2019). From this perspective, the observed relationship suggests that individuals with greater L2 lexical knowledge and more efficient lexical access are more likely to exploit these skills and employ lexical/semantic mechanisms to process semantic information during L2 sentence comprehension.
Regarding the factor of L2 grammar knowledge, higher L2 grammar knowledge was related to greater N400-dominance for both L2 semantic and L2 grammar processing. This implies that with increasing grammar knowledge/ability in the L2, individuals are more likely to rely on lexical/semantic mechanisms to process L2 semantic as well as L2 grammar information. This finding may seem counterintuitive because one might expect that higher grammatical abilities correspond with more reliance on structural reanalysis P600 processes, at least for grammar. This is not a straightforward expectation for L2, however. Tanner et al. (Reference Tanner, McLaughlin, Herschensohn and Osterhout2013), for example, observed that higher behavioral ability to detect L2 grammar errors during a grammaticality judgment test was related to higher P600 magnitudes, but Pelíssier (Reference Pélissier, Edmonds, Leclerq and Gudmestead2020) found that post-EEG GJT performance was related to greater N400-dominance.
The relationship found here for L2 semantics and grammar may be related to the L2 grammar knowledge test used in the study. In the test, participants selected responses to each item from a list of options in multiple-choice format (see Online Supplementary Materials for details). This means they only had to recognize the correct response, rather than produce/compute it on their own. This format arguably lends itself to using lexically based recognition processes over grammar-based, structural processes. Therefore, participants may have been using lexical knowledge of grammar-related information to complete the test. Taken together, the results for L2 verbal fluency and L2 grammar knowledge (which were positively correlated, R = .440, p = .024; see Online Supplementary Materials) suggest that individuals with greater L2 lexical abilities are more likely to rely on lexical/semantic processes during real-time L2 comprehension. Linking this back to the theoretical perspectives discussed earlier, this points to individuals with greater L2 lexical abilities being more likely to employ “good enough” processing during sentence comprehension or, within the DP model, being more likely to rely on declarative memory.
To summarize, this study contributes to the small amount of existing within-subjects ERP work on L1/L2 sentence processing, and it provides intriguing information on potential links between behavioral L2 abilities and individual differences in the neural correlates of L2 sentence processing. Nonetheless, as noted by Tanner (Reference Tanner2019), there is not yet “a clear picture of what cognitive, experiential, or neuroanatomical differences might underlie the individual differences” (p. 223). Future studies in this area will help to clarify the various sources that contribute to individual variability in ERP responses during language processing, for L2 as well as L1.
Finally, it is of note that these relationships were observed for individuals’ L2 processing but not their L1. This may be explained by higher variability in L2 making relationships between behavioral individual differences and neural individual differences more pronounced. For L2 semantics and grammar, the RDI results showed that about half of individuals were N400-dominant and about half were P600-dominant (see Figure 4); this variation was slightly higher than that observed for L1. L2 processing in general is considered to be more variable than L1 processing and that held true in this study. Interestingly, L2 grammar and L2 semantic processing were comparable in their variation; that is, N400/P600 response dominance variation was not notably higher in one domain or the other. L2 grammar processing is generally viewed as being more variable during sentence comprehension than L2 semantic processing (e.g., Bowden et al., Reference Bowden, Steinhauer, Sanz and Ullman2013; Morgan-Short, Reference Morgan-Short2014). However, the current results demonstrate that this is not necessarily the case and point to a need for more ERP research on L2 semantic processing in sentence-level contexts to better understand the neurocognition of this language domain in L2 users.
Conclusion
This is the first ERP study, to the author’s knowledge, to examine L1 and L2 semantic and grammar processing, together, using a within-subjects, individual-level approach for sentence comprehension. This study and the work that inspired it offer a compelling foundation upon which to continue to examine individual differences in the electrophysiological correlates of native and nonnative sentence processing. Future research should aim to illuminate whether and under what conditions the neural processes underlying individual processing preferences between languages align. Overall, the findings of systematic individual differences in the neural correlates of sentence processing, across both languages and linguistic domains, offer new insight into native and nonnative language processing and how they compare, particularly with respect to the different processing routes that individuals take during language comprehension.
Supplementary Materials
To view supplementary material for this article, please visit http://doi.org/10.1017/S0272263122000055.
Acknowledgment
This research was supported by a Language Learning journal Early Career Research grant and a Fordham University faculty grant to Sarah Grey. Aspects of this work were presented at the 2018 annual meeting of the Society for Neurobiology of Language and the 2018 Second Language Research Forum. Special thanks to Crystal Thornebrooke, Valerie Márquez-Edwards, and Clare Shanahan for assistance on experimental design and to the members of the EEG lab for Language and Multilingualism Research at Fordham University for assistance with data collection and coding. Preparation of the manuscript was supported by a Fordham University Faculty Fellowship.