

I. Introduction
Many have raised the alarm over mounting caseloads in the federal courts. In his seminal work in the mid-1980s, Judge Richard Posner referred to the increasing volume of cases that federal judges oversee as fostering a “crisis” in the courts, necessitating swift institutional reform (Posner Reference Posner1985). In 1989, Judge Jon Newman shared a similar sentiment, writing, “We have now reached, and may have passed, the point where the increase in federal court cases poses a serious and substantial risk to the nature and quality of the federal judicial system” (Reference Newman1989, 762–63). Indeed, a significant number of commissions, committees, and conferences have commenced over the past three decades related to concerns over judges’ work environment.Footnote 1
Scholars and practitioners have pointed to several potential deleterious consequences of high caseloads. Again, according to Judge Newman (Reference Newman1989), rising caseloads have threatened “three distinct though related aspects of the federal court system: the quality of federal judges, the quality of their work, and the functioning of the federal court system” (763). Concerning work quality and function, Judge Diarmuid O’Scannlain (Reference O’Scannlain2009) noted that responsibilities that have in the past fallen on judges have in recent years been relegated to their staff. According to Judge O’Scannlain, “Impossibly large dockets and administrative responsibilities have forced us to create a system that might be called, with only slight exaggeration, ‘assembly-line justice’” (476). Some have questioned whether the added stress and toil borne by judges in high-caseload courts creates morale problems, or possibly even drives judges to depart the bench earlier than they would have otherwise to seek career opportunities elsewhere (Yoon Reference Yoon2003, Reference Yoon2005). Indeed, Spriggs and Wahlbeck (Reference Spriggs and Wahlbeck1995) observed that caseloads that were a statistically significant cause of appeals court judges’ exits from office, and Barrow and Zuk (Reference Barrow and Zuk1990) and Hansford, Savchak, and Songer (Reference Hansford, Savchak and Songer2010) have observed similar consequences for district court judges.
Alternatively, others have argued that mounting caseloads have not resulted in a crisis for the courts. Indeed, nearly 30 years have passed since Judge Posner’s admonitions, and yet the courts continue to function today at a presumably high level. This has led to an argument that judges were underworked in decades prior to the 1980s, rather than overburdened since that time (Baker Reference Baker2006). Moreover, subsequent gains in efficiency may have mitigated concerns over higher case volumes (Baker Reference Baker2006; Posner Reference Posner2006). And in this perspective, increased reliance on more and better trained staff over time is not perceived to be of detriment to the system of justice (see Baker [2006] for an overview of this literature). Or it could be that service of senior status judges has helped alleviate docket pressures.
Some of these disagreements stem, at least in part, from how scholars and practitioners have understood and measured caseload. We argue that scholars must carefully consider how one tabulates both the number of cases a given court oversees and the number of judges serving on a given court. Scholars have used various measures of workload, oftentimes without elaboration on which measure is most appropriate to the theoretical question of interest. So that scholars can choose a measure(s) that most closely relates to their substantive question, we offer here a multiplicity of indicators for the district courts available over a substantial period of time, 1964–2012. We consider both the measurement of the numerator, the number of cases a given court undertakes in a given period of time, and the denominator, the number of judges serving on a court. We direct scholars to a new measure of caseload that uses weighted case filings as the numerator and that accounts for the service of active judges, senior judges, and vacancies as the denominator.
II. Measuring Caseload
To understand how and why the work environment of judges affects the federal judicial system, scholars and practitioners must rely upon valid and reliable measures of caseload. There are a number of issues researchers should keep in mind when choosing a caseload measure. First, one should consider carefully whether cases commenced (filings), terminations, or pending cases are most appropriate to the research question. If filings are considered to be the preferred measure, then researchers must determine whether raw or weighted case filings should be used. Filings (perhaps obviously) are the number of cases commenced in a given period of time, terminations chart the number of cases completed for that same period, and pending refers to the number of cases remaining at the end of that period.
So that researchers can select the caseload measure that is most appropriate for their research question, we have collected a number of indicators of the concept. Using the annual reports of the Administrative Office of the US Courts, for each district court annually from 1964 to the present, we provide data on the total cases commenced (filings), total cases terminated, total cases pending, and weighted case filings—where weighted case filings are reported as weighted filings divided by authorized judgeships.Footnote 2 For commenced, terminated, and pending, the data are available broken down by civil cases (table C-1) and criminal cases (table D-1).Footnote 3 Because scholars may have interest in criminal filings, or civil terminations, or total pending cases, we opted to record each of these series annually per district court from 1964 to 2012.Footnote 4 As we discuss in Section III, we tabulate three distinct denominators for each series. Our efforts resulted in over 43,000 observations for our period of analysis.
Cases Commenced, Terminated, and Pending
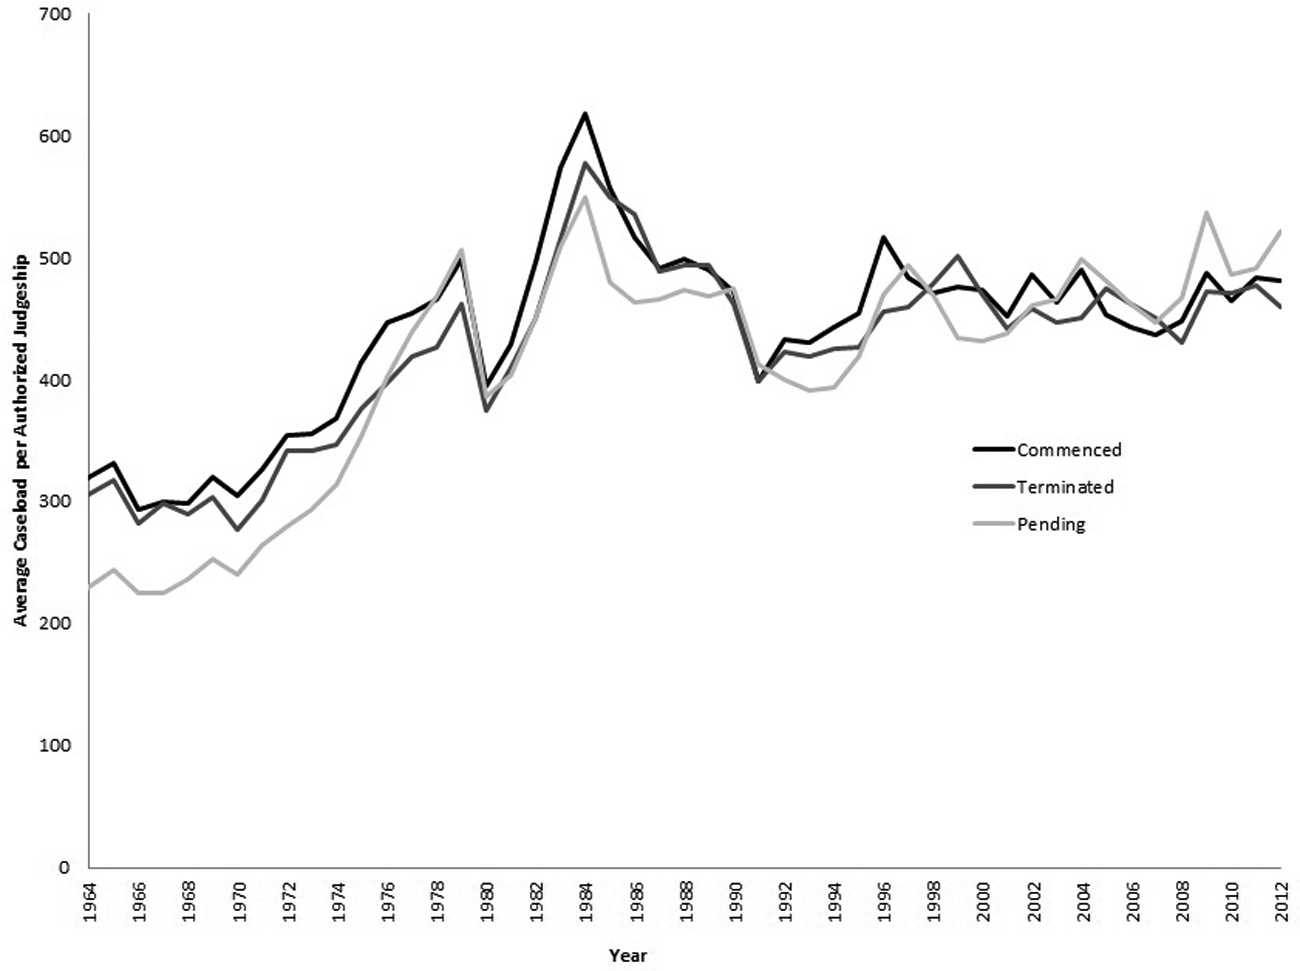
We begin by examining the total filings, terminations, and pending cases per court per year, divided by the number of authorized judgeships on a given court. Figure 1 presents averages of each of these series across all courts annually.Footnote 5
Means of measures of commenced, terminated, and pending cases per authorized judgeship across all district courts, 1964–2012.
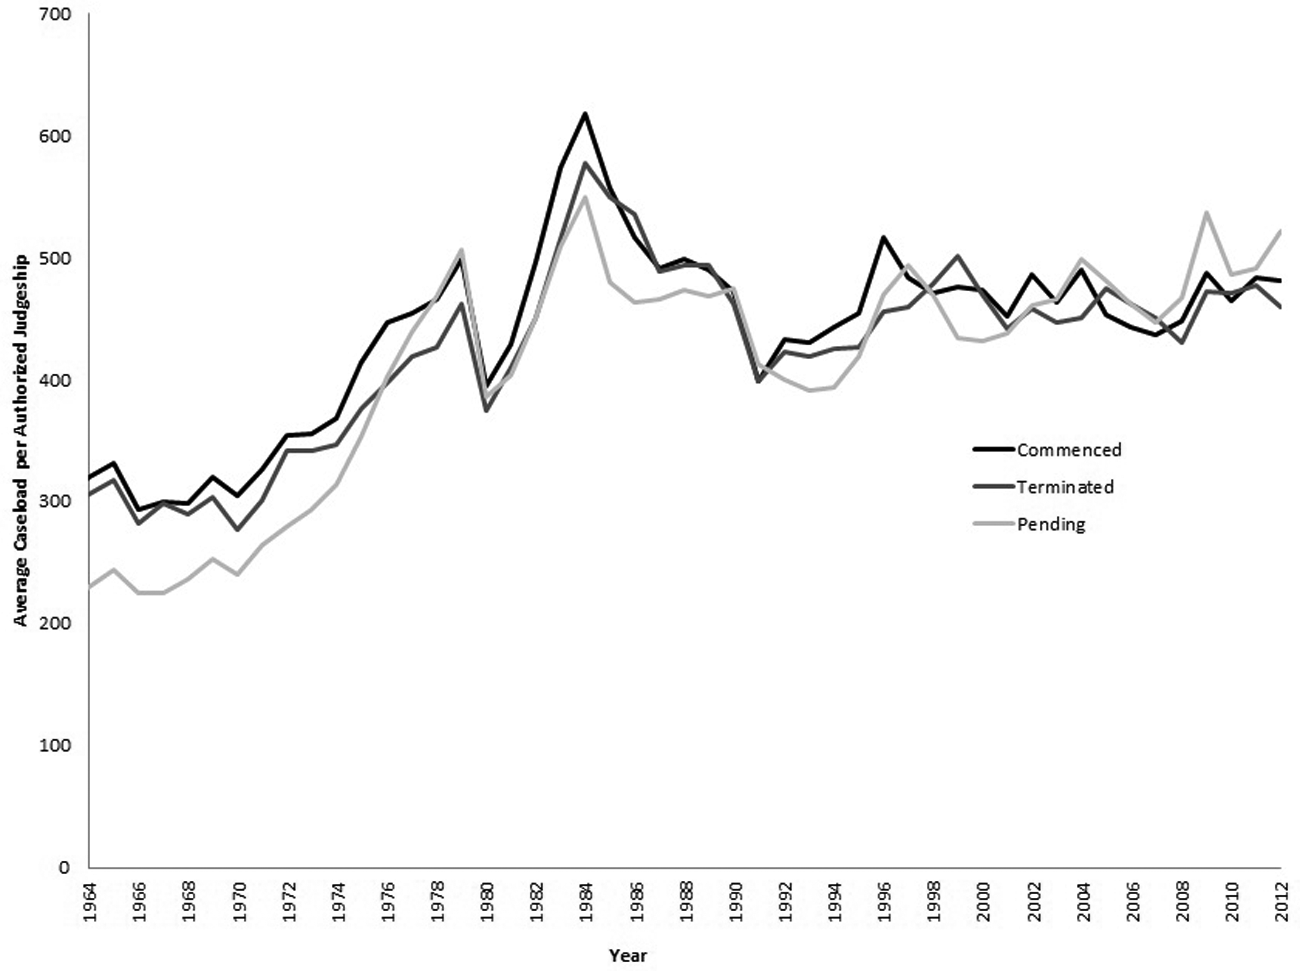
As we see from the figure, there was reason to be concerned about the mounting caseloads across the district courts from the mid-1960s until the mid-1980s, as all three series point to a steady increase until the mid-1980s. Following that period, caseloads began to fall and have since remained relatively stable, with a spike in pending cases from 2008 to 2012. Comparing each individual series, we observe that across much of the period, commenced cases take on the highest value. In recent years, however, pending cases have exceeded commenced and terminated ones. As one can see, the series are collinear; moreover, they are highly correlated with one another.Footnote 6
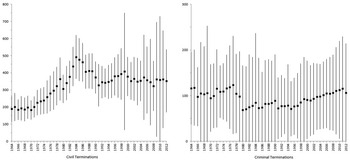
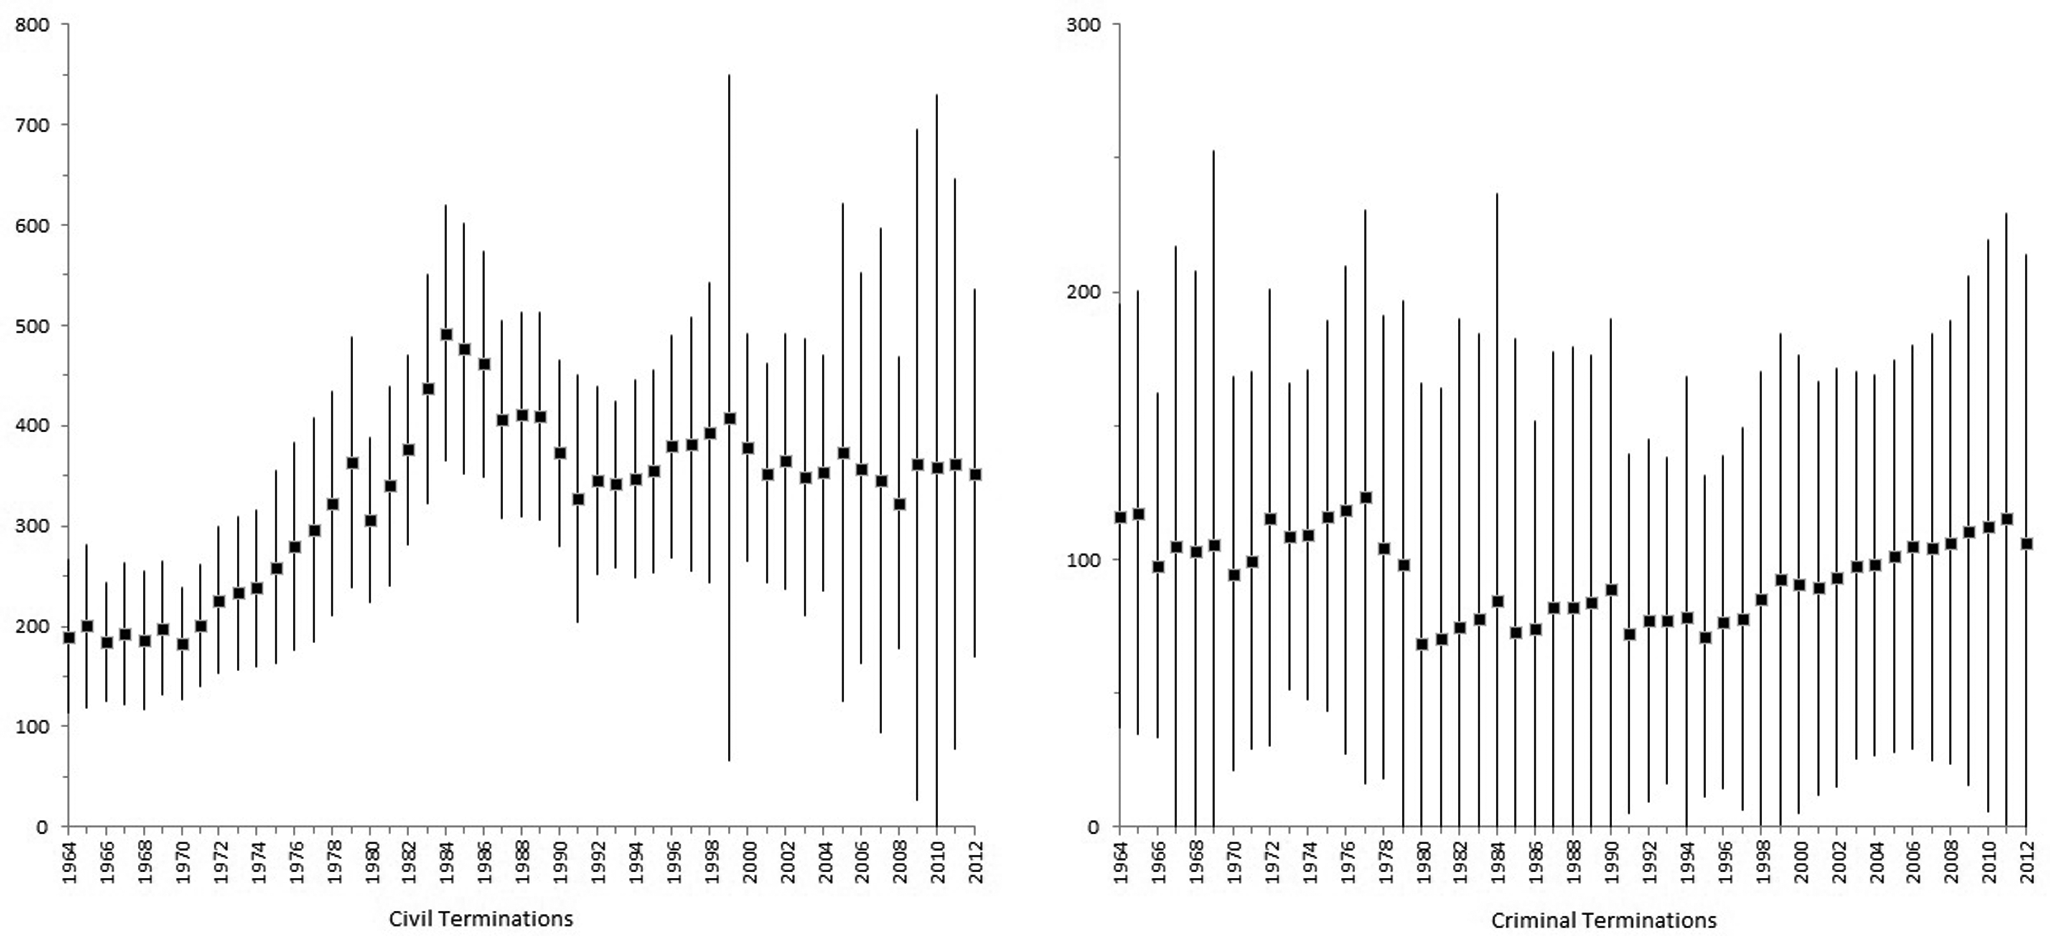
Of course, the circumstances facing judges on a particular court may have little relationship to the national averages. We illustrate the variance in caseload through a distributional plot, showing the means and 1 standard deviation above and below the mean annually from 1964 through 2012 (see fig. 2). Here we plot civil and criminal terminations. From this figure, one can see that the trend for the mean of civil cases terminated is similar to what we observed in figure 1 for total terminations, which is not surprising given that civil cases account for a greater proportion of cases terminated than criminal ones. The mean for criminal terminations was actually highest in the period from 1964 to 1979, then declined, and then rose steadily from 1994 to 2011. Looking at the standard deviations, we can see from civil terminations that the variance has increased considerably from the late 1990s to the present, with a pronounced spike in 1999. The relatively stable mean in the 1990s and 2000s, shown here and in figure 1, obscures the fact that some courts are burdened with high caseloads.
Means and standard deviations of civil cases terminated and criminal cases terminated per authorized judgeship across all district courts, 1964–2012. Bars represent the value of 1 standard deviation plus or minus the mean. Note the two figures do not share the same y-axis, as there are more civil cases than criminal ones.
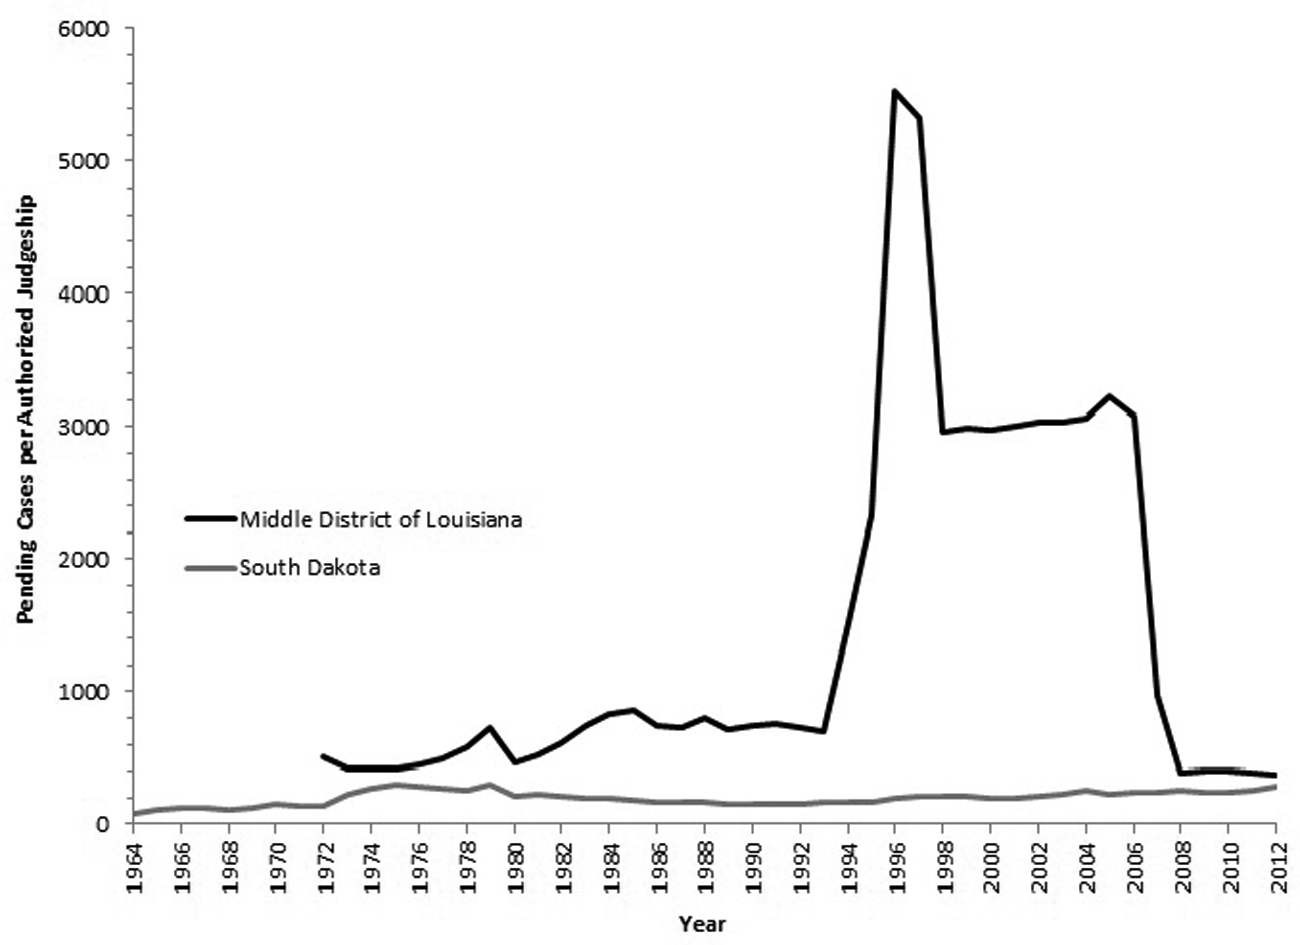
Although the cases’ commenced, terminated, and pending data can reveal interesting patterns about caseload in the district courts, there are several reasons for scholars of the courts to be cautious when using these data to make inferences about the work environment of judges. First, certain types of cases can distort the workload of a given court. This is particularly true for pending cases, where, for example, class action suits can remain unresolved for a number of years. To illustrate such an effect, we present pending case data per authorized judgeship for two district courts in figure 3: the District of South Dakota and the Middle District of Louisiana.Footnote 7
Comparison of pending cases per authorized judgeship for two district courts, 1964–2012.
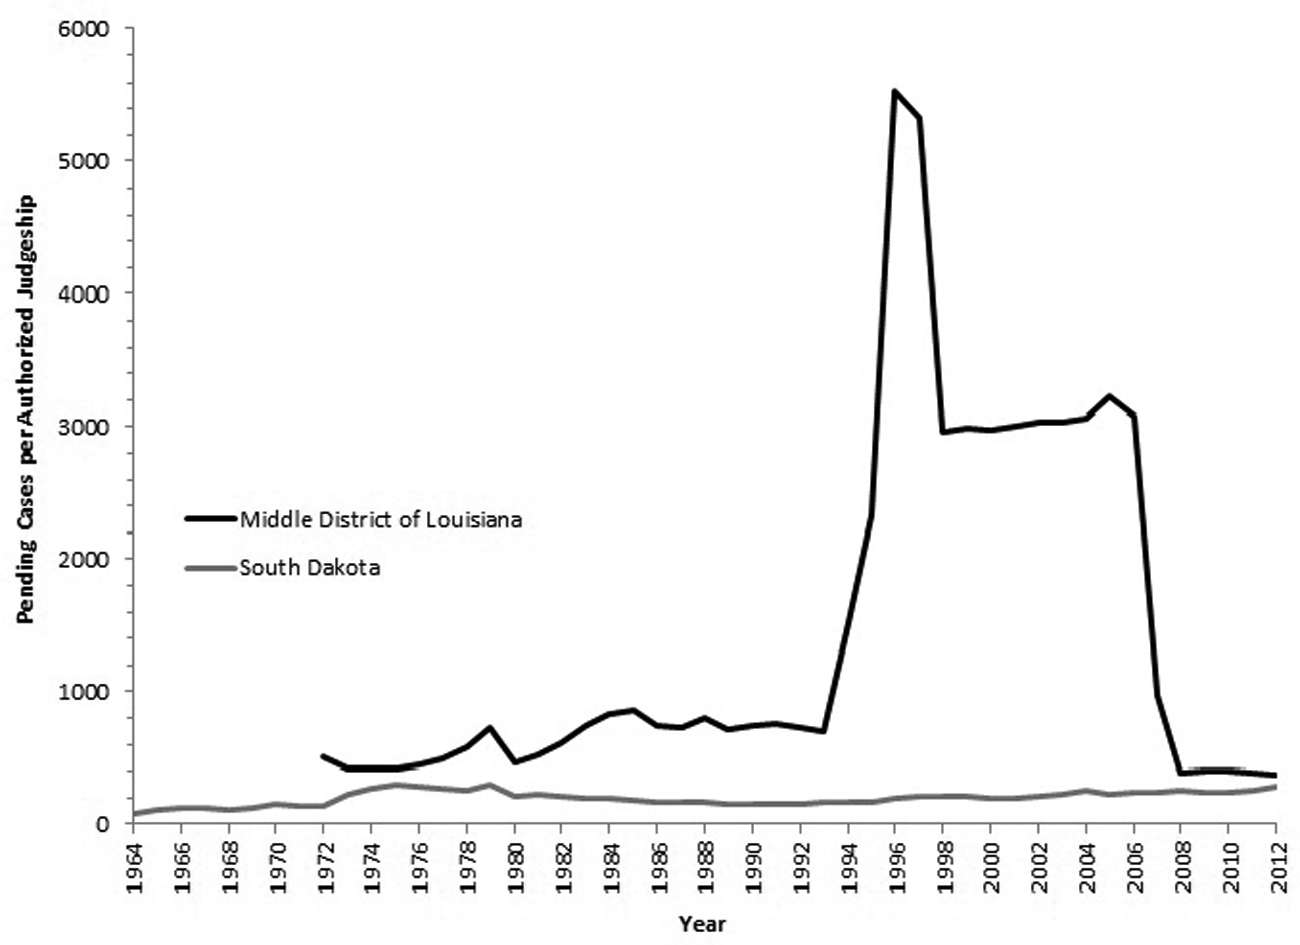
Appearances would suggest that judges in South Dakota have had fairly low caseloads compared with judges in the Middle District of Louisiana, particularly from the mid 1990s to 2007. Although it may be true that judges face less docket pressures in South Dakota than in Louisiana Middle (LAM), the spike in pending cases in LAM in the 1990s can be accounted for by a class action suit where more than 9,900 plaintiffs ultimately filed. Although litigated jointly, the cases were filed individually, a common practice in the federal courts in class action and multidistrict litigation. Though the case was settled in 1997 and some plaintiffs were terminated at that time, nearly half of those plaintiffs were not terminated until 2007 (the district was authorized for an additional judgeship that year as well). Thus using pending cases per authorized judge does not best capture the caseload of judges in LAM. More generally, in districts where class action suits have been filed, or where the Judicial Panel on Multidistrict Litigation (MDL) has assigned an MDL case, the number of filings, pendings, and terminations will all appear to spike in response to several hundred (or thousand) cases, cases that share both a common defendant and a legal question. Of course, such a spike will occur only in certain years for filings and terminations, whereas the spike can persist for pending cases until the cases are resolved. Nonetheless, the existence of such spikes creates problems in making inferences using nominal filings, pendings, or terminations data. Such data may not accurately capture the docket pressures of a judge on a given court.
Weighted Case Filings
There is a second concern related to the validity and reliability of the measures across courts and across time. When examining civil and criminal cases commenced, terminated, or pending across courts, one finds evidence that courts can differ substantially in the balance of criminal and civil cases undertaken. And followers of the courts recognize that the resources invested in these cases differs (Lombard and Krafka Reference Lombard, Patricia and Krafka2005). Concerning comparability over time, one finds that in the period from 1964 to 2012, many courts shifted in terms of the kinds of cases they were reviewing, with attention to civil or criminal cases fluctuating even within a given court. For these reasons, one should be cautious in making claims about the relative docket pressures in even one court over a significant time period.
The Administrative Office of the US Courts publishes a measure of caseload that attempts to account for the comparison of cases across courts and over time. These data are weighted case filings.Footnote 8 The Federal Judicial Center (FJC) has calculated weights for each nature of suit and offense in civil and criminal cases filed, respectively. According to the FJC, case weights “are a measure of the judicial work required by cases of different types. They indicate how much more or less time-consuming one type of case is compared to other cases” (Lombard and Krafka Reference Lombard, Patricia and Krafka2005, 1). In order to calculate case weights, historically the FJC relied on time diaries compiled by judges, which were adjusted approximately every 10 years. The most recent iteration of the study, completed in 2004 and reported to the Judicial Conference in 2005, used “event-based case weighting,” where researchers relied on monthly reports of judge time on trial-related activity and “the consensus assessments of experienced district judges, providing estimates of time spent in nontrial proceedings and chambers activities” (Lombard and Krafka 2005, 3). As with any periodic data collection of an ongoing process, weighted case filings in years that are more temporally proximate to the data collection studies by FJC will be more accurate indicators than measures of weighted case filings long after a revision of the case weights (see also Gillespie Reference Gillespie1974).
All nominal measures can be criticized as lacking comparability across districts or over time, whereas the weighted filings are an attempt to deal directly with comparability issues by accounting for the case mix and by regularly adjusting the case weights. Thus the weighted case filings offer an improvement, albeit an imperfect one, over the nominal filings, pendings, and terminations data. And, importantly, the measures are a component of what the Judicial Conference uses when evaluating requests by district courts for additional judgeships to deal with mounting caseloads (see Government Accountability Office 2003, 8).Footnote 9 Concerning the scholarly literature, weighted filings data have been used in some analyses (see, e.g., Binder and Maltzmann Reference Binder, Sarah and Maltzman2009), although such measures appear to be less commonly referred to than nominal filings, terminations, or pending data.
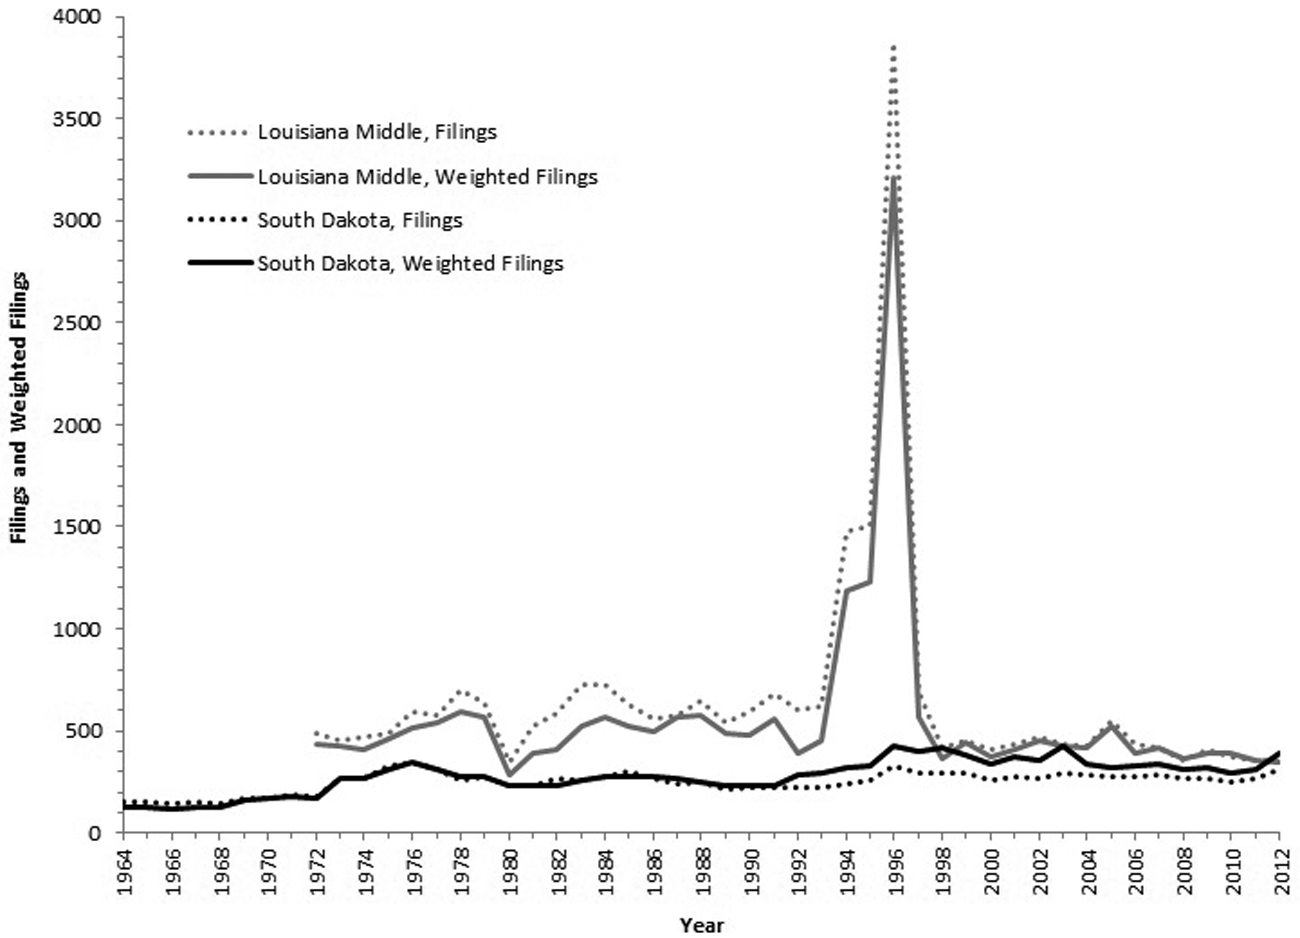
To illustrate the value of the weighted case filings measures, we return to the districts of South Dakota and Louisiana Middle. In figure 4, we plot case filings and weighted case filings over time. Both have the number of authorized judgeships as the denominator. The dashed lines correspond to raw filings data, and the solid lines, to weighted filings. South Dakota’s data are presented in black, and Louisiana Middle’s, in dark gray.
Comparison of case filings and weighted case filings per authorized judgeship for two district courts, 1964–2012.
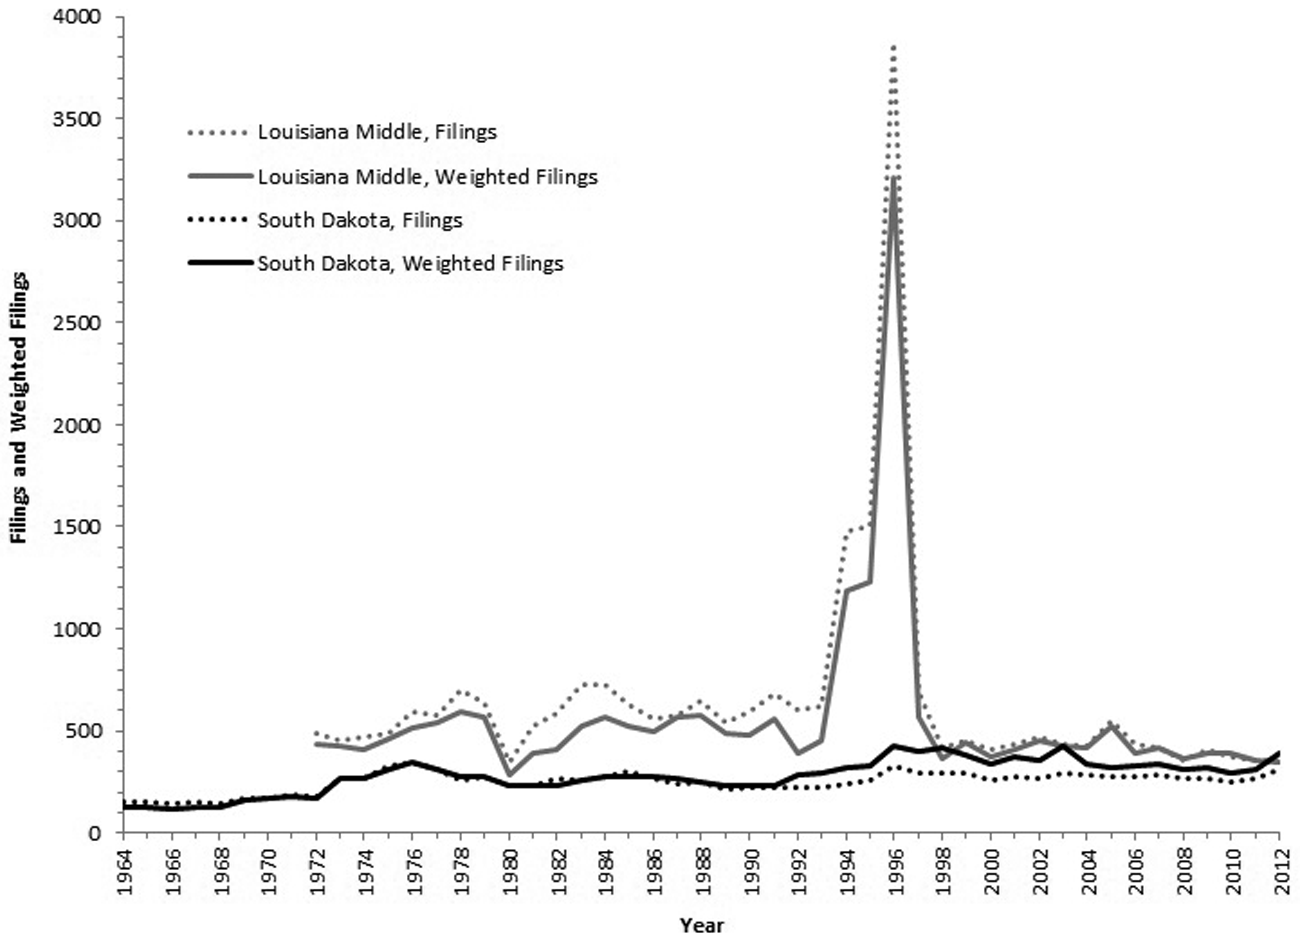
The figure draws attention to the difference in weighted and unweighted case filings. As one can see, for Louisiana Middle, the raw filings data overestimate the workload of a judge in that district. That is, the dotted gray line is higher than the solid gray line for almost every year. We do observe a similar spike in the 1990s that we saw in figure 3, but we can see that the spike is lower for weighted filings than for nominal filings. Turning to South Dakota, from the 1990s to the present, we see that the raw filings data underestimate the workload of a judge in that district.
III. Measuring Judges’ Service
We have argued that the weighted filings data better capture caseload, although we have noted that no numerator is without measurement error. Next, one must also give thought to the appropriate denominator. The question of how to capture judges’ service is not straightforward. Published weighted case filings data have already been divided by the number of authorized judgeships for a given court, but this denominator may not be the preferred measure for court researchers. In contrast, cases commenced, terminated, and pending are published by court, meaning one must divide these data by the number of judges per court to assess judges’ caseload. Although the Administrative Office of the US Courts relies upon the number of authorized judgeships as the denominator for weighted case filings, there are two reasons to be cautious about this approach. The first concerns vacancies. Judges serving on courts with vacancies take on increased docket pressures. Our data consider district courts from 1964 through 2012, which comprises 4,486 unique court-years, and of these, 1,219 (27.2%) were missing one or more judges for at least two-thirds of a year.Footnote 10 Consider the example of the Southern District of New York from June 1980 to September 2000. The authorized judgeships for this period ranged from 27 to 28,Footnote 11 but at no point during that 21-year period was the court without a vacancy. In fact, the court operated without the services of between six and nine judges from September 1991 through September 1994.
Using authorized judgeships as the denominator not only fails to take into consideration vacancies, but the denominator does not incorporate the work of senior-status judges. Judges who take senior status (having met the requirements of the Rule of 80) can retain eligibility for any salary increases granted to active status judges by performing work equal to 25% of the work of an active judge. That work may consist of carrying cases similar to other judges in the courts they sit on or of performing “substantial judicial duties not involving courtroom participation” (28 U.S.C. § 371 (e)(B)) or a combination of the two.Footnote 12 Such judges can remain in senior status until they choose retirement, resignation, or in a nontrivial number of cases, die in office. Consider again the example of the southern district of New York from June of 1980 to September of 2000. In 13 of these 21 years, despite the vacancies on the court, the number of active judges and senior status judges (counted as 0.25) exceeded the number of authorized judgeships. Returning to the aforementioned period in the mid-1990s, in June of 1994, for example, 18 judges were in active service in NYS, well short of the authorized 28. But these judges served alongside 24 senior status judges, and assuming a 0.25 caseload for each one, these senior status judges accounted for the services of at least six full-time ones.
Tabulating Judges Serving on a Court
Thus we argue that the choice of how one measures the number of judges on a court, the denominator, is of equal importance to assessing the numerator, the number of cases considered. Accordingly, we offer three indicators scholars may use for the denominator. First, we simply recorded the number of authorized judgeships per court per year, the denominator used by the Administrative Office of the US Courts in the weighted case filings measure and the denominator used in the earlier figures we displayed.Footnote 13 We next tabulated a denominator that takes into account vacancies. Although this strategy may sound straightforward, accurately assessing how many judges are on the court for any particular period of time requires considerable data collection. Here we relied on detailed biographical descriptions for each judge’s service available from the FJC. The FJC records the date of commission for each district court judge, the date of their transition to senior status.Footnote 14 Thus we monitored the history of each judge’s service over time and recorded precisely the length of tenure from commission date to date of senior status by month.Footnote 15 The virtue of this method is that we are also able to account for judges who began midterm or ended their careers midterm. For district courts in the period from 1964 to 2012, this effort amounted to tracking the duration of the careers of more than 2,000 judges.Footnote 16
We considered a final denominator, capturing both vacancies and the work of senior status judges. We assume here that senior judges work a caseload equal to 25% of that of active judges. In this we follow work by Vining (Reference Vining2009a, Reference Vining2009b) for the courts of appeals and Boylan (Reference Boylan2004) for district courts—both of which impute a 0.25 caseload for senior judges, although we recognize that many senior judges oversee substantially more cases, and some oversee less, and thus this denominator is also subject to a degree of measurement error. As we noted earlier, according to the US code, judges can retain eligibility for any salary increases granted to active status by performing work equal to 25% of the work of an active judge. We know that many judges in senior status take on more than the 25% caseload. In fact, Burbank et al. (Reference Burbank, Jay Plager and Ablavsky2012) find that “on average, district court judges serving in senior status were carrying a 43.5% case workload in the 1990s and a 50.3% case workload in the 2000s” (29). Alternatively, the US Code also allows judges to remain in senior status without hearing cases under some circumstances. That is, senior judges may also perform administrative work for the courts or elsewhere in the government on a full-time basis (or in combination with caseload or noncourtroom duties) or be certified as disabled and retain eligibility for raises that are granted to active status and senior judges.Footnote 17 Lacking systematic data over our entire period of analysis on precisely how many cases senior status judges oversee at the district court level, we impute a 0.25 caseload.Footnote 18
To tabulate the denominator, we returned to the detailed biographical descriptions of judges’ careers available through the FJC. Here, to the data already collected, we added information on the month when the judge transitioned from active to senior status and information on the final exit from the court via retirement, resignation, or death. We allotted a workload of 0.25 for each full year of service in senior status.Footnote 19 The virtue of our method for calculating this third denominator is that, similar to before, we are able to account for those whose service was for less than the entire year and for vacancies, but now we are also able to account for the work of senior status judges.Footnote 20
It is useful to consider an example to clarify how we tabulated this last denominator. Although any of the judges serving between 1964 and 2012 would be appropriate, we offer Judge Aubrey Eugene Robinson Jr. from the District of Columbia. Judge Robinson Jr. was commissioned on November 3, 1966, and remained in active service until March 1, 1992, when he transitioned to senior status. His service was ultimately terminated on February 27, 2000, owing to his death. To tabulate this one judge’s career, we did the following: 0.667 service for the year July 1, 1966, to June 30, 1967 (i.e., 8 months active service); 1.0 service for each full year through June 30, 1991; 0.833 service for the year July 1, 1991, to June 30, 1992 (i.e., 9 months active service plus 3 months one-quarter time service); 0.25 service for each full year in the period July 1, 1992, to June 30, 1999; .167 service for the period July 1, 1999, to February 27, 2000 (i.e., 8 months senior status service). To calculate the number of judges on the US District Court for the District of Columbia, we repeated this exercise for each judge on that court. We then repeated this process for each judge on every district court between 1964 and 2012, more than 2,100 judges total.
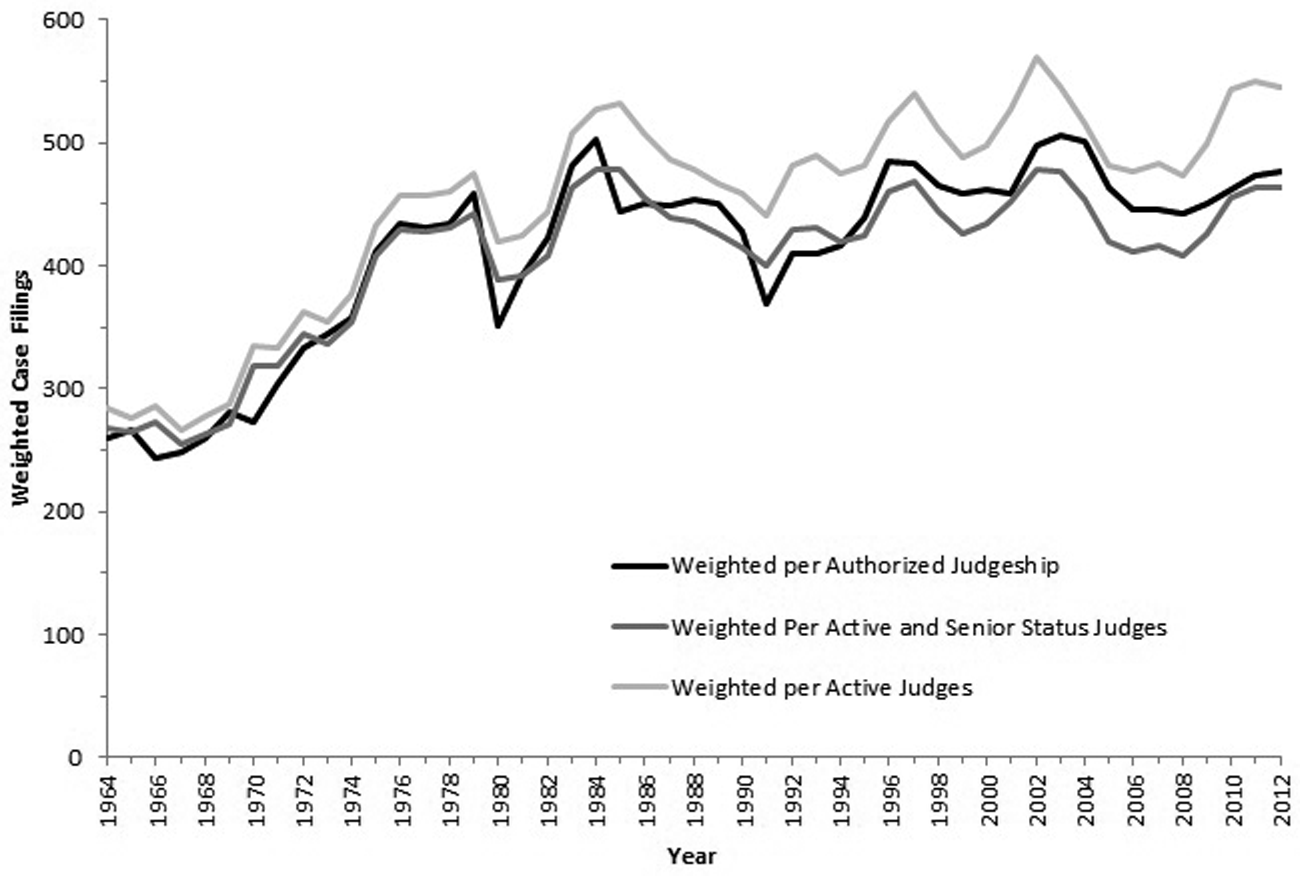
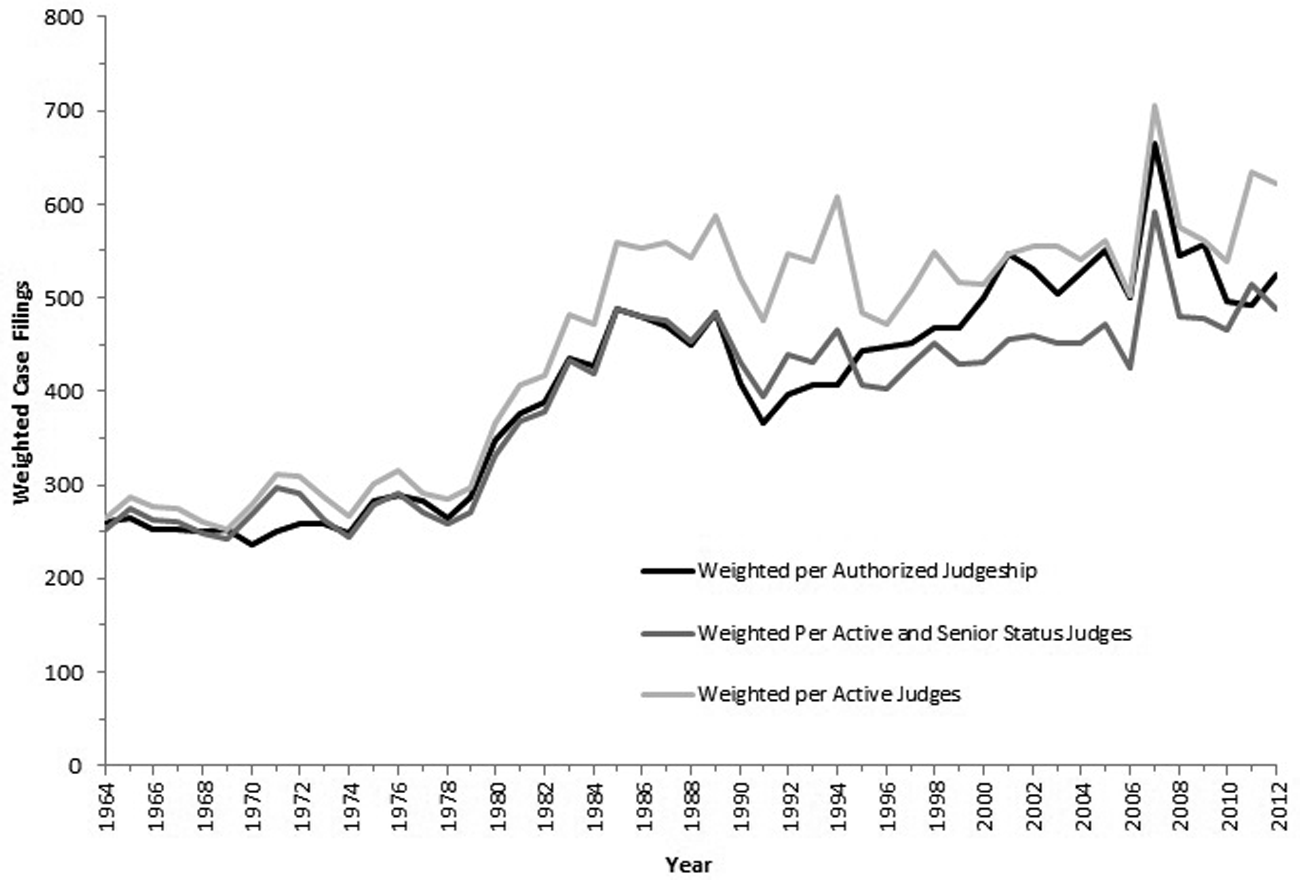
We now illustrate the effect of how one measures judges’ serving by displaying weighted case filings with our three unique denominators in figure 5. We present national averages—weighted case filings across all courts—for each year in our analysis. Again, our three denominators are the number of authorized judgeships; the number of active judges serving (capturing vacancies); and finally, the number of active judges serving (capturing vacancies) plus the number of senior status judges.
Means across all district courts of weighted case filings data with three alternative denominators, 1964–2012.
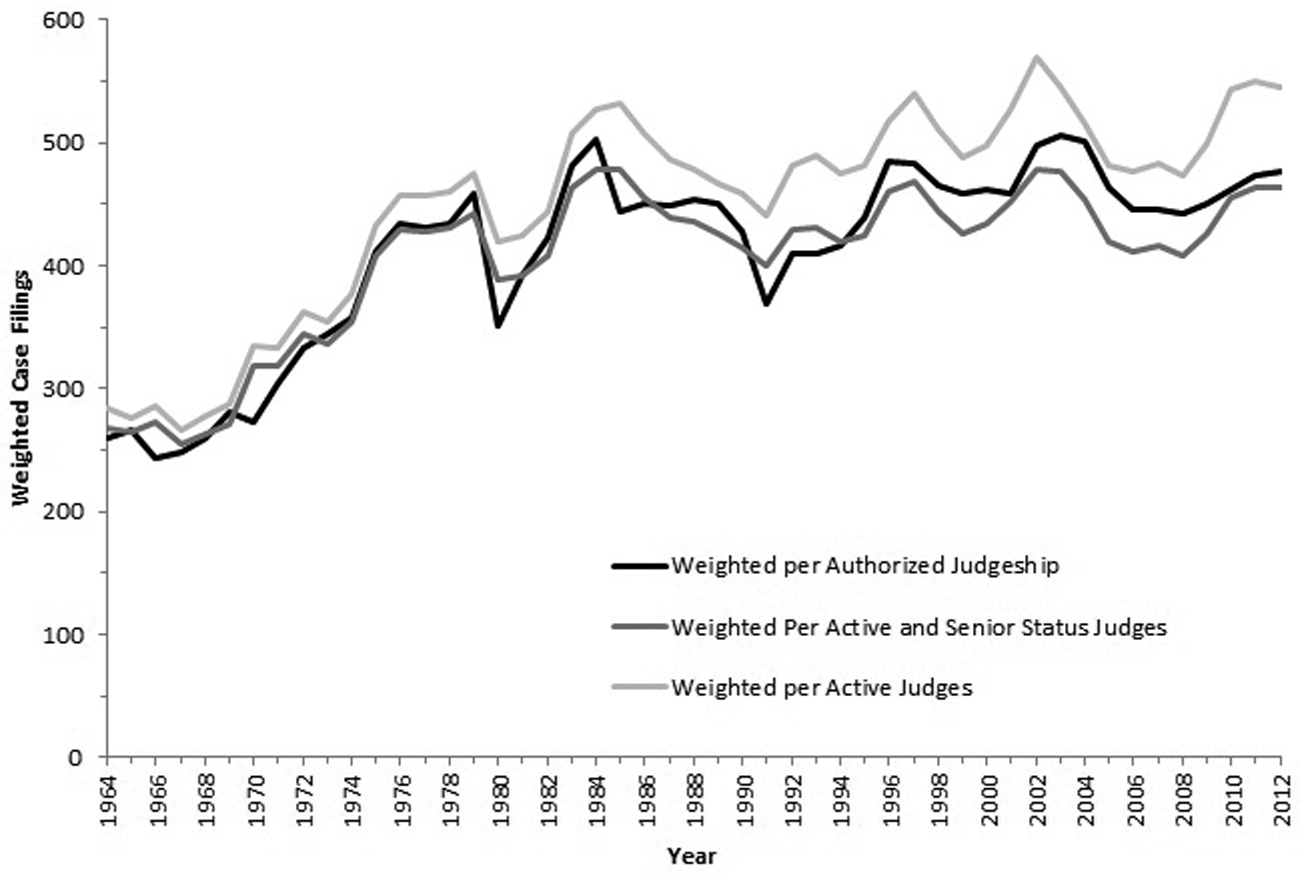
We see that although the series are collinear, there are notable differences. First, one finds that the difference in caseloads observed by comparing our first and second denominators—the series with authorized judgeships as the denominator versus active judges—grows considerably over time. At times when these series are close to one another, the number of vacancies across the federal courts is small. But one can see that beginning in the 1980s, vacancies on the district courts have shifted even the mean workload of judges across courts. The growing difference in recent years reflects the fact that nominations to the district courts have become more contentious and politicized over time (Binder and Maltzman Reference Binder, Sarah and Maltzman2009). In fact, the gap between the two series from 2008 to 2012 is striking. Second, when comparing our first and third denominators, one can see that the work of senior status judges has helped to alleviate docket pressures, even in the face of vacancies. When looking from the late 1990s to the present, the weighted per active and senior status judges series is lower than that of the authorized judgeship series. The work of so many senior status judges may have helped mitigate a court crisis.
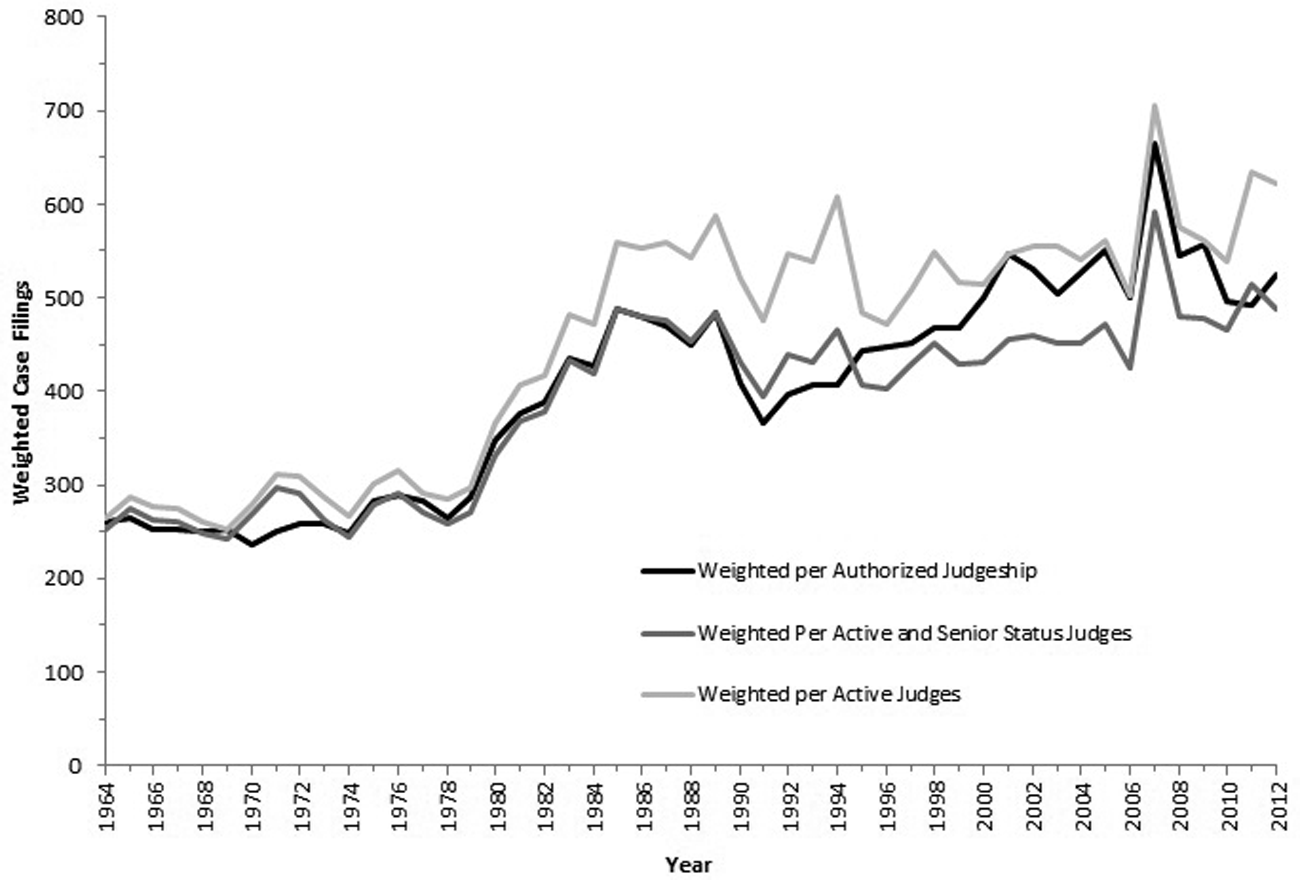
We offer two final figures to provide context for the effect of the differing denominators. First, we provide a similar figure to figure 5 but here focusing only on the weighted case filings for the Southern District of New York. In figure 6, one can see that caseloads in this district have grown considerably over time. And one notes that, at first, the series track fairly closely with one another. But when one compares the authorized judgeship denominator series against the active judges series from 1980 to 2000, as we discussed earlier, one sees the pronounced effect of vacancies, particularly in the early 1990s. However, it is also evident that the work of so many senior status judges has helped alleviate caseload pressures, as one sees in the weighted per active and senior status judges series.
Weighted case filings data for the southern district of New York with three alternative denominators, 1964–2012.
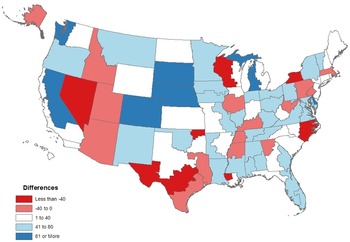
Our final figure compares the disparity between first and third denominator for a single year, 2012. We subtract the number of weighted filings per active and senior status judges from the number of weighted filings per authorized judgeship, which allows us to evaluate the difference between the published weighted filings data and our measure that accounts for both vacancies and senior status judges. We display the outcome in quintiles in figure 7.
Comparison of the difference in weighted case filings per authorized judge against active judges and senior status judges serving, 2012. Negative values (shown in darker shades) indicate districts where vacancies outweigh assistance by senior judges. Positive values (shown in lighter shades) indicate districts where assistance by senior judges outweighs vacancies.
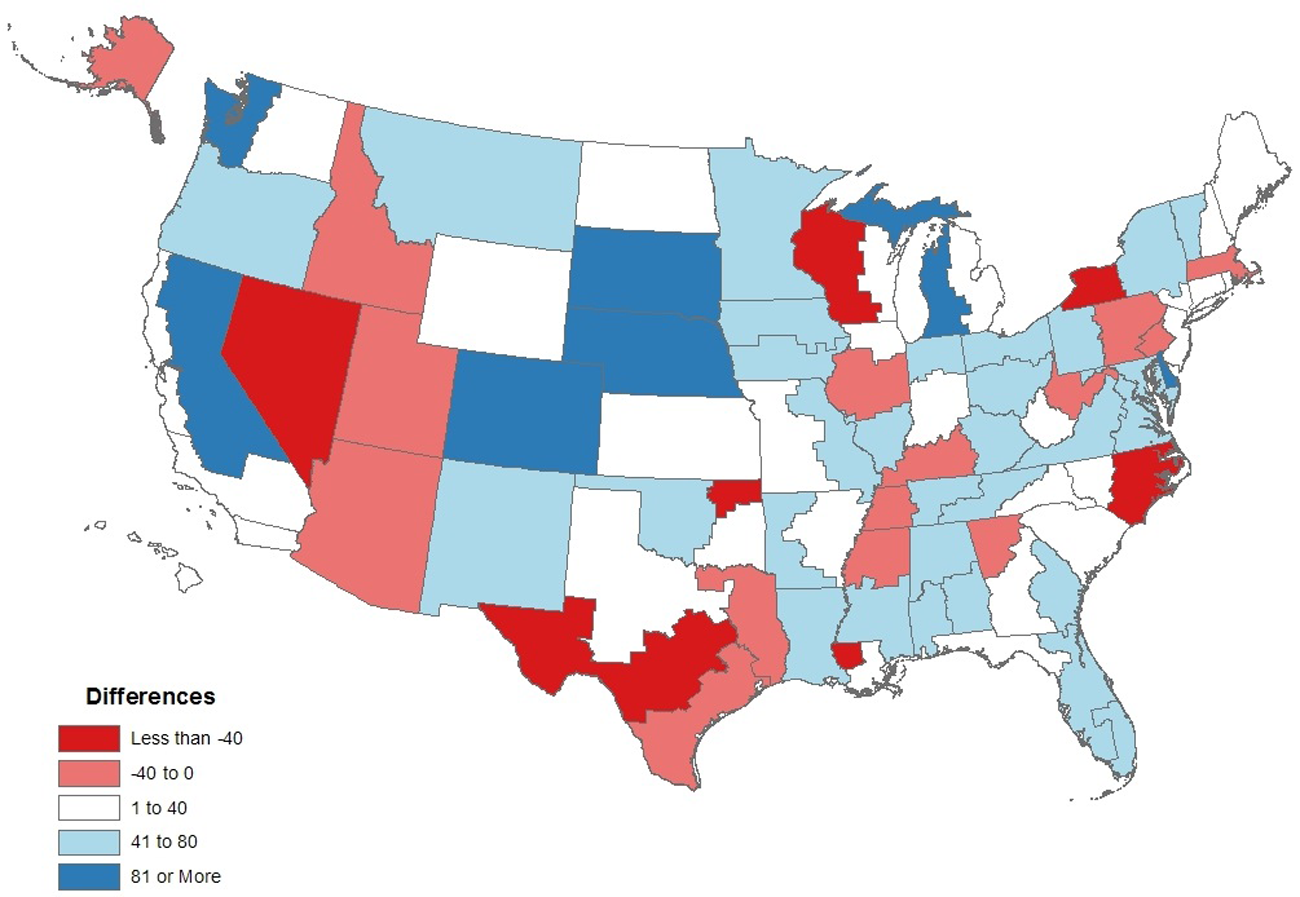
Even for this one year, one can observe the considerable effect of calculating workload based on judges serving rather than authorized judgeships. Negative values, indicated by darker shading, show those districts where the number of vacancies is great enough that the assistance by senior judges is insufficient to replace the contribution that would be made were the vacant judgeships filled. Positive values, indicated by lighter shading, reflect those districts where the number of senior judges serving is greater than the number of vacant judgeships. In this map, one should not assume that districts near zero reflect the optimal district. Rather, these are districts where the weighted filings per judgeship closely match the weighted filings per judge serving.
Summary of Measures Available
We conclude our discussion of the measurement of caseload by providing a summary of the measures available to scholars. We have argued in favor of using weighted case filings as the numerator, and we have pointed to problems associated with authorized judgeships as the denominator. That said, it may be that scholars have theoretical reasons for preferring, for example, the use of terminated civil cases as the numerator and authorized judgeships as the denominator. Our article makes publicly available the following measures as numerators:
-
Civil cases commenced
-
Criminal cases commenced
-
Total cases commenced
-
Civil cases terminated
-
Criminal cases terminated
-
Total cases terminated
-
Civil cases pending
-
Criminal cases pending
-
Total cases pending
-
Weighted case filings
For each of these numerators, our data collection includes the following measures as denominators:
-
Authorized judgeships
-
Active judges serving
-
Active judges and senior status judges serving
Thus we offer scholars the possibility of 30 measures of caseload for each district court from 1964 to 2012. We argue, however, that the numerator of weighted case filings offers an improvement over nominal filings, terminations, and pending cases because the measure best allows for comparison across courts and over time, and that the denominator that accounts for both vacancies and the contributions of senior status judges better represents the judicial resources available on a given court. That said, the appropriate caseload measure depends on the question asked, and scholars should recognize that any measure is imperfect.
IV. Discussion
Our article provides scholars with new and valuable measures of caseload. Our data permit scholars to use a variety of indicators of caseload in their models or to use the one indicator most theoretically appropriate to the research question. These measures allow one to test theoretical questions at the district court level across time. Concerning the long-standing debate about a “crisis in caseload,” one can now examine individual courts or national averages through filings (weighted or unweighted), terminations, or pending cases data; and by considering alternative ways of measuring the service of judges on a court. Moreover, researchers can return to questions concerning the extent to which docket pressures have motivated judges to depart the bench. Our data also allow more sophisticated analyses of the impact of vacancies and the contributions of senior judges on the work of the federal judiciary. For example, do vacancies increase the amount of time judges and courts take to dispose of cases? Do vacancies increase the incentives for sitting judges to encourage settlements or plea bargains to trial? Do vacancies, or senior judges, affect the calculus of litigants when deciding in which district to file? Moreover, in analyses of partisan gridlock and confirmation battles, one can consider more refined questions that evaluate the impact of a shortage of judicial resources on the amount of time it takes the president to nominate and the Senate to confirm district judges (Wheeler 2012). Rather than relying on national data, our data will allow scholars to exploit interdistrict variation in the occurrence of vacancies and the degree to which districts rely on senior judges and therefore better evaluate the sensitivity of the Senate and the president to judicial needs. Binder and Maltzman (2009, chap. 6) conduct such an analysis for courts of appeals judges; our data facilitate similar analyses for district courts. Finally, precise caseload measures may also allow scholars to evaluate the degree to which caseload influences the heuristics that judges use to decide cases. For example, judges with greater caseloads may be more willing to rely on legal, rather than attitudinal, constructs or may be less willing to attempt to narrow or overturn a court’s precedent.
We return finally to an issue that introduced our study: are the courts in crisis? Our study has offered a nuanced answer to this question. As we saw from the figures, it is true that average caseloads steadily increased from 1964 to the mid-1980s. We also noticed an increase in the variance over time, with many courts today working much more taxing caseloads than others. Add to this the number of vacancies on the courts, and one may have a strong argument for a judiciary in crisis. That said, our development of a caseload measure that accounts for the service of senior status judges has pointed to the fact that these judges have played an important role in mitigating docket pressures. However, as shown in figure 7, certain districts with vacancies and few (if any) senior status judges can face significant pressures, while other districts benefit from a lack of vacancies and an abundance of senior status judges. Perhaps the question would be better phrased: which district courts are in crisis?