In his first State of the Union address in January 1964, President Lyndon B. Johnson asked Congress to declare an “unconditional war on poverty” and to aim “not only to relieve the symptom of poverty, but to cure it and, above all, to prevent it” (1965). Over the next five years, Congress passed legislation that transformed American schools, launched Medicare and Medicaid, and expanded housing subsidies, urban development programs, employment and training programs, food stamps, and Social Security and welfare benefits. These programs morethan tripled real federal expenditures on health, education, and welfare, which grew to over 15 percent of the federal budget by 1970 (Ginzberg and Solow Reference Haines1974).
Using the volumes of oral histories, taped conversations, and archival documents, historians have pieced together competing (but not mutually exclusive) narratives of this decade's political economy (Gettleman and Mermelstein Reference Gillette1966; Levitan Reference McKee, Orleck and Hazirjian1969; Ginzberg and Solow Reference Haines1974; Davies Reference Depew, Fishback and Rhode1996; Gillette Reference Gillezeau1996; O'Connor 2001; Germany Reference Gettleman, Mermelstein, Gettleman and Mermelstein2007; Orleck and Hazirjian Reference Schlesinger2011; Caro Reference Caro1982, Reference Caro2002, Reference Caro2012). Economic historians attribute the policy shift in the 1960s to a long-term decline in Southern planters’ demand for cheap agricultural workers and accompanyingdecline in plantation paternalism (Alston and Ferrie Reference Alston and Ferrie1993, Reference Alston and Ferrie1999). Relative to the large literature that examines the political economy of the New Deal, little quantitative research has considered the political economy of the War on Poverty: how and why it evolved from the small-scale, academic brainchild of the Council of Economic Advisors to a controversial and enduring legacy of the Johnson presidency.Footnote 1
This article contributes a novel quantitative description to the vast narrative, documentary, and oral history of the 1960s political economy. We analyze how the War on Poverty was fought through the lens of the legislation that came to define it: the 1964 Economic Opportunity Act (EOA).Footnote 2 This centerpiece legislation created the Office of Economic Opportunity (OEO) to coordinate federal antipoverty initiatives and empower the poor to transform their own communities. The EOA also contained two radical provisions that facilitate our analysis. First, the EOA apportioned funding across states according to an index, but it imposed no requirements on how and where to spend money within states. Second, the EOA enabled the federal government to fund local private and nonprofit organizations directly, rather than funneling money through state or local governments. This provision encouraged the development of customized programs to combat the root causes of local poverty and also allowed the federal government to work around widespread de jure racial segregation, which had restricted the political participation of African Americans, and de facto exclusion of the poor from the policymaking process. These provisions relaxed many of the usual constraints on federal funding choices (for example, cooperation with state and local government officials). Observed funding choices, therefore, provide a great deal of information about theobjectivesof the Johnson administration during this transformative period of U.S. history.
Our analysis uses data on OEO grants from the National Archives and Records Administration (NARA), which we link to a variety of other data sources to describe the decade's complex political economy. These county-level data include measures of local demographiccharacteristics, political importance, local government expenditures and tax revenue per capita (U.S. Bureau of the Census 1964), riot intensity (Collins and Margo Reference Collins and Margo2007), the escalation of the Vietnam War (casualty rates from U.S. Department of Defense 2008), and the intensity ofsharecropping to proxy for Lee J. Alston and Joseph P. Ferrie's (Reference Alston and Ferrie1993) paternalism hypothesis. Our quantitative findingsshow that a modest share of the within-state spending is explained by this rich set of covariates (5 to 9 percent versus roughly 37 percent during the New Deal). The variation explained by the model reflects systematic spending in higher poverty areas. After accounting for a variety of other county-level covariates, the extent and intensity of poverty significantly predict within-state, county-level CAP spending from 1964 to 1968 in both the South and the non-South.
An important and often forgotten component of the War on Poverty is its “assault on [racial] discrimination” (Council of Economic Advisers 1964, p. 56). The OEO monitored compliance with the Civil Rights Act and threatened violators with the withholding of federal funds. Interestingly, counties’ share of population that was nonwhite in 1960 accounts for the bulk of explained, within-state variation in OEO funding nationally—a pattern driven by the non-South. Together, poverty rates and the share nonwhite explain more of the within-state variation in OEO spending (roughly 30 percent) than do the more than twenty other covariates combined. In the non-South, these two variables alone account for over 60 percent of the explained, within-state variation in OEO spending.
Consistent with New Deal funding patterns, political considerations also influenced where OEO money was spent. We find that the Johnson administration invested in Democratic strongholds and rewarded areas with bigger swings in favor of the Democrats in the 1964 presidential election. Swing counties received slightly less funding overall, but swing counties won by Johnson in 1964 received slightly more OEO money ceteris paribus. But, although politics mattered, political considerations together explain surprisingly little of the county-level variation in OEO funding. Measures of political considerations explain no more than 1 percent of the variation in county-level spending at the national level. In short, the Johnson administration appears to have invested in nonwhite and poor areas much more than in Democratic strongholds, newly won districts, or the districts of powerful congresspersons. Our analysis of voting reinforces the notion that Johnson's War on Poverty failed to build a Democratic constituency in the short run. Although turnout increased in areas with higher spending, a greater share of votes in nonwhite areas went to Republicans. The article concludes with a discussion of how these findings inform a better understanding of why the War on Poverty is remembered as a failure.
THE ENACTMENT AND PROVISIONS OF THE ECONOMIC OPPORTUNITY ACT
Poverty emerged as a new and pressing social issue in the United States in the late 1950s and early 1960s (O'Connor 2001). Bestselling books on the topic, including The Affluent Society by John Kenneth Galbraith (Reference Germany1958) and The Other America by Michael Harrington (1962), as well as popular journal articles, catapulted the issue into the national consciousness. Yet Johnson's motivations for championing the War on Poverty as the centerpiece of his domestic agenda have been subject to disagreement among contemporaries and historians.
The facts are straightforward. Johnson inherited a large legislative backlog from the John F. Kennedy administration. Arthur Schlesinger (1965) argues that Johnson continued what would have been Kennedy's poverty agenda. Yet Walter Heller, the chairman of Kennedy's Council of Economic Advisors (CEA), notes that only days before his Dallas assassination, Kennedy's thinking on the matter “had not gone beyond the vague concept of doing something that would focus specifically on the roots of poverty” (1970, pp. 19–20). In contrast, Heller recalls Johnson's unequivocal affirmation of the poverty program in his first briefing: “That's my kind of program. I'll find money for it one way or another. If I have to, I'll take away money from things to get money for people.…Give it the highest priority. Push ahead full tilt” (p. 21). In the seven weeks between Kennedy's assassination and Johnson's State of the Union debut, the “War on Poverty” grew from a small, academic pilot program of the CEA to a core agenda of Johnson's presidency. In the next seven months, the EOA morphed from a draft bill into one of the most controversial pieces of legislation passed during Johnson's administration.
The Conception and Promotion of the Economic Opportunity Act
The EOA was the centerpiece of Johnson's War on Poverty and has been remembered as “the most dramatic and highly publicized of the Great Society's programs” (Levitan Reference McKee, Orleck and Hazirjian1969, p. 3). It established the OEO, a new agency within the executive branch charged with initiating and coordinating government-wide antipoverty initiatives.
Shortly after Johnson's State of the Union address, he appointed Sargent Shriver, Kennedy's brother-in-law, to head the antipoverty task force. Within six weeks of his appointment, Shriver claimed that he had consulted with over one hundred different leaders in agriculture, business, labor, and civil rights groups; officials from various levels of government; and academics, administrators, and foundationrepresentatives (Levitan Reference McKee, Orleck and Hazirjian1969, pp. 30–31). Johnson's insistence that there be “no doles” and Shriver's commitment to doing things his way meant that social workers and welfare administrators—the embodiment of the old school of thought on reducing poverty—were omitted from this list or given little attention (p. 31). Shriver's task force drafted the final bill (with no input from Congress) and sent the draft EOA to Congress on 16 March 1964.
To promote the EOA, President Johnson embarked on a public relations tour. In April he visited the family of Tom Fletcher, an unemployed coal miner with a wife and eight children who lived in the hollows of Appalachia outside of Inez, Kentucky. The Fletchers had been chosen by the White House to become the face of American poverty—the faces of the 35 million Americans (roughly 20 percent of the population) who lived on less than $3,000 per year, roughly the poverty threshold for a family of four. Johnson is said to have remarked to a reporter, “I don't know if I'll pass a single law or get a single dollar appropriated, but before I'm through, no community in America will be able to ignore poverty in its midst” (Jordan and Rostow Reference Katznelson1986, p. 16). Indeed, Walter Bennett's iconic Time Magazine photo that captured Johnson chatting with the Fletchers on their front porch achieved just that.
The Enactment of the Economic Opportunity Act
The passage of the EOA was swift and decisive. The Senate approved the bill on 23 July 1964 by a vote of 61 to 34 after only two full days of debate, in which a conservative coalition of Southern Democrats and Republicans succeeded in modestly reducing the authority of the OEO director.Footnote 3 On the House side, though final passage took only a few days, the process was more contentious. Sar A. Levitan (Reference McKee, Orleck and Hazirjian1969, p. 40) notes that Republicans found the EOA hearings “frustrating” because only nine of the 69 primary witnesses opposed the bill. Moreover, Representative Adam Clayton Powell, Jr. (D-NY), chairman of the House Education and Labor Committee that received the bill, excluded Republicans from raising their objections in the hearings and from subsequent participation in the EOA's amendment.
Many congressmen objected to the concentrated power of the OEO director. On 17 March 1964, the first day of hearings before the House's War on Poverty subcommittee, Representative Robert Griffin (R-MI) asked Shriver,
As much as we all admire your work and believe in your competence…I think we must… look at this legislation from the point of view that you may not always be the chief of staff…
In every title of this bill, it provides that the Director shall establish criteria to achieve an equitable distribution of funds among the States. I see this as handing to the Director a blank check in terms of deciding how much money the various states are going to get…
Do you have any idea at this time how you are going to distribute the money among the States? (U.S. House of Representatives 1964a, pp. 70–71).
Shriver sardonically replied that the concentration of power in his office conveniently solved the problem of distribution across states by making it easy for Congress to determine whom to fire if things went badly. Unsatisfied with Shriver's answer, Representative Peter Frelinghuysen (R-NJ) announced an alternative antipoverty bill on April 28, the last day of the hearings. His bill appropriated funds to antipoverty programs created by states (rather than the OEO) and apportioned funds across the states using an index based on total population, unemployment, and average income (Congressional Record 1964a).Footnote 4 Democrats ultimately compromised to include an apportionment index, but not the one Frelinghuysen proposed.
This compromise was enough to pass the EOA in the House (Gillette Reference Gillezeau1996, pp. 121–23). On 5 August 1964 the Economic Opportunity Act (H.R. 11377) was introduced to the House floor with six hours for debate. Northern House Republicans spent much of their time decrying the power the EOA gave to the OEO director. One such remark in the Congressional Record was by Republican Robert Taft, Jr., of Ohio, who complained,
[T]his attack which we are supposed to be launching upon poverty would enable the director to do as he pleased.…There's actually no requirement that the director consult with anyone, other than to find some local agency of some sort, public or private, which would be willing to go along. If he did not have one available, he could create one (Congressional Record Reference Collins and Margo1964c).
This was a prescient criticism of the provision that ultimately would give significant power to Shriver and the Johnson administration to exercise as they saw fit.
Southern Democrats occupied important posts in the House and Senate and had the power to block legislation—a power they had long exercised to protect the interests of the Southern elites (Katznelson Reference Levine2013). They succeeded only in securing modest amendments—most notably the inclusion of a gubernatorial veto for key programs (§209[c]). Shriver recalled that Senator Herman Talmadge (D-GA), a former governor, suggested the veto as a way to let Southerners support the bill while neither alienating states’ rights supporters nor “allow[ing] all this money to become bogged down in the state and local government apparatus, and…frustrated totally by the clique that might be hanging around a particular governor” (Gillette Reference Gillezeau1996, pp. 129–30).Footnote 5
In contrast to state governors, local government had no power in the original EOA. Even though the U.S. Conference of Mayors and National Association of Counties had endorsed the original EOA with the reservation that funds be channeled through an official local poverty agency, the 1964 bill was never revised in this manner (Levitan Reference McKee, Orleck and Hazirjian1969, p. 65). Local government had no direct, statutory power to block EOA spending or designate community groups until the EOA was later amended. The president's deftness at influencing the media—liberal and conservative—ensured that those opposed to the EOA looked like they were for poverty and against helping the poor. With the election looming in the fall of 1964 and the president's support surging, the amended 27-page EOA passed the House on 8 August 1964 with a vote of 226 to 185, just three days after it was introduced.Footnote 6
The Radical Provisions and Financial Stakes of the Economic Opportunity Act
The EOA was an experiment on a grand scale. About half of the EOA's funding went to programs with a direct chain of command linking local organizations to Washington, such as Job Corps, Work-Study, and Volunteers in Service to America (VISTA); the other half went to the Community Action Program (CAP), which funded ideas put forth by local organizations that were to be customized to the needs of different communities.Footnote 7 The OEO designated over 1,000 Community Action Agencies (CAAs) between 1965 and 1968 to coordinate these locally customized antipoverty initiatives.
The CAP was the most novel and idealistic part of the War on Poverty and, unsurprisingly, the most controversial. “Community action” was vaguely defined as a program “which provides services, assistance, and other activities to give promise of progress toward elimination of poverty or a cause or causes of poverty” (§202 a[2], emphasis added). The EOA also contained three radical provisions about how CAP grants could be made. First, CAP funds were to be allocated across states according to an apportionment index in the legislation. States with more of the nation's poor were supposed to get more funding. But within states, the OEO had complete discretion to spend its money in “any…geographical area” (§202a[1]). Second, funds need not flow through or to state or local governments. Instead, the EOA authorized the federal government to fund programs “conducted, administered, or coordinated by a public or private nonprofit agency (not a political party)” (§202a[4]). A final provision noted that CAP programs should be “developed, conducted, and administered with maximum feasible participation of residents of areas and members of groups served” (§202a[3]).Footnote 8
The combined effect of the EOA's provisions was to allow Shriver to circumvent state and local governments, which many believed had failed to alleviate poverty or, worse, been complicit or instrumental in its persistence. This direct funding mechanism allowed the federal government to work around de facto exclusion of the poor from designing programs to address their own povertyand de jure racial segregation that had restricted the political participation of African Americans.Footnote 9 CAPs aimed to empower the poor themselves to change their communities—to fight poverty while reforming local social institutions and undermining entrenched racial segregation (Forget Reference Galbraith2011).
These radical provisions would have mattered little had the demands of the OEO been modest or the financial stakes small. But Johnson's choice of Sargent Shriver to head the poverty task force and the EOA's funding for local organizations made the EOA matter.
Shriver had an impressive record of political effectiveness. According to Murray Kempton, Shriver could weather the political attacks of Congress by day but “then at night he will call up some power figure from [the Representative's] district and the next morning [the Representative] is unexpectedly slapped on the back of the head.”Footnote 10 Shriver maintained independent staffing and funding criteria. He also linked OEO funding to compliance with the 1964 Civil Rights Act and interpreted “maximum feasible participation” for CAA boards more strictly than was popular.
The federal funding at stake was large. From 1965 to 1968 the CAP funds amounted to a cumulative $2.64 billion (in real 1968 dollars). While small in relation to other federal expenditures, these funds were large relative to local government spending on related programs. Average, annual real CAP funding from 1965 to 1968 amounted to over a 25 percent increase relative to the sum of local government welfare expenditures in 1962. Furthermore, public welfare spending was often lower in the poor counties where CAP funds went. In 791 funded counties, average real CAP grants from 1965 to 1968 more than doubled 1962 public welfare spending. In addition, CAP grants were made to 83 counties which in 1962 spent nothing on public welfare (OEO 1965–1968; U.S. Bureau of the Census 1964).Footnote 11 Roughly 38 percent of CAP dollars went to Head Start and another 39 percent went to local initiative programs (Levitan Reference McKee, Orleck and Hazirjian1969, p. 123). CAP money, therefore, represented a tremendous increase in funding available for local antipoverty programs.
The direct financial stakes also understate the broader implications of federal dollars for communities. In addition to over 18 million people who participated in CAP programs (equivalent to half of America's poor), Shriver told Congress in 1965 that “the most important and exciting thing about the War on Poverty” was “that all America is joining in…religious groups, professional groups, labor groups, civic and patriot groups are all rallying to the call” (Gettleman and Mermelstein Reference Gillette1966, p. 207).Footnote 12 Similarly, the New York Times featured the “group of leaders” in “every city and community” who “believe this job can be done and who are helping.”Footnote 13 Importantly, CAP dollars may have crowded in local resources from public, private, and nonprofit sources, making the financial stakes even higher.Footnote 14
In summary, the EOA allowed tremendous federal discretionary power over a meaningful amount of resources. Our analysis adds to the historical literature on this topic by quantifying how the administration used this discretion in two steps. First, we investigate whether the OEO complied with the EOA's apportionment index, which was added as a check on the director's power. Second, we investigate how the OEO spent money within states, which was not prescribed by legislation. Both shed light on the how the War on Poverty was fought.
WAS THE INDEX BINDING? OEO FUNDING DECISIONS AT THE STATE LEVEL
The EOA nominally imposed a constraint on Shriver's discretion by requiring that the OEO allocate 78.4 percent of federal CAP funds (what we call “index eligible funds”) across the 50 states and the District of Columbia using the apportionment index. The index assigned a share of eligible funds to each state, s, in a fiscal year (FY; July 1 to June 30 in this period), t, using the following formula,

where UE is the state's share of the national number of unemployed, PA is the state's share of the national public assistance recipients, and PK is the state's share of poor children (defined as the number of children in families with household incomes below $1,000).Footnote 15 For instance, in 1964 Michigan was estimated to have 3.89 percent of the nation's public assistance recipients (295,278 out of 7,581,084), 4.04 percent of the nation's unemployed workers (154,700 out of 3,832,500), and 2.72 percent of the nation's children in families earning less than $1,000 (92,000 out of 3,382,000). Therefore, the index gave Michigan $7,124,240 or 3.55 percent of the 1964 index eligible CAP funding (U.S. House 1964b).
In practice, the EOA gave Shriver considerable discretionary power to withhold grants.Footnote 16 For instance, EOA §203(c) left it within Shriver's authority to reallocate CAP money designated for one state to the others. In addition, the EOA imposed no restrictions on Shriver's use of the remaining non-index eligible CAP funds, which made up 20 percent of the total. Even if the EOA permitted deviations in practice, the index apportionment provided a transparent benchmark by which politicians could evaluate whether their state had been shortchanged.
The historical record is rife with examples of Shriver's use of discretionary power. One highly publicized showdown in early 1965 featured Louisiana's governor, John J. McKeithen. McKeithen announced the appointees to run the EOA-funded antipoverty program, but many objected (and wrote to Washington) that the appointees were “rabid segregationists” (Germany Reference Gettleman, Mermelstein, Gettleman and Mermelstein2007, p. 49).Footnote 17 Although Shriver could not pick the appointees, he had the authority to withhold funding (which he did) if he disapproved. McKeithen appealed to Congress, the vice president, and the president, to no avail. Ultimately, McKeithen selected a new set of appointees, and OEO money began to flow into Louisiana.
But the OEO was not always successful. The Child Development Group (CDG), which obtained a grant to set up a Head Start program in rural Mississippi, shows how Congress could check the OEO's power. After a media bonanza at launch, the CDG infuriated politicians and other Mississippians because it offered a blueprint for desegregation in Mississippi's public schools. The administration ultimately backed down and reduced the CDG's funding when Senator John Stennis (D-MS), chair of the Senate Appropriations Committee, threatened to hold the president's other legislation hostage, including funding for the Vietnam War (Carter Reference Carter2009).
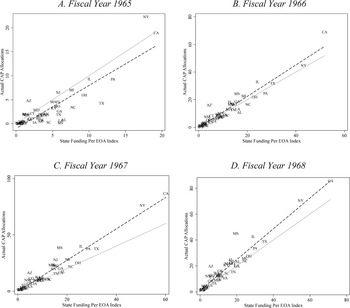
Figure 1 describes the OEO's use of discretion by examiningdeviations from the apportionment index. The horizontal axis plots each state's apportionment under the EOA and the vertical axis plots each state's receipt of funding. A state will fall along the 45-degree line (plotted as a solid line) if it received the minimum apportioned in the EOA and above/below it if the state received more/less than its index apportionment. Positive and negative deviations are interesting because they represent, respectively, the OEO's topping up of a state's apportionment with discretionary funding or its failure to reach an agreement with a particular local organization. The dashed line represents the least squares regression fit, shown in detail in Table 1A.
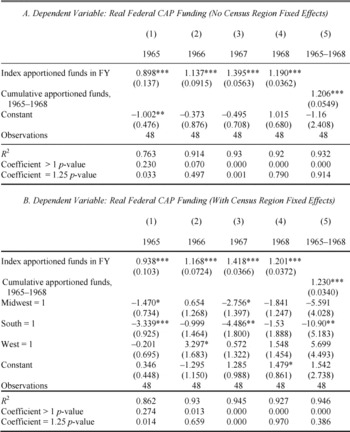
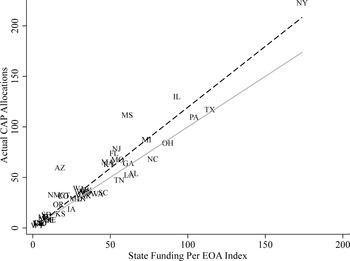
Between FY 1965 and 1968 federal EOA appropriations grew from $237 million (nominal dollars) to $867 million in FY 1968 (U.S. House of Representatives 1964b, §2; 1967, §2). The OEO's difficultiesspending its allocation in its first FY—due to Shriver asserting his authority and challenges setting up programs—is captured in Figure 1A. By the end of the first FY on 30 June 1965, the CAP had only existed for nine months and spending reached only $143 million of the budgeted $199 million in nondiscretionary funds. Forty-one states lie below the 45-degree line because they received less than their EOAminimum apportionment in federal funds. Many states fell very far below their apportionment: Mississippi received about 3 percent of its apportionment; South Carolina, 7 percent; and Nebraska, 11 percent. These surpluses at the OEO resolved within several years as local organizations developed more applications and as OEO administrators succeeded in making grants. By FY 1966 most states had moved closer to or exceeded the 45-degree line; many had crossed it (Figure 1B). In this year, each apportionment dollar translated into $1.14 in actual funding (Table 1A, column 2). By FYs 1967 and 1968 almost all stateslie near or above the 45-degree line and most exceeded it (Figures 1C and 1D). In these two years, each apportionment dollar translated into $1.40 and $1.19 in actual funding, respectively (Table 1A, columns 3 and 4). Aggregating over 1965 to 1968, the OEO hit the apportionment requirements for almost all states and, although not mandated by the EOA, tended to spend CAP discretionary funding in proportion to each state's index (Figure 2). For the overall period, the regression line slope is greater than the 45-degree line; every apportionment dollar translated into $1.21 in actual spending, almost the $1.25 one would obtain if the OEO, on average, allocated its discretionary 20 percent in proportion to the 80 allocated by apportionment index (Table 1A, column 5).
THE RELATIONSHIP OF 1965–1968 CAP SPENDING TO THE EOA APPORTIONMENT INDEX, BY FISCAL YEAR

THE RELATIONSHIP BETWEEN EOA POVERTY INDEX AND CAP SPENDING, 1965–1968

* = Significant at the 5 percent level.
** = Significant at the 1 percent level.
*** = Significant at the .05 percent level.
Notes:
Huber-White standard errors are in parentheses. Sample excludes Alaska, Hawaii, and the District of Columbia.
Sources:
See Figure 1.
THE RELATIONSHIP OF CUMULATIVE 1965–1968 CAP SPENDING TO THE EOA APPORTIONMENT INDEX

Three main conclusions follow. First, the EOA apportionment index was not absolutely binding at the state level. Consistent with Shriver's reputation and the historical literature on funding controversies, this analysis suggests that Shriver had a good deal of leeway and that he exercised it (at least in the program's early years). Over time, however, compliance with the poverty index increased as Congress and the public pressured the Johnson administration.
Second, the South was an important outlier (Table 1B), which is consistent with Alston and Ferrie's (Reference Alston and Ferrie1999) hypothesis about Southern politicians trying to dissuade Shriver from putting EOA money into their states. Contrary to the common perception that the South received more War on Poverty spending, Southern states averaged almost $11 million less in actual CAP funding than Northeastern states over the 1965 to 1968 period, after accounting for their shares of the nation's poor (Table 1B, column 5). The Southern disadvantage persists even in specifications including multiple covariates.
Third, the OEO largely allocated CAP funds across states in proportion to the apportionment index. This was the case both for the nondiscretionary index-apportioned spending and the discretionary spending. The apportionment index explains 76 to 93 percent of the variation in state-level CAP spending across the four fiscal years (Table 1A, columns 1–4) and exceeds 93 percent for the entire period (column 5). The inclusion of region fixed effects has almost no effect on this relationship (Table 1B). Considering the tremendous power given to the OEO director, President Johnson's reputation for playing politics, and the empirical literature showing Franklin D. Roosevelt's use of New Deal funds to build a longer-term political coalition, this compliance may be surprising. Yet compliance is consistent with Democrats having chosen the apportionment index and hints that fighting poverty reflected the Johnson administration's unconstrained choice.
HOW THE WAR ON POVERTY WAS FOUGHT: A COUNTY-LEVEL ANALYSIS OF OEO SPENDING
Within states, the EOA imposed no constraints on the distribution of funds, location of CAP project (such as a congressional district or city), or type of project funded. The rationale for this flexibility was that it allowed antipoverty programs to be customized to community needs and would create pressure for the reform of social institutions that perpetuated an economic underclass. In practice, this flexibility allowed the Johnson administration to pursue its broader agenda. How these funds were spent, therefore, reveals much about the Johnson administration's objectives.
The Competing Objectives of Politics and Poverty
Fighting poverty and building political coalition were potentially competing objectives determining the Johnson administration's funding choices. One hypothesis is that Johnson used the War on Poverty to forge a new electoral consensus, much as Roosevelt had used the New Deal (Wright Reference Wright1974; Couch and Shugart Reference Couch and Shughart1998; Wallis Reference Wallis1984, Reference Wallis1987, Reference Whatley1998, Reference Wimer, Fox, Garfinkel, Kaushal and Waldfogel2001; Fishback, Kantor, and Wallis Reference Fishback, Wallis, Crafts and Fearon2003; Fleck Reference Fleck2001; Fishback and Wallis Reference Fishback, Kantor and Wallis2012). Johnson cut his political teeth as a New Dealer and may have learned from Roosevelt's and Harry Hopkins’ alleged claim to “tax and tax and spend and spend and elect and elect” (Fishback Reference Fishback, Haines and Rhode2007). Congressional testimony following the EOA's first year claimed as much, saying that its funding had degenerated into “giant fiestas of political patronage.”Footnote 18
Building political consensus should result in measurable spending patterns. As Gavin Wright (Reference Wright1974) and Robert Fleck (Reference Forget2008) argue regarding the New Deal, a reelection-seeking president should spend more on swing districts. Because congressional races are determined by winning a plurality, Democrats would seek to convince the pivotal voter to put them in office (or keep them there) through greater spendingwhen a particular race is almost even. OEO funding could also be used to repay favors to prominent congressional committee members or chairs or to encourage favorable future votes for items on the Democrats’ agenda. This would result in more OEO funds being spent in areas served by powerful congressional committee members or chairpersons (Anderson and Tollison Reference Anderson and Tollison1991).
Our analysis tests the importance of political considerations by examining the relationship of OEO funding to the share of the county population voting for Democrats in the 1964 presidential election, the change in the Democratic vote share between 1960 and 1964 in the presidential election, whether Johnson won the county in the 1964 election, whether the 1964 presidential election was close (the margin of victory or loss was within 10 percentage points), and the interaction of a Democratic win with a close election. These political variables allow us to test whether CAP funds disproportionately flowed to those counties with stronger Democratic constituencies, those with newer (young) Democratic constituencies, or those districts Democrats narrowly lost but hoped to regain in the 1966 midterm elections. The analysis also examines the relationship between OEO funding and whether the county was represented by a member or chair of a major House committee during the 89th Congress (January 1965–December 1966).Footnote 19 These variables allow us to test whether major committee members or chairs brought more funding to their home districts (or kept it out).Footnote 20
A second (and potentially complementary) hypothesis is that the Johnson administration prioritized fighting poverty and racialdiscrimination, two pillars of his domestic campaign platform. This agenda may have been chosen because Johnson saw the platform's potential political benefits or because it reflected Johnson's long-suppressed humanitarian agenda. Robert Caro's biographies of Johnson document episodes during Johnson's rise to power that revealed “hints of compassion for the downtrodden, and of a passion to raise them up; hints that he might use power not only to manipulate others but to help others—to help, moreover, those who most needed help” (2002, p. xxi). Johnson also may have believed his domestic legacy wouldbethe antipoverty agenda. Speaking with Senator Joseph Clark (D-PA), Johnson commented, “Lincoln abolished slavery, and we're going to abolish poverty” (Miller Center Reference Newman and O'Brien1964).
Our analysis tests the importance of fighting poverty and racialdiscrimination by examining the relationship of EOA funding with measures of poverty and the nonwhite share of the population. Greater spending of EOA money in areas with higher poverty rates is broadly consistent with the Johnson administration targeting funds in accordance with the War on Poverty platform. We also examine the extent of this commitment. Whereas politically expedient adherence to the platform might result in the targeting of funds to areas with more citizens just under the poverty line, a more sincere (and less expedient) approach might target the most disadvantaged areas. These areas could show less measureable improvement by official poverty rates, even if livelihoods and individual welfare improved significantly (albeit not enough to cross the poverty threshold). We measure the intensity of disadvantage by the share of individuals in households with incomes below $2,000 and $1,000.
Spending OEO money in areas with more nonwhites is consistent with the Johnson administration's battle against racial discrimination and Johnson's antipoverty agenda. Not only did African Americans have twice the national poverty rate of whites, but de jure and de facto institutions limited their opportunities to escape poverty. The distribution of more OEO funding directly to communities with more racial minorities could empower these minorities to develop their own antipoverty programs. It also could diffuse civil unrest and rioting (Gillezeau Reference Ginzberg and Solow2012) or reduce crime rates by allowing minorities greater access to formal institutions (Cunningham Reference Cunningham2013). Moreover, even if money was not flowing to minorities directly, the OEO could threaten to withhold funding from whites to ensure greater cooperation. Thus OEO funding could help the federal government buy compliance with the 1964 Civil Rights Act and catalyze racial integration while fighting poverty.Footnote 21
Determinants of County-Level OEO Spending
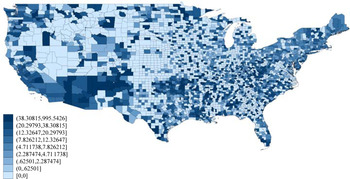
Figure 3 maps cumulative real per capita federal grants from 1965 to 1968 by county, with the more darkly shaded areas receiving more funding per person. Fewer obvious patterns emerge than might be expected. The counties of Appalachia are well funded, as are poor rural areas like the desert Southwest, eastern Oklahoma, and the Mississippi delta. Large cities and metropolitan areas received grants but not typically amounts out of proportion to their populations. Yet clusters of unfunded counties appear in eastern Mississippi, rural Georgia, and the eastern Carolinas: all high-poverty regions.
Our regression analysis describes the role of politics and poverty in determining EOA funding using the following linear specification,

Y is real cumulative CAP funding for years 1965 to 1968 in countyi, expressed as real 1968 dollars per 1960 county residents, purged of state-fixed effects. (Y can be thought of as the within-state variation in per capita EOA funding: the component of EOA funding that was not determined by the apportionment index.) The first two sets of covariates correspond to our two hypotheses: P is a row vector of covariates to measure political considerations, including the inverse population ratio (1,000/total county population), the 1964 Democratic presidential vote share, whether Johnson won the county in 1964, whether the presidential election was close, the interaction of whether the election was close and Johnson won, and the difference in Democratic vote shares between the 1964 and 1960 presidential elections.Footnote 22 In some specifications, we include variables for the power of the county's delegation in the 89th Congress. These variables include the proportion of representatives that are Democrats; indicator variables for whether any of the county's representatives were members of a major committee, chairs or minority leaders of a major committee, or part of the House leadership; and indicator variables for whether any of the county's representatives were both Democrats and held seats or powerful positions on major committees or in House leadership is a row vector containing covariates related to fighting poverty and racial discrimination. These include measures of the share of the countypopulation in households with annual incomes of less than $3,000 in 1960, measures of the intensity of poverty (share of individuals in households earning less than $2,000 and the share earning less than $1,000 in 1960), and the share of the population that is nonwhite.
COUNTY-LEVEL, PERCAPITA COMMUNITY ACTION PROGRAM SPENDING, 1965–1968

In addition, all specifications include other covariates, X, to account for other cross-sectional differences between counties that may have influenced the distribution of OEO funding: the shares of the county's population in urban areas, in rural farm areas, under age 5, over age 64, and of the very affluent (in households with annual incomes of $10,000 or more in 1960). X also includes the size of local government in terms of total local government expenditures per capita, local government welfare expenditures per capita, and total local government tax revenue per capita in 1962. We also include a riot intensity measure for the fiscal year of funding (Collins and Margo Reference Collins and Margo2007); a measure of the escalation of the Vietnam War (casualty rates), which many claimrobbed the War on Poverty of funding and Johnson of political and public support; and a proxy of Alston and Ferrie's “paternalism” using the share of sharecroppers in the total number of farm operators from the 1930 Census of Agriculture (U.S. Bureau of the Census 1930; Depew, Fishback, and Rhode Reference Fishback and Fishback2012).Footnote 23
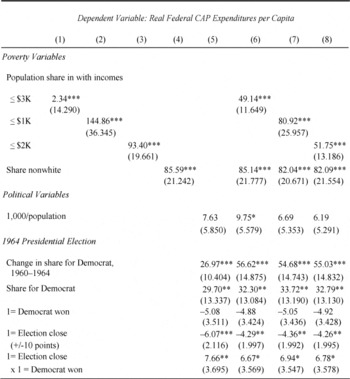
Table 2 presents the regression results. For brevity, Tables 2 and 3 suppress the point estimates for the covariates in X (the full set of estimates is reported in Appendix A). Huber-White standard errors are presented in brackets beneath each estimate. The first three columns present the point estimates of different metrics of county-level poverty rates and column 4 uses the share of the county population that is nonwhite. Column 5 adds the political variables. Columns 6 to 8 present the estimates with all of the variables combined using each of three poverty rates (the three measures are highly collinear, so they are not included together).
These results provide strong evidence that the Johnson administration used OEO funding to fight poverty. Within states where the poverty index did not bind, the population share in poverty (by three measures) and share nonwhite are individually statistically significant at the 1percent level and robust to the inclusion of other covariates in columns 6 through 8. But the effects are not large in an economic sense. A one-standard-deviation higher share of the 1960 population in households with incomes less than $3,000 (0.16) implies a $7.86 increase in real, cumulative per capita federal CAP funding—about one-fifth of a standard deviation in funding (column 6). The implied elasticities are similar for measures of the intensity of poverty. For a one-standard-deviation higher share of the 1960 population in households with incomesless than $1,000 and $2,000, columns 6 and 7 imply a similar increase in cumulative per capita federal CAP funding—0.14 and 0.17 of a standard deviation, respectively. By this metric, the population share of nonwhites, however, is about twice as economically important. A one standard-deviation higher share of nonwhites (0.16) implies a $14 increase in real, cumulative per capita federal CAP funding—over one-third of a standard deviation in the dependent variable (columns 6 to 8).
COUNTY-LEVEL CORRELATES OF CAP SPENDING, 1965–1968


* = Significant at the 5 percent level.
** = Significant at the 1 percent level.
*** = Significant at the.5 percent level.
Notes:
The unit of observation is a county or “super-county,” whichever is the lowest unit of geographic aggregation observed in all of our data sources. Estimates are obtained by ordinary least squares regression of the specification described in equation 2. The dependent variable is the residual of a regression of real federal expenditures through the Community Action Program from 1965 to 1968 on state-fixed effects. Suppressed covariates include percent of a county's population that is rural or farm and percent that is urban, under the age of 5, over the age of 64, or lives in a household with more than $10,000 in annual income. They also include the Vietnam casualty rate, a measure of riot intensity (Collins and Margo Reference Collins and Margo2007), the number of sharecroppers per total farm operators, local government's direct expenditures per capita (1962), direct expenditures on welfare (1962), and total tax receipts per capita (1962). Estimates are unweighted. Huber-White standard errors are in parentheses. The county sample includes the coterminous United States, excluding the District of Columbia.
Sources:
See the Data Appendix for more details and Analysis Appendix for coefficients on suppressed covariates.
Political considerations also shaped decisions at the OEO. A one-standard-deviation increase in Democratic share in the 1964 presidential election has roughly the same effect as a one standard-deviation increase in poverty—about 0.16 of a standard deviation increase in funding. Not only did more Democratic counties receive more money per capita, funds also rewarded districts with larger increases in Democratic share in the presidential elections between 1960 and 1964, with a one-standard-deviation increase in this variable leading to 0.20 of a standard deviation increase in funding. Whereas swing counties received less funding, swing counties won by Democrats received slightly more ceteris paribus. These findings are robust to the inclusion of identical covariates for the 1960 presidential election as well as to alternative definitions of “swing” areas. In short, the Johnson administration invested in its new Democratic constituency by directing OEO funds to Democrat-trending areas as well as to Democratic strongholds. In contrast, we find no evidence that congressional committee membership during the 89th Congress mattered at all (the results for the 88th and 90th Congress do not alter this conclusion). Counties with representatives on major House committees, chairing major committees, or in positions of leadership (Democratic or Republican) have no predictive power in any of our regressions.
Presidential politics, however, explains very little of county-level OEO's funding decisions. To make the relative contributions of poverty and politics more explicit, we summarize the partial R Footnote 2 values of these sets of variables at the bottom of Table 2—a simple metric for determining how much of the variation in within-state per capita CAP funding is explained by the set of poverty variables or the set of political variables.Footnote 24 The R Footnote 2 value for the political variables is 0.004 (column 5), significantly lower than for the poverty variables. Across specifications, approximately 3 percent of the variation in funding is explained by poverty, or 30 percent of the variation explained by the model. Politics explains less than 1 percent in all cases.
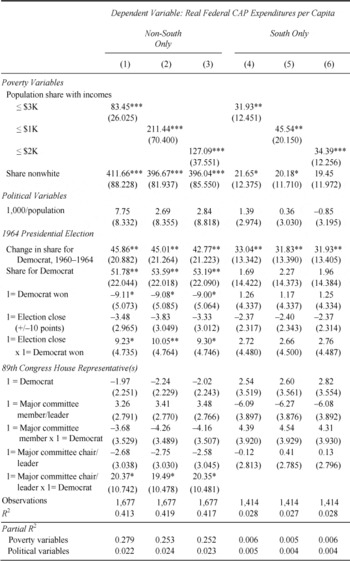
Much of the history of the War on Poverty focuses on the South and its interaction with civil rights. The majority of nonwhites lived in the South, and Table 2 shows that the nonwhite population share played an important role in shaping OEO funding. Moreover, the paternalism hypothesis (Alston and Ferrie Reference Alston and Ferrie1993; Reference Alston and Ferrie1999) suggests that local economic, demographic, and political considerations may have had different effects in the South. For both reasons, Table 3 splits our sampleinto non-Southern and Southern counties, roughly partitioning the country into halves (46 percent of all counties are in the South).
The results highlight some similarities and differences between the regions: poverty rates and share nonwhite have a strong and robustrelationship to OEO spending. Similarly, changes in the share of a county voting for Democrats also matters in both regions, although Democratic strongholds do not appear to be rewarded in the South (where most places were Democratic strongholds). The economic significance of each of these variables, however, is weaker in the South. A one-standard-deviation increase in Southern poverty rates or share nonwhite implies a 0.12 and 0.11 standard deviation increase in EOA spending, respectively (column 4). This is one-half (for poverty) to one-fifth (for share nonwhite) the magnitude of these effects in the rest of the United States (column 1).
The results also reveal striking differences in funding patterns between the two regions. First, roughly 40 percent of the variation in per capita OEO funding is explained by the model in non-Southern regions (partial R Footnote 2 , columns 1 to 3). In the South, less than 3 percent is explained by the model (columns 4 to 6). Second, the lion's share of the explained variation outside the South is accounted for by the poverty variables (25 to 27 percent), whereas in the South very little of the variation is explained by poverty measures (less than 1 percent in all cases). Third, presidential politics seem to matter very little in general and even less in the South. Putting aside the fact that these estimates are statistically insignificant, their magnitude in the South is half the size of the implied effects elsewhere.
Correlations of OEO Spending with Electoral Outcomes
Our final analysis investigates whether EOA money was successful in building the Democratic coalition. Our analysis draws upon estimates by Jerome Clubb, William Flanigan, and Nancy Zingale (Reference Clubb, Flanigan and Zingale2006) of House election voter turnout and share of votes for Democrats by county using a panel version of equation 2 which omits the political variables and includes state-by-year fixed effects,
![\[
\begin{array}
\
Y_{it} = \sum {_y \left[{H'_i \theta + X'_i \beta } \right]1\left({t = y} \right) + \rho _{s\left(i \right),t} + \phi _i + \varepsilon _{i,t} }
\end{array}
\](https://static.cambridge.org/binary/version/id/urn:cambridge.org:id:binary:20160927091142808-0862:S0022050714000291:S0022050714000291_eqn3.gif?pub-status=live)
where Yit is now voter turnout or share of votes cast for Democratic candidates in county i, in year t = 1950, 1952, …, 1958, 1962, …, 1972 (note: 1960 is omitted); ϕi are county-fixed effects; ρ s(i),t are state-by-year fixed effects; and other variables remain as previously defined. The specifications describe changes in voter turnoutand support of Democrats in poorer and more nonwhite counties after accounting for secular changes in state politics, redistricting in the state-by-year fixed effects, and the time-varying effects of other covariates.
COUNTY-LEVEL CORRELATES OF CAP SPENDING IN THE SOUTH AND NON-SOUTH, 1965–1968

Notes:
See Table 2 notes for specification and other details. In columns 4–6, interactions of 1 = Represented by a House Democrat with committee membership and chairmanship/leadership are omitted due to collinearity.
Sources:
See the Data Appendix for more details.
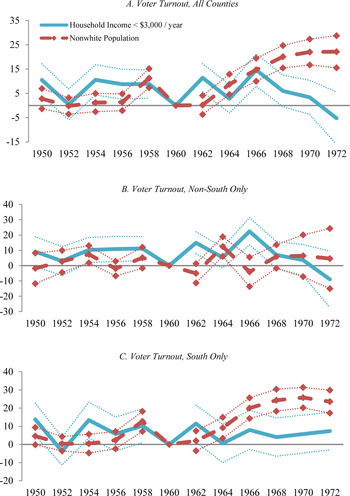
Figure 4 supports the claim that OEO spending boosted voter turnout (panel A) and support of the Democrats (panel D) in poor areas. Panel A plots the point estimates for each year on the interaction between year and either (1) the share of the population in households earning less than $3,000 per year (solid line) or (2) the share nonwhite (dashed line). Except for a short-term increase in 1958, the relationship of sharenonwhite (dashed line) to voter turnout is stable from 1950 to 1962. In 1964, however, the relationship increases rapidly. Counties with a one percentage point higher share nonwhite in 1960 experienced a 0.20 percentage point increase in voter turnout during the 1968 election—a pattern driven by higher turnout in nonwhite counties of the South. A more modest and short-run relationship is seen for poorer counties, which experienced low turnout in 1960 and 1964 relative to the Eisenhower era, only to surge to their highest level in 1966 before falling steadily from 1968 to 1972.
One interpretation of this result is that the groups the OEO intended to empower, especially nonwhites, became more politically engaged during the 1960s. If this were the case, the share of voters supporting Democrats should also grow in poorer and more nonwhite areas where turnout increased after 1964. But panel D shows this is only part of the story. After steadily decreasing during the 1950s and early 1960s, support for Democrats in poorer areas increased from 1964 to 1968 (solid line). A one-standard-deviation higher poverty rate in 1960 (0.16) implies a 1.8 percentage point (11.3 × 0.16) higher Democratic vote share in the 1966 election, or an increase of 3.5 percent. Because turnout was not trending this way, the War on Poverty may have won over existing voters or changed the composition of who went to the polls. The reverse appears to be true for more nonwhite areas. Again, after the 1950s and early 1960s, when the relationship between nonwhite population share and share voting for Democrats changed little, the Democratic vote share in areas that were more nonwhite decreased rapidly between 1964 and 1968.A one-standard-deviationhigher share nonwhite in 1960 (0.16) implies a 1.4 percentage point (8.7 × 0.16) or 2.8 percent lower vote share in the 1968 election. The rising turnout in more nonwhite counties, therefore, reflected increases in votes for Republicans. This is consistent with backlash voting or to growing disillusionment with the War on Poverty.
COUNTY-LEVEL ELECTION OUTCOMES IN THE HOUSE OF REPRESENTATIVES BY YEAR AND COUNTY CHARACTERISTICS


Notably, these patterns differ across regions. Voter turnout in poor areas increased in non-Southern regions (Figure 4B) but not in the South (Figure 4C), whereas voter turnout in nonwhite areas increased in the South (Figure 4C) but not in non-Southern areas (Figure 4B). Interestingly, the share of the vote for Democrats changed little in poorer areas of the non-South (Figure 4E), whereas Democratic vote share rose sharply in poorer areas of the South (Figure 4F). For more nonwhite areas, Democratic vote share increased in the non-South (Figure 4E) but fell sharply in the South (Figure 4F). On the whole, these results are consistent with the Democrats’ strategy backfiring, but only somewhat. Although turnout increased after 1964 in areas getting greater EOA funding, Democrats gained fewer of these votes than the Republicans did, and in the region where they gained the greatest share among the poor—the South—they appear to have lost more to the politics of race (see also Cascio and Washington (Reference Cascio and Washington2014) on the role of the Voting Rights Act).
REMEMBERING THE WAR ON POVERTY: THE IMPORTANCE OF POLITICS
Just a few years after Johnson's bold 1964 State of the Uniondeclaration, the OEO's demise began. As early as 1967 Congresstransferred control of some of its programs to local governments. Largely due to discontent over the Vietnam War, Johnson dropped out of the 1968 presidential election. Under President Richard Nixon, more OEO programs were transferred to other federal agencies and, ultimately, the office was disbanded. The conventional wisdom about the War on Poverty and the OEO has become that they failed.
How this conventional wisdom came to be is not precisely known. It emerged in the late 1960s and early 1970s as the official poverty rate plummeted to reach its historic low of around 11 percent in 1973, down from 19 percent in 1964. Even though presidents are generally held accountable for changes in economic outcomes occurring during their administration (regardless of whether they caused them), Johnson did not get credit for the 30 percent drop in poverty (6.2 percentage points, over 19.1 official poverty rate in 1964) from 1964 to 1968.
One hypothesis for the conventional wisdom that the War on Poverty failed is that its programs did not work. Recent work, however, suggests that the War on Poverty had a large impact on poverty (Bailey and Danziger Reference Bailey2013). Some of this effect was immediate. Recent work extending the supplemental poverty measure (which takes a fuller accounting of changes in noncash transfers and those through the tax code) backwards in time shows that poverty rates fell from almost 26 percent in 1967 to 16 percent today, a fall greatly aided by programs begun under the War on Poverty (Wimer et al. Reference Wimer, Fox, Garfinkel, Kaushal and Waldfogel2013). A complementary, consumption-based measure of poverty registers a 26 percentage point decline from 1960 to 2010, with just over two-thirds of this decline occurring before 1980 (Meyer and Sullivan 2012). Many benefits were also longer-run in nature: a growingliterature argues that many War on Poverty programs were fairly successful at increasing human capital, improving health, and reducing racial inequality over the longer term (Ludwig and Miller Reference McKee2007; Chay, Kim, and Swarminathan Reference Chay, Kim and Swarminathan2010; Cascio et al. Reference Cascio, Gordon and Lewis2010; Almond, Hoynes, and Schanzenbach Reference Almond, Hoynes and Schanzenbach2011; Bailey Reference Bailey2012; Gillezeau Reference Ginzberg and Solow2012; Bailey and Goodman-Bacon Reference Bailey2012; Bailey Reference Bailey2013; Cunningham Reference Cunningham2013; Almond et al. Reference Almond, Chay and Greenstoneforthcoming). In short, it seems puzzling that the Johnson administration did not get credit for some of these successes.
A second hypothesis is that the “failure” narrative reflects the success of critics in rewriting history. But this claim forgets the fact that President Ronald Reagan's quip in his 1988 State of the Union that “the federal government fought the war on poverty, and poverty won” was not new. Allegations of the War on Poverty's failure dates to critics in both political parties. Accounts from the late 1960s argued that the CAP programs were born of conflicting ideas and administrative chaos—the programs of professors, not practitioners (Levine Reference Ludwig and Miller1970; Forget Reference Galbraith2011).Footnote 25 Prominent scholars agreed saying that the War on Poverty's “promises were extreme; the specific remedial actions were untried and untested; [and] the finances were grossly inadequate” (Ginzberg and Solow Reference Haines1974, p. 219).
The difference in historical memory of the War on Poverty and the New Deal is striking. Although the New Deal's effectiveness as a set of policies has been contested in scholarship, its policies—even without a large or immediate rebound in private sector employment—were regarded as successful at the time and today are remembered as successes. This collective memory of the New Deal's success transcends party lines. When criticized for dismantling New Deal programs, Reagan corrected reporters noting he had voted for Roosevelt four times and remarked, “I'm trying to undo the Great Society…it was LBJ's war on poverty that led us to our present mess” (Berkowitz Reference Berkowitz, Farber and Bailey2001, p. 98). Although the Great Depression lasted, Roosevelt's New Deal programs are not remembered as failures.
This article's analysis provides hints regarding a third hypothesis for the belief that the War on Poverty failed: implementation. Our finding that the Johnson administration distributed CAP funds to poorer areas—rather than those with greater political importance—shows how differently from the New Deal the War on Poverty was waged. Rather than including and empowering state and local politicians and community leaders in the allocation process as in the New Deal, OEO funds were used to circumvent and challenge these interests. OEO funds flowed to poor and nonwhite areas, which empowered new constituencies of poor and African Americans. Our quantitative analysis underscores these differences. Measured by partial R Footnote 2 , Wallis's (Reference Fishback, Wallis, Crafts and Fearon2003) political variables explain 25 percent of the county-level distribution of New Deal spending. The equivalent variables during the War on Poverty explain roughly 1 percent of the variation in OEO county-level spending (see Analysis Appendix Table 5). Unlike New Deal funding, OEO grants did not flow to (or away from) areas with powerful congresspersons or meaningfully reward swing voters that helped Democrats win the most liberal Congress since the New Deal.
In line with many contemporary accounts and retrospectives, our analysis suggests that OEO funding generated backlash and appeared to hurt Democrats in the late 1960s and early 1970s—especially relating to the politics of race in the South. Unlike the New Deal, which engendered good will for decades, the War on Poverty generated resentments—and, in the shorter term, votes for Republicans, especially in areas with more African American voters.
Given Johnson's ambition to recreate Roosevelt's style and political reputation, the differences between the political economy of the New Deal and War and Poverty are striking. Just days after Kennedy's assassination, a staffer advised Johnson to focus on small, popular policy proposals instead of bold—and divisive—goals like civil rights. Johnson responded, “What the hell's the presidency for?” (Caro Reference Caro2012, p. 428). The OEO's focus on fighting poverty and racial discrimination—over politics as usual—is consistent with this humanitarian vision. The quantitative picture that emerges from our analysis of the War on Poverty is that of a sincere attempt, albeit an underfunded one, to champion change.