


Livestock agriculture is at the nexus of two of the most pressing global environmental challenges of the 21st century: climate change and air pollution. It is responsible for ∼12% of global greenhouse gas (GHG) emissions, with methane accounting for more than half of these emissions, arising primarily from enteric fermentation and manure management practices (FAO, 2023). Methane is a powerful GHG, with a global warming potential 27 times higher than carbon dioxide over a 100-year period (Intergovernmental Panel on Climate Change (IPCC), 2023). In parallel, livestock are also the largest single source of ammonia emissions, contributing nearly half of the global total (47%), largely from manure management (Wyer et al., Reference Wyer, Kelleghan, Blanes-vidal, Schauberger and Curran2022; Yang et al., Reference Yang, Liu, Liu, Ding, Xu and Liu2023). Ammonia drives acidification and eutrophication of sensitive ecosystems, contributes to biodiversity loss and degrades air quality by promoting the formation of fine particulate matter (Wyer et al., Reference Wyer, Kelleghan, Blanes-vidal, Schauberger and Curran2022; Beaudor et al., Reference Beaudor, Hauglustaine, Lathière, Van Damme, Clarisse and Vuichard2025).
Despite their common agricultural origins, policies to reduce GHG emissions and those to improve air quality (partly by reducing ammonia emissions) are typically developed under separate legislative frameworks. For example, global climate action is driven by the Paris Agreement (194 countries plus the European Union at the time of writing) and the Global Methane Pledge (www.globalmethanepledge.org), which, as of June 2025, had 160 signatories committed to a 30% reduction in methane emissions by 2030 relative to 2020 levels. In contrast, ammonia mitigation is primarily addressed through regional agreements such as the Gothenburg Protocol, which sets legally binding emissions reduction commitments for ammonia and other pollutants (currently 31 signatories). This separation of policy frameworks risks overlooking important interactions between methane and ammonia emissions, thereby masking the net environmental outcome of agricultural interventions.
These interactions are rooted in the biological processes that generate the two gases. For instance, decreasing crude protein levels in the diet of cattle will result in reduced nitrogen excretion in urine, and so decreased ammonia volatilisation (Sajeev et al., Reference Sajeev, Amon, Ammon, Zollitsch and Winiwarter2018a) and indirect nitrous oxide (N2O) emissions following ammonia deposition. However, the resulting impact on enteric methane depends on how the diet is reformulated to meet energy demands. For example, one mechanistic model of dairy cattle digestion suggested that if soybean meal or distillers’ grain (high protein) is replaced with beet pulp (high fibre), then we would expect ammonia to decrease, but enteric methane to increase. In contrast, if it were replaced with barley (high starch) we would expect enteric methane to decrease (Dijkstra et al., Reference Dijkstra, Oenema and Bannink2011; Sajeev et al., Reference Sajeev, Amon, Ammon, Zollitsch and Winiwarter2018a). This illustrates that mitigation measures may create unintended cross-effects across pollutants (coupled changes that could either present trade-offs where one type of pollution decreases but the other increases, or co-benefits where both decrease) depending on the underlying nutritional and metabolic pathways.
Despite this theoretical acknowledgement, in-animal studies mostly focus on either methane or ammonia in isolation. A wide variety of nutritional strategies have been proposed to reduce enteric methane emissions, including reducing dietary fibre, increasing dietary lipid and inclusion of methane-suppressing feed supplements (Beauchemin et al., Reference Beauchemin, Ungerfeld, Abdalla, Alvarez, Arndt, Becquet, Benchaar, Berndt, Mauricio, McAllister, Oyhantçabal, Salami, Shalloo, Sun, Tricarico, Uwizeye, De Camillis, Bernoux, Robinson and Kebreab2022). In particular, methane-suppressing feed supplements have seen a rapid increase in the number and type of products being tested in the past decade. Ammonia emissions, in turn, can be effectively reduced by adjusting dietary protein levels to better match animal requirements (Sajeev et al., Reference Sajeev, Winiwarter and Amon2018b).
This lack of integrated empirical assessment presents both a scientific and policy gap, making it difficult to assess the net environmental impact of interventions or to generalise findings across studies and intervention types. Without quantifying cross-effects between GHGs and ammonia, it is impossible to determine whether mitigation strategies typically achieve genuine overall benefits or merely shift environmental burdens. To begin addressing this gap, we conducted a meta-analysis of nutritional interventions to reduce either enteric methane emissions or ammonia emissions in dairy cows using a hierarchical Bayesian modelling framework. This approach allows joint inference on correlated outcomes while accounting for between-study heterogeneity and uncertainty. The objective was to characterise the effectiveness of recently studied strategies on both methane and ammonia, quantifying how strategies designed to reduce either emission may influence the other, thereby providing evidence to inform more effective and coherent policies at the interface of climate and air-quality goals.
Materials and methods
Data collection
Because the objective was to quantify cross-effects between emissions, studies that gave joint observation of both outcomes within the same study were essential to estimation and were prioritised as likely to provide the most important information. Studies that measured only one gas may give some information, under the assumption that these studies are otherwise similar to studies where both gases are measured but can do little to elucidate the methane-ammonia relationship. Thus, our literature search was conducted to restrict to papers reporting measures of both methane and ammonia production.
Initial scoping searches indicated that relatively few studies reported direct measurements of both methane and ammonia emissions. To retain a sufficient evidence base while preserving the ability to estimate joint effects, we therefore included established proxies for each gas in the literature search. Methane production was proxied using molar ratios of volatile fatty acids (VFAs) in rumen fluid, which have been shown to reflect shifts in hydrogen balance and methanogenesis (Moss et al., Reference Moss, Jouany and Newbold2000; Williams et al., Reference Williams, Murray, Jacobs, Wales and Moate2019; Park et al., Reference Park, Cho, Jeon and Choi2024). Ammonia production was proxied using milk urea nitrogen (MUN) concentration, a widely used indicator of ruminal ammonia status and nitrogen excretion (Burgos et al., Reference Burgos, Embertson, Zhao, Mitloehner, DePeters and Fadel2010).
Literature searches were conducted in Scopus, Web of Science and Google Scholar. Searches were performed between January and July 2023. The following queries were used in Scopus searching in the title, abstract and keywords (equivalent searches were conducted in Web of Science and Google Scholar):
1. For measured methane and ammonia: (dairy OR cow OR heifer OR cattle) AND (methane AND ammonia) AND (chamber OR ‘head chamber’ OR head-chamber OR respiration OR Greenfeed OR SF6). Returned 86 papers.
2. For methane and MUN: (dairy OR cow OR heifer OR cattle) AND (methane) AND (‘milk urea nitrogen’ OR ‘milk urea’ OR MUN). Returned 54 papers.
3. For ammonia emissions and rumen VFAs: (dairy OR cow OR heifer OR cattle) AND (ammonia) AND (‘volatile fatty acid’ OR VFA). Returned 999 papers.
4. For MUN and VFA: (dairy OR cow OR heifer OR cattle) AND (‘milk urea nitrogen’ OR ‘milk urea N’ OR MUN) AND (‘volatile fatty acid’ OR VFA). Returned 72 papers.
Inclusion and exclusion criteria
Following an initial screening of titles and abstracts, studies were included if they met the following criteria:
1. Full manuscripts published in peer-reviewed journals.
2. Published between January 2010 and July 2023.
3. Reported primary data from in vivo experiments on dairy cows.
4. Measured at least two relevant outcomes within the same study:
i. Enteric methane and ammonia production rates (emission per animal per unit time).
ii. Enteric methane production rate and MUN concentration.
iii. Ammonia production rate and rumen VFA concentrations.
iv. MUN concentration and rumen VFA concentrations
5. Included a clear description of experimental design and a control group.
6. Reported mean values for treatment and control groups.
7. Reported a measure of variance (standard error [SE] or standard error of the mean [SEM] or standard deviation [SD]).
A physiologically implausible upper limit of 50 mg/dl was applied to MUN concentration, resulting in the exclusion of one outlier study. Only one study used head chambers to measure gas concentrations, producing data that were not directly comparable with other methane measurement methods; therefore, this study was also excluded from the analysis. A flow diagram showing the paper exclusion process is given in Figure 1.
Flow diagram of the study exclusion process.

1 Long description
The flowchart outlines the study selection process starting with ′Records from Scopus search: n = 1113′ and ′Additional records from other sources: n = 98′. After removing duplicates, ′Records remaining: n = 1162′. Exclusions are listed as follows: ′Non-primary research: n = 76 excluded′, ′Full text not accessible or non-English: n = 47 excluded′, ′In vitro studies: n = 225 excluded′, ′Study subject was not a pure-bred Bos taurus lactating dairy cow: n = 562 excluded′, ′Treatment not relevant: n = 130 excluded′ and ′Required response variables not measured: n = 69 excluded′. After screening, ′Records remaining: n = 53′. Further, ′Studies removed for technical reasons (outlier/methodology): n = 2 excluded′. Finally, ′Studies included in the analysis: n = 51′.
Data extraction
The first author, publication year and journal reference were extracted and assigned a paper ID. Categorical variables to be included in the meta-analysis (climate, treatment type, paper aim, study design and measurement method) were categorised as shown in Table 1. Treatments were also categorised by ‘type’ (e.g., feed supplement, manipulation of fibre content, manipulation of protein content or ‘other’). Treatment and control means for gaseous emissions, MUN and VFA concentrations and dry matter intake (DMI), along with their associated measures of variance (in particular, SEM), were extracted. Units were converted, where necessary and if possible, to g/day for methane production rates, kg/day for DMI, mg/dl for MUN concentration and molar percentage for VFAs, with a corresponding adjustment for their SEMs. The dataset used in the analysis is available in Supplementary Material 1.
Variables extracted from the literature and considered in the analysis

Table 1 Long description
Continuous variables listed are methane, gaseous ammonia, milk urea nitrogen, acetate butyrate propionate, and dry matter intake. Methane is described as gaseous emissions and a response variable, with units g per day. Gaseous ammonia is described as gaseous emissions and a response variable, with units g per day. Milk urea nitrogen is described as concentration in milk and a response variable, with units mg per dL. Acetate butyrate propionate is described as relative molar concentrations in rumen and a response variable not used in final analysis, with units mol per 100 mol. Dry matter intake is described as dietary quantity and a covariate in analysis, with units kg per day. Categorical variables listed are measurement method, climate, study aim, study design, and treatment type noted as not in main model. Measurement method applies to methane only and includes respiration chamber, GreenFeed, and SF6. Climate categories are temperate and tropical. Study aim categories are methane reduction, ammonia milk urea nitrogen reduction, and other. Study design categories are yes and no for whether sophisticated blocking was used. Treatment type categories are additive, fibre, and protein.
MUN, milk urea nitrogen.
Data analysis
Exploratory analyses
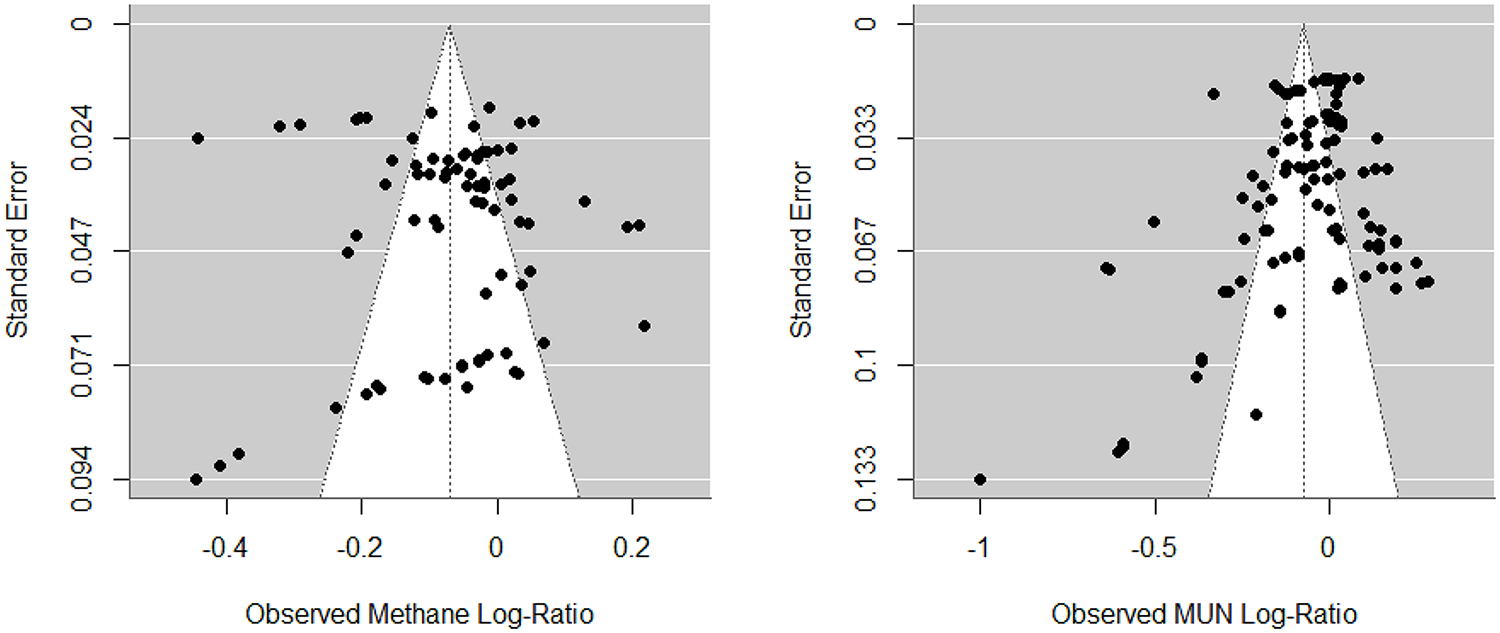
As an exploratory assessment of potential publication bias and heterogeneity, a funnel plot was constructed of the observed effects on methane production and MUN concentration. This was computed using the log-ratios of the treatment and control means from all studies, with SEs estimated by Monte Carlo simulation from reported SEMs, assuming a moderate level of correlation between treatment and control errors (ρ = 0.5). The funnel plots were created using the Metafor package (Viechtbauer, Reference Viechtbauer2010) in R (R Core Team, 2025).
Further exploratory analysis was used to establish a tractable model. Most significantly, this found that VFA ratios in rumen fluid, though suggested as a proxy for methane emissions, were poorly associated with methane across the 15 studies where both were measured. This was tested by fitting linear models attempting to predict methane production rates using all VFA ratios simultaneously as predictors, and by attempting to predict the treatment-to-control log-ratio of methane production using all the corresponding log-ratios for the VFA quantities. In both cases, adjusted  ${R^2}$ values were close to zero, indicating weak and inconsistent associations when considered in our cross-study context. On this basis, and because there were enough studies measuring methane directly, VFA concentrations were excluded from the final model as a proxy for methane production. This resulted in no additional papers being excluded, as they all contributed other relevant information to the model.
The data motivated us to treat MUN, which had been suggested as a proxy for ammonia emission, very differently. Only five studies directly measured gaseous ammonia, often using heterogeneous methodologies, and only two studies covering five treatments measured both gaseous ammonia and MUN concentration. This limited the identifiability of models attempting to directly estimate the joint relationship between methane and gaseous ammonia emissions and meant we could not reliably verify the efficacy of MUN as a proxy for ammonia. Yet, MUN measurements were plentiful, and thus it was necessary to assume that they were a reasonable proxy to use to assess the interrelation between the two types of emissions. To prioritise model stability and internal validity, the primary analysis therefore focused on methane emission rates and MUN concentration as the nitrogen outcome. The modelling still incorporated the small set of studies that reported gaseous ammonia by supposing that these ammonia readings might be imprecisely associated with a predicted MUN concentration. Adopting this form of the model meant that high uncertainty in this relationship would only impact these studies and thus would not have a large negative impact on inference on the rest of the model.
Treatment type was initially considered for inclusion in the model; however, it was frequently confounded with study aim (e.g., all studies categorised as manipulation of protein content had a study aim to reduce ammonia emissions). Replacing study aim with treatment type means fewer studies per group, leading to more uncertain results, and so it was left to a secondary analysis.
Bayesian modelling
It was supposed that there are true but unknown quantities for the efficacy of each treatment in reducing MUN concentration or methane production, with relationships between these quantities across treatments and studies, governed by various characteristics of the studies (Table 1). A statistical process together with plausible prior assumptions determined how these quantities would be related to forecasts of the observed results from the studies. The actual observed results fed into this model then resulted in posterior estimates giving credible values for derived quantities of interest, such as the relationship between reductions in MUN concentration and methane production. This is an example of a Bayesian hierarchical model (Gelman et al., Reference Gelman, Carlin, Stern, Dunson, Vehtari and Rubin2014). Figure 2 shows a conceptual diagram of its components, and a full mathematical description of the model is given below.
Graphical depiction of the Bayesian hierarchical model used in the meta-analysis. Green nodes relate to observed mean values for the responses methane, milk urea nitrogen (MUN) and gaseous ammonia; blue nodes relate to observed explanatory covariates in the model; and the remaining nodes relate to unknown quantities in the model inferred during fitting. Lines between nodes indicate drivers for quantities in each node.

Figure 2 Long description
A Bayesian hierarchical model with various nodes and connections. At the top left, a node labeled ′Climate, CH4 measurement method′ connects to ′True Methane and MUN (Control)′ via a line indicating ′Mean plus Variance′ and a ′Log-normal distribution′. Below, ′Study arm′ connects to ′Study Mean Treatment Effect′ and ′Individual Treatment Effect′ through lines labeled ′Mean plus Covariance′ and ′Covariance′, respectively. These nodes connect to ′True Methane and MUN (Treated)′ and ′True Gaseous Ammonia (Control and Treated)′ through ′Normal distribution′ lines. ′True Methane and MUN (Control)′ links to ′True Methane and MUN (Treated)′ and ′True Gaseous Ammonia (Control and Treated)′ with lines labeled ′Control plus Exp(Treatment effect) times Log(DMI ratio)′ and ′Linear model′. The right side features a green dashed box labeled ′Observation Model′ containing ′Observed Methane and MUN′ and ′Observed Gaseous Ammonia′, connected by lines labeled ′Mean′. At the bottom right, ′Study design information (BSEM, Blocking type)′ is shown. The diagram represents relationships and statistical processes in the model.
Capital letters indicate unobserved variables, and Greek symbols are used for model parameters. Names in text are used for observed emissions data or proxies and explanatory covariates.
Let  ${M_{ij}}$ and
 ${U_{ij}}$ be the true unobserved log-transformed methane and MUN expected mean values, respectively, for treatments
 $j = 0,1,2,\, \ldots $ in study
 $i = 1,2,\, \ldots $, where
 $j = 0$ is the control. We assume the control log means for methane and MUN are independently normally distributed with means and variances that depend on methane measurement method and study climate zone, respectively.
 \begin{equation}{M_{i0}}\sim{N}\left( {{\mu _{m,{\text{method}}\left( i \right)}},\sigma _{m,{\text{method}}\left( i \right)}^2} \right)\end{equation}
 \begin{equation}{U_{i0}}\sim{N}\left( {{\mu _{u,{\text{climate}}\left( i \right)}},\sigma _{u,{\text{climate}}\left( i \right)}^2} \right)\end{equation}
For treatments  $j = 1,2,\, \ldots $ and study
 $i = 1,2,\, \ldots $,
 ${M_{ij}}$ and
 ${U_{ij}}$ are sums of the corresponding control log mean values, a linear effect of the log DMI ratio between treatment and control,
 $lrDM{I_{ij0}}$, and between-study treatment effects,
 ${\dot M_i}$,
 ${\dot U_i}$, and within-study treatment effects,
 ${\ddot M_{ij}}$,
 ${\ddot U_{ij}}$, which are both correlated bivariate normal with parameters for this distribution depending on the study’s aim. That is, for treatments
 $j = 1,2,\ldots$
 ${M_{ij}} = {M_{i0}} + {\dot M_i} + {\ddot M_{ij}} + {\gamma _{\text{m}}}lrDM{I_{ij0}}\,{\text{and}}\,{\dot U_{ij}} = {U_{i0}} + {\dot U_i} + {\ddot U_{ij}} + {\gamma _{\text{u}}}lrDM{I_{ij0}},$ where
 \begin{equation}\begin{gathered}
{{\dot M}_i} \sim N({\mu _{mv,aim(i)}},\,\sigma _{mv,aim(i)}^2),\,\,{{\dot U}_i} \sim N({\mu _{mv,aim(i)}},\,\sigma _{mv,aim(i)}^2)\,\,{\text{and}} \hfill \\
cor({{\dot M}_i},{{\dot U}_i}) = {\rho _{muv,aim(i)\,}}\,{\text{and}}\, \hfill \\
{{\ddot M}_{ij}} \sim N({\mu _{mv,aim(i)}},\,\sigma _{mv,aim(i)}^2),\,{{\ddot U}_{ij}} \sim N({\mu _{mv,aim(i)}},\,\sigma _{mv,aim(i)}^2)\,{\text{and}} \hfill \\
cor({{\ddot M}_{ij}},{{\ddot U}_{ij}}) = {\rho _{muv,aim(i)\,}} \hfill \\
\end{gathered} \end{equation}
To connect studies with gaseous ammonia to ones with measured MUN, we assume that the unobserved true mean values for gaseous ammonia on the raw scale,  ${e^{{A_{ij}}}}$ for treatment
 $j = 0,1,2,\, \ldots $ in study
 $i$ is a linear function of true unobserved MUN, on the raw scale, with normally distributed errors,
 \begin{equation}{e^{{A_{ij}}}}\sim{N}\left( {{\alpha _{au}} + {\beta _{au}}{e^{{U_{ij}}}},\sigma _{au}^2} \right)\end{equation}
Finally, the observed mean values (control or treatment) for methane ( ${\text{obsme}}{{\text{t}}_{ij}}$), MUN (
 ${\text{obsMU}}{{\text{N}}_{ij}}$) and gaseous ammonia (
 ${\text{obsam}}{{\text{m}}_{ij}}$), when they exist for treatment
 $j = 0,1,2,\, \ldots $ in study
 $i$, are assumed to be normally distributed, with measures of the same response type assumed to be dependent within studies. That is to say, observed mean values are centred on their true raw scale mean values (
 ${e^{{M_{ij}}}}$,
 ${e^{{U_{ij}}}}$ and
 ${e^{{A_{ij}}}}$), with additive normal observation error. The SDs of these errors correspond to the cited SEMs given in the original papers,
 $\hat \sigma $, and the correlation between treatment and control varies depending on the experimental design. For the latter, studies are divided into those which had more sophisticated blocking structures likely to increase the correlations (Latin squares or randomised complete block designs), and those that did not. That is, for treatments
 $j = 1,2,\, \ldots $ in study
 $i$
 \begin{align}
& obsme{t_{ij}}\!\sim\!{N}\left( {{e^{{M_{ij}}}},\hat \sigma _{mij}^2} \right){\text{and}}\nonumber\\
&\qquad\times cor\left( {obsme{t_{ij}}\!-\!{e^{{M_{ij}}}},obsme{t_{i0}}\!-\!{e^{{M_{i0}}}}} \right)
= {\rho _{design\left( i \right)}}\end{align}
 \begin{align}
& obsMU{N_{ij}}\!\sim\!{N}\left( {{e^{{U_{ij}}}},\hat \sigma _{uij}^2} \right){\text{and }}\nonumber\\
&\qquad\times cor\left( {obsMU{N_{ij}}\! -\!{e^{{U_{ij}}}},obsMU{N_{i0}}\!-\!{e^{{U_{i0}}}}} \right)= {\rho _{design\left( i \right)}}\end{align}
 \begin{align}
& obs{m_{ij}}\!\sim{N}\!\left( {{e^{{A_{ij}}}},\hat \sigma _{aij}^2} \right){\text{and }}\nonumber\\
&\qquad\times cor\left( {obsam{m_{ij}}\!-\!{e^{{A_{ij}}}},obsam{m_{i0}}\!-\!{e^{{A_{i0}}}}} \right)
= {\rho _{design\left( i \right)}}\end{align}
Because log-transformed values were used for the internal components of the model, we make the implicit assumption that treatments and covariate associations multiply the amount of methane and MUN produced. This also ensured that MUN and methane production will be non-negative. Most critically, the model assumed that there is a distribution of study-average treatment effects, and a distribution of the effects of different treatments within each study, with correlations between effects on methane production and effects on MUN concentration. These distributions and correlations are all dependent on the study aim (ammonia reduction, methane reduction or other). The combined treatment effects, which also include an adjustment for DMI differences, then multiply the values for the controls in each study. The resulting levels of methane and MUN production of controls and treatments are observed with errors on the raw scale, structured as a correlated sampling error dependent on the study design and reported SEMs. For treatments where gaseous ammonia is measured, we assume a linear model connecting MUN concentration values to gaseous ammonia, with the latter being then observed with error.
The model also involves components wherein baseline control levels are influenced by the climate zone and methane measurement method of the study, for MUN and methane, respectively, implying these factors also have the same impact on the respective treatment levels. The impact of changing DMI on the differences between treatments and controls is also adjusted for by including a linear term in the log-ratio of treatment to control intakes.
The model is implemented in the NUTS-based Stan MCMC framework (Stan Development Team, 2025), via an interface in the R programming language (R Core Team, 2025). Fitting was conducted using the Crop Diversity HPC Cluster as described in Percival‐Alwyn et al. (Reference Percival‐Alwyn, Barnes, Clark, Cockram, Coffey, Jones, Kersey, Kidner, Kosiol, Li, Marsh, Zhou, Caccamo and Milne2025). Weakly informative priors were used based on an initial exploratory analysis of the data, and prior sensitivity was tested by re-running with wider priors (Gelman et al., Reference Gelman, Carlin, Stern, Dunson, Vehtari and Rubin2014). A total of 200 samples were drawn across four chains. A secondary analysis was performed replacing study aim in the above with treatment type.
Results
Data inclusion
The literature search returned 1,211 papers. All papers were critically assessed against the inclusion criteria. During an initial screening phase, papers were excluded based on their title if it clearly indicated that the study did not meet the criteria (e.g., not in English, not dairy cows, studies not relevant to dietary manipulation, duplicate papers and reviews). During the detailed screening, the main reason for exclusion was a lack of reported values for the parameters of interest.
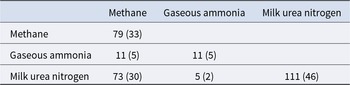
Once data selection and extraction were complete, a total of 51 papers were deemed suitable for inclusion and had useful information for the meta-analysis. Many papers contained multiple comparisons, which were considered separately, resulting in 67 controls and 117 treatments being included in the meta-analysis. A total of 79 treatments from 33 papers had data on methane emissions, 11 treatments from 5 papers had data on ammonia and 111 treatments from 46 papers had data on MUN (Table 2). In the literature search, 88 treatments from 37 papers also had VFA data, but these studies were only used for their other measured quantities due to the poor apparent association of VFA molar ratios and methane production identified during exploratory analysis. Studies that reported only VFA-based methane proxies therefore did not contribute directly to inference on methane treatment effects.
Number of treatments (and number of studies in parentheses) with data available for each pair of variables

Table 2 Long description
Counts are given as number of treatments, with number of studies in parentheses, for each variable alone and for each pair among methane, gaseous ammonia, and milk urea nitrogen. On the diagonal, methane has 79 treatments in 33 studies, gaseous ammonia has 11 treatments in 5 studies, and milk urea nitrogen has 111 treatments in 46 studies. For methane paired with gaseous ammonia, the count is 11 treatments in 5 studies. For methane paired with milk urea nitrogen, the count is 73 treatments in 30 studies. For gaseous ammonia paired with milk urea nitrogen, the count is 5 treatments in 2 studies. Cells for methane with itself, gaseous ammonia with itself, and milk urea nitrogen with itself are filled, while the upper right triangle cells are blank.
When subdividing studies by aim, 40 studies aimed to reduce methane production (91 treatments), 5 aimed to reduce ammonia production (15 treatments) and 6 were categorised as ‘other’ (16 treatments) (Table 3). Some studies classified as methane reduction studies did not include direct methane measurements and thus, due to exclusion of VFA from the analysis, contributed only indirectly to model components unrelated to methane treatment effects. Table 3 also shows the breakdown of study aim according to the different broad treatment types, demonstrating confounding as well as patchy data for some categories.
Number of treatments (with the number of studies in parentheses) subdivided by study aim (methane reduction, ammonia reduction or other), and variable assessed in the analysis, and by treatment type (additive, fibre, protein or other)

Table 3 Long description
Counts of treatments are listed with the number of studies in parentheses, grouped by Study Aim and Measured variable, and split by Treatment type: Total, Additive, Fibre, Other, and Protein. Under Study Aim, Methane Reduction, the overall row shows Total 91 with 38 studies, with Additive 45 with 19 studies, Fibre 30 with 13 studies, Other 12 with 6 studies, and Protein 0 with 0 studies. Within Methane Reduction, Measured variable, Methane has Total 64 with 28 studies, Additive 32 with 14 studies, Fibre 20 with 8 studies, Other 12 with 6 studies, and Protein 0 with 0 studies; Ammonia has Total 6 with 3 studies, Additive 3 with 2 studies, Fibre 3 with 1 study, Other 0 with 0 studies, and Protein 0 with 0 studies; MUN has Total 83 with 36 studies, Additive 42 with 17 studies, Fibre 29 with 13 studies, Other 12 with 6 studies, and Protein 0 with 0 studies. Under Study Aim, Ammonia Reduction, the overall row shows Total 15 with 5 studies, with Additive 0 with 0 studies, Fibre 0 with 0 studies, Other 0 with 0 studies, and Protein 15 with 5 studies. Within Ammonia Reduction, Methane has Total 15 with 5 studies and Protein 15 with 5 studies, Ammonia has Total 5 with 2 studies and Protein 5 with 2 studies, and MUN has Total 12 with 4 studies and Protein 12 with 4 studies, with all other treatment types at 0 with 0 studies. Under Study Aim, Other, the overall row shows Total 16 with 6 studies, with Additive 3 with 2 studies, Fibre 3 with 1 study, Other 10 with 3 studies, and Protein 0 with 0 studies. Within Other, Methane and Ammonia are all 0 with 0 studies across every treatment type, while MUN has Total 16 with 6 studies, Additive 3 with 2 studies, Fibre 3 with 1 study, Other 10 with 3 studies, and Protein 0 with 0 studies.
Funnel plots (Figure 3) of the apparent log-ratios of treatment to control for methane production and MUN concentration show that, compared to a situation where all studies are reporting on the same treatment, there is significant excess variation in the observed log-ratios for both measures, which can be expected due to heterogeneity amongst the treatments used. The relative scarcity of treatments reporting both high MUN concentrations and large SEs may suggest possible publication bias; however, this pattern may also reflect differences in intervention objectives or study design, and no formal assessment of publication bias was undertaken.
Funnel plot for treatments included in the work, for methane yield (g/kg DMI) on the left and milk urea nitrogen (MUN, mg/dl) on the right. Plots show each treatment’s observed log-ratio when compared to the control and this ratio’s estimated associated standard error, with the shading presenting a 95% confidence interval collating all data points as if they are repeated observations of the same treatment.

Model results
Results from the Bayesian model for treatments under different study aims are shown in Table 4, with a summary of the posterior distribution of treatment effects shown in Figure 4. As can be expected, in terms of posterior mean effect, treatments in studies aiming to reduce ammonia emissions reduced MUN concentration (a proxy for ammonia) more on average than those studies aiming to reduce methane emissions did, while the converse was true for methane reductions in treatments from studies aiming to reduce methane emissions. Further, while there was greater overall variability in the effects of treatments on MUN concentration than on methane production, each type of study showed a greater spread of treatment efficacy in the variable they were interested in. On the log scale, methane reduction studies showed four times the variability in methane production effects (SD = 0.134, 90% credible interval [CI; 0.107, 0.169]) than ammonia reduction studies (SD = 0.031, 90% CI [0.005, 0.071]), and ammonia reduction studies saw 50% more variability in MUN concentration effects (SD = 0.275, 90% CI [0.173, 0.435]) than in methane studies (SD = 0.187, 90% CI [0.147, 0.235]). Posterior averages for both types of studies showed reductions in methane production rate (−5.1% and −2.2% for studies aiming to reduce methane and ammonia, respectively) and MUN concentration (−4.8% and −25% for studies aiming to reduce methane and ammonia, respectively). However, for ammonia reduction studies, the 90% CI for the mean effect on methane is [−6.0%, +1.7%], thus including the possibility of a small increase.
Summary of the fitted posterior distributions of treatment effects according to study aim. The contour lines give two-dimensional credible intervals for the effect of a treatment on milk urea nitrogen (MUN) concentration (as a measure of ammonia production) and on methane production.

Bayesian posterior means for the different study aims with 90% credible intervals given in parentheses

Table 4 Long description
Bayesian posterior means and 90% credible intervals are listed for three columns: Methane reduction studies, Ammonia reduction studies, and Other study aim. For mean log effect on methane, values are minus 0.053 with interval minus 0.093 to minus 0.011 for Methane reduction studies, and minus 0.022 with interval minus 0.062 to 0.017 for Ammonia reduction studies. For mean log effect on ammonia, MUN, values are minus 0.050 with interval minus 0.101 to 0.000 for Methane reduction studies, minus 0.293 with interval minus 0.453 to minus 0.130 for Ammonia reduction studies, and minus 0.052 with interval minus 0.106 to 0.001 for Other study aim. Correlation between methane and ammonia effects is 0.096 with interval minus 0.173 to 0.357 for Methane reduction studies, and 0.000 with interval minus 0.623 to 0.623 for Ammonia reduction studies. Standard deviation of methane effects is 0.134 with interval 0.107 to 0.169 for Methane reduction studies, and 0.031 with interval 0.005 to 0.071 for Ammonia reduction studies; standard deviation of ammonia, MUN, effects is 0.187 with interval 0.147 to 0.235, 0.275 with interval 0.173 to 0.435, and 0.070 with interval 0.034 to 0.132 for the three columns in order. Probability of methane reduction is 0.653 with interval 0.532 to 0.764 for Methane reduction studies, and 0.737 with interval 0.235 to 1.000 for Ammonia reduction studies; probability of ammonia, MUN, reduction is 0.605 with interval 0.499 to 0.706, 0.853 with interval 0.654 to 0.973, and 0.773 with interval 0.496 to 0.969. Probability of methane and ammonia, MUN, reduction is 0.409 with interval 0.304 to 0.518 for Methane reduction studies, and 0.631 with interval 0.182 to 0.927 for Ammonia reduction studies. Percent effects are also given: mean effect on methane is minus 5.1% with interval minus 8.9 to minus 1.1 for Methane reduction studies, and minus 2.2% with interval minus 6.0 to 1.7 for Ammonia reduction studies; the 90% percentile effect on methane is plus 12.8% with interval 6.9 to 20.1, and plus 1.8% with interval minus 2.8 to 8.1. Mean effect on ammonia, MUN, is minus 4.8% with interval minus 9.6 to 0.0 for Methane reduction studies, minus 25.0% with interval minus 36.4 to minus 12.2 for Ammonia reduction studies, and minus 5.0% with interval minus 10.1 to 0.1 for Other study aim; the 90% percentile effect on ammonia, MUN, is plus 21.0% with interval 13.1 to 30.9, plus 8.1% with interval minus 12.2 to 39.5, and plus 4.1% with interval minus 2.5 to 14.6.
Milk urea nitrogen (MUN) is considered a proxy for ammonia emissions.
The posterior distribution for the correlation between treatment effects on MUN concentration and on methane production shows intervals which include zero, indicating that the available data do not reliably identify the direction of the relationship between the two outcomes. This means the data available cannot reliably distinguish whether, for example, a treatment that is very effective in reducing methane production is more likely to reduce MUN concentration. Intervals are wide for ammonia reduction studies, showing high uncertainty, perhaps due to the lower number of studies, though for methane reduction studies the 90% CI on the correlation between the two is [−0.173, 0.357]. The lower bound of −0.173 indicates that if any trade-off exists, it is likely very minor, while the upper bound of 0.357 means any degree of co-benefit should be somewhat mild as well. For methane reduction studies, there is a posterior probability of 0.758 of the correlation being positive, indicating that methane reduction efficacy is most likely weakly positively related to ammonia reduction.
Treatments from studies aiming to reduce methane had a posterior probability of 0.653 (90% CI [0.532, 0.764]) of reducing methane production, and a probability of 0.605 (90% CI [0.499, 0.706]) of reducing MUN concentration. The posterior probability of reducing both outcomes simultaneously was 0.409 (90% CI [0.304, 0.518]). Treatments from studies with the aim of reducing ammonia were very likely to reduce MUN concentrations (posterior probability of 0.853, 90% CI [0.654, 0.973]). The fitted posterior mean indicated a high probability (0.631) that treatments from such studies would reduce both methane production and MUN concentration; however, the credible interval was wide (90% CI [0.182, 0.927]) owing to high degrees of uncertainty. Thus, it should be expected that some treatments that demonstrate ammonia reduction will result in increased methane production. This suggests caution in the interpretation of results for this type of study.
The model suggested, albeit weakly, that studies with more sophisticated blocking structures (Latin square or randomised complete block designs) showed a stronger correlation between the observation errors amongst the controls and the observation errors amongst the treatments, with a posterior probability of 0.75 that this is the case. This implies that these designs, as expected, allow better estimation of the difference between control and treatment for any given level of reported SEM. The uncertainties were wide, so it is not possible to estimate the corresponding correlations accurately.
Owing to the smaller subgroups involved, the supplementary analysis of treatment types was only able to obtain somewhat reliable estimates for the additive subtype, which gave a probability of reducing both MUN concentration and methane production of 0.47 (90% CI [0.32, 0.61]). Full results are given in Supplementary Material 2. The model’s estimates of the treatment effects, as given in Figure 5, provide a visualisation of treatment differences that suggests that different types of treatment have different effects on methane and MUN concentration.
Estimated distribution of treatment effects from a model using treatment types. Each box represents a treatment, with the box and whiskers giving 50% and 90% credible intervals for that treatment’s multiplicative effect on methane production in the upper chart and milk urea nitrogen (MUN) concentration in the lower chart. In each chart, treatments are sorted into categories by treatment type, and then by their estimated effectiveness within those categories.

Figure 5 Long description
Two stacked box and whisker plots comparing treatment effects by treatment type. Upper plot. The y-axis label is, Methane Effect. Units are not shown. The y-axis tick labels run from 0.4 to 1.4 in increments of 0.2. A horizontal reference line is drawn at 1.0. The x-axis represents treatment type categories labeled, Additive, Fibre, Other, Protein. Within each category, multiple box and whisker marks are shown, each with a central marker and whiskers. In Additive, values span from below 1.0 to above 1.0, with the lowest marks near 0.6 and the highest marks near 1.2. In Fibre, values are mostly above 1.0, rising to near 1.3. In Other, values cluster around 1.0 to about 1.1. In Protein, values cluster around about 1.0 to about 1.1. Lower plot. The y-axis label is, MUN Effect. Units are not shown. The y-axis tick labels run from 0.4 to 1.4 in increments of 0.2. A horizontal reference line is drawn at 1.0. The x-axis represents treatment type categories labeled, Additive, Fibre, Other, Protein. Within each category, multiple box and whisker marks are shown, each with a central marker and whiskers. In Additive, values span from below 1.0 to above 1.0, with several marks near 1.2. In Fibre, values rise from below 1.0 to around 1.1. In Other, values span from well below 1.0 up to above 1.0, with the lowest marks near 0.4 and the highest marks near 1.2. In Protein, values rise from below 1.0 to above 1.0, with the highest marks near 1.3.
Discussion
Few studies report direct measurements of both methane and ammonia emissions from cattle. Where reported for nutritional interventions, outcomes vary: some show reductions in one gas with no change in the other (Aguerre et al., Reference Aguerre, Wattiaux, Powell, Broderick and Arndt2011; Chiavegato et al., Reference Chiavegato, Powers and Palumbo2015; Carrazco et al., Reference Carrazco, Peterson, Zhao, Pan, McGlone, DePeters and Mitloehner2020; Müller et al., Reference Müller, Görs, Derno, Tuchscherer, Wimmers, Zeyner and Kuhla2021), one reports reductions in both (Duval et al., Reference Duval, Aguerre, Wattiaux, Vadas and Powell2016), some find no reduction in either (Li and Powers, Reference Li and Powers2012; Arndt et al., Reference Arndt, Powell, Aguerre and Wattiaux2015; Zheng et al., Reference Zheng, Ma, Liu, Wei and Yang2019) and one found a reduction in methane production and a concurrent increase in ammonia production (Joch et al., Reference Joch, Vadroňová, Češpiva, Zabloudilová, Výborná, Tyrolová, Kudrna, Tichá, Plachý and Hroncová2023).
The present study aimed to obtain a clearer picture of the distribution of effects of currently studied measures intended to reduce either of these two important gaseous emissions on the other, using a Bayesian synthesis of available data. Using MUN as a proxy for ammonia helped to expand the dataset considered. Despite conflicting results in individual studies, the posterior mean estimates suggest that interventions targeting either gas demonstrate a broad potential to generate co-benefits, with a typical treatment amongst those studied predicted to reduce both methane and ammonia (measured via MUN).
Trade-offs and co-benefits between GHG and ammonia emissions from cattle after reductions in dietary crude protein have previously been considered through a literature review (Eory et al., Reference Eory, Topp, De Haan, Moran, Reis, Howard and Sutton2015), with an emphasis on nitrous oxide and methane emissions from manure storage and highlighting contradictory results. Similarly, Hou et al. (Reference Hou, Velthof and Oenema2015) found through meta-analysis that both ammonia and GHG emissions along the manure management chain could be reduced with dietary crude protein reduction, though they assumed no change in methane or nitrous oxide from housing due to limited data.
Mechanistic links between diet, rumen fermentation and gas emissions
Both enteric methane and ammonia emissions are biologically linked through rumen fermentation processes. When rumen degradable protein (RDP) exceeds microbial requirements, excess amino acids are deaminated, providing carbon skeletons that are fermented to VFAs, generating hydrogen (Apajalahti et al., Reference Apajalahti, Vienola, Raatikainen, Holder and Moran2019). This additional hydrogen may enhance methanogenesis. However, the response of hydrogen and methane production depends on the carbohydrate replacing excess RDP. As a generalisation, high-starch substitutions of forage reduce ruminal pH increase propionate at the expense of acetate and can elevate total VFA production (Wang et al., Reference Wang, Zhang, Li and Zhang2020), whereas replacing forage with alternative fibre sources tends to increase the rate and extent of VFA production without fundamentally shifting fermentation towards a propionate-dominated profile (Pereira and Armentano, Reference Pereira and Armentano2000).
Methane-suppressing feed supplements may influence ammonia production, depending on their mode of action. For example, they can influence hydrogen utilisation in the rumen, promoting propionate formation at the expense of acetate. Such alterations in VFA profiles may contribute to a modest decline in rumen pH, depending on the extent of VFA accumulation and buffering capacity (Reynolds et al., Reference Reynolds, Humphries, Kirton, Kindermann, Duval and Steinberg2014). The reduction in pH could suppress the activity of ammonia-producing bacteria, depending on the baseline diet (Bach et al., Reference Bach, Calsamiglia and Stern2005; Shen et al., Reference Shen, Zheng, Xu and Yu2023). Conversely, reduced methane production in the rumen can redirect hydrogen towards alternative electron sinks such as propionate synthesis, which conserves more energy compared to methanogenesis. This shift may enhance the efficiency of microbial growth and protein synthesis, if rumen fermentation remains balanced and hydrogen accumulation is avoided. This could lead to improved nitrogen retention, although many studies report no change or decreases in microbial biomass after methane inhibition (Ungerfeld, Reference Ungerfeld2015).
However, increases in ammonia after dietary manipulation to reduce methane are a possibility, although, again, likely dependent on the mode of action. In the case of high starch diets, this could be a result of pH fluctuations destabilising microbial nitrogen capture (Calsamiglia et al., Reference Calsamiglia, Cardozo, Ferret and Bach2008). Blocking methanogenesis can lead to accumulation of hydrogen in the rumen (Tanaka et al., Reference Tanaka, Collins, Polkoff and Fellner2024; Ni et al., Reference Ni, Wang, Walker, Muetzel, Schmidt, Fischer, Stemmler, Leung, Zhang, Li, Jain, Jespersen, Grinter, Archer, Pacheco, Lowe, Pope, Müller, Pitta, Janssen, Watson, Attwood, Ver Loren van Themaat, Kindermann and Greening2025). This accumulation can modify redox balance and indirectly influence nitrogen turnover. For instance, Tanaka et al. (Reference Tanaka, Collins, Polkoff and Fellner2024) observed that potent inhibitors of methanogenesis (e.g., bromochloromethane) substantially increased dissolved hydrogen and were accompanied by higher ammonia concentrations. Similarly, Goel et al. (Reference Goel, Makkar and Becker2009) reported increased isovalerate production when methanogenesis was suppressed, which may indicate enhanced amino acid degradation. However, other studies have reported no change or even reduced deamination under certain inhibitory conditions, implying that the relationship between hydrogen accumulation and microbial nitrogen metabolism is not straightforward and may depend on substrate type, microbial community composition and inhibitor mechanism (Ungerfeld et al., Reference Ungerfeld, Aedo, Martínez and Saldivia2019). While inhibition of methanogenesis often leads to hydrogen build-up, its effect on deamination and microbial nitrogen capture appears to be variable and warrants further mechanistic investigation. This variability highlights the importance of considering diet composition, microbial community and inhibitor mechanism when predicting co-effects on methane and ammonia.
Only one study in which enteric methane and ammonia production have been directly measured has reported simultaneous reductions in both gases. Duval et al. (Reference Duval, Aguerre, Wattiaux, Vadas and Powell2016) found that dairy cows fed a low concentration of tannin supplement (<2% DMI) had lower methane, ammonia and nitrous oxide emissions but that the effect was transient. They found that emissions increased at 45 days, but were lower after 90 days, with no negative impact on milk production. However, our work suggests a much broader set of treatments may show some degree of benefit in both gases, in general representing studies where MUN was measured instead of ammonia.
The consequences for animal performance should also be considered when interpreting mitigation outcomes. Although the present analysis adjusted treatment effects for differences in DMI, thereby reducing the likelihood that observed methane reductions simply reflected lower feed intake, DMI alone is not a measure of production efficiency. Nutritional interventions can alter nitrogen partitioning, milk yield (Olmos Colmenero and Broderick, Reference Olmos Colmenero and Broderick2006), digestibility (Wang et al., Reference Wang, Mao, Yang, Wu, Wang, Li, Shen and Liu2014) and feed conversion efficiency, all of which influence emissions intensity at the animal level. Consequently, reductions in absolute methane emissions do not necessarily translate into lower emissions per unit of milk produced, nor do they indicate whether mitigation can be sustained without compromising productivity. Conversely, interventions that maintain or improve animal performance while reducing methane and ammonia emissions offer the greatest potential for durable environmental benefit.
Insights from the Bayesian meta-analysis
The Bayesian analysis adds new insights by quantifying the probability of simultaneous reductions of methane and ammonia, the latter through the proxy of MUN. As might be expected, studies focusing on a particular pollutant reduction explored treatments that demonstrated a greater variety of effectiveness on their target. Ammonia reduction studies showed a narrower range of methane effects than methane mitigation studies, reflecting the greater variability observed between and within methane-focused interventions (Almeida et al., Reference Almeida, Hegarty and Cowie2021; Martins et al., Reference Martins, Cueva, Lage, Ramin, Silvestre, Tricarico and Hristov2024), but methane studies frequently could reduce MUN, suggesting reductions in ammonia production. Results for ammonia/MUN reduction studies were more uncertain but pointed to likely small reductions in methane production.
Although the correlation between methane and ammonia responses across treatments could not be reliably estimated, the posterior distribution, where generated, suggested a weak relationship, likely to be positive. This implies that large cross-effects are unlikely, but uncertainty remains, particularly for ammonia-focused studies. These results support the view that integrated mitigation strategies targeting dietary or feed supplement-based interventions can yield benefits for both emissions simultaneously and suggest that different types of study or mitigation may have differing effectiveness in this respect. More studies measuring both gases simultaneously would strengthen conclusions, allow stratification by methane mitigation mechanism and reduce reliance on proxy outcomes such as MUN concentration.
An additional finding was the role of study design. The work gives weak evidence that studies employing more sophisticated blocking structures (e.g., Latin square or randomised complete block designs) exhibited stronger correlation in observation errors between controls and treatments, improving the precision of estimated treatment effects for a given reported SEM. This suggests that careful experimental design not only strengthens inference in individual studies but also improves the comparability and reliability of evidence in meta-analyses.
Limitations
It is possible that the interventions included in this analysis are not fully representative of their categories, or that the patterns seen have some other cause. For example, ‘Protein’ treatments are associated with a large spread of effects on MUN concentration, but a small spread of effects on methane production, largely because these studies correspond exactly to ammonia reduction aims. Consequently, observed patterns may reflect study-level characteristics rather than intrinsic properties of the intervention type. Our literature survey was aimed at prioritising inclusion of papers that give information on both gases, though some studies where only an ammonia measurement was made were ultimately included due to the removal of VFA from the model. It may be the case that the papers we included represent a different population of studies from those where, for example, no ammonia-related measurement was made at all.
The meta-analysis reported here does not account for emissions from manure storage or housing, nor does it consider implications for nitrous oxide emissions, which could influence net environmental outcomes.
Although VFA molar ratios are often cited as mechanistic indicators of methanogenesis (Moss et al., Reference Moss, Jouany and Newbold2000; Williams et al., Reference Williams, Murray, Jacobs, Wales and Moate2019; Park et al., Reference Park, Cho, Jeon and Choi2024), we found no consistent association between VFA ratios and measured methane production across studies reporting both outcomes. This likely reflects substantial heterogeneity in diet composition, intake level, sampling protocols and experimental design, as well as the fact that VFA ratios represent instantaneous fermentation end-products rather than integrated gas production. Given this lack of empirical support and the risk of introducing substantial measurement error and attenuation bias, VFA ratios were ultimately not used to inform methane treatment effects in the meta-analysis.
Meanwhile, using MUN as a proxy for ammonia was necessary to our analysis given the much smaller number of studies that report on gaseous ammonia, but we had only two studies where both MUN and gaseous ammonia were reported, and therefore cannot reliably verify that the association really holds in our context. Hence, our reported results should be considered as primarily dealing with MUN, with ammonia effects only by implication.
Conclusions
This Bayesian synthesis was explicitly designed to quantify cross-effects between enteric methane and ammonia production in dairy cattle following nutritional interventions. Our methodology collated studies most capable of informing joint responses, accounted for between-study heterogeneity and uncertainty and assumed that MUN can be used to proxy for ammonia emission. Our results show that in the current research landscape, interventions targeting either gas are more likely to deliver co-benefits than substantial trade-offs, although uncertainty remains, particularly for strategies primarily intended to reduce ammonia. Integrated mitigation strategies appear feasible without the expectation of unavoidable environmental burden shifting. The analysis also highlights gaps in the evidence base, including the scarcity of studies measuring multiple gaseous emissions simultaneously and the limited utility of commonly used proxies such as VFA ratios for cross-study inference. Addressing these gaps will be essential to refine estimates, resolve remaining uncertainties, identify the types of treatment that appear most promising and support the development of mitigation policies that coherently address both climate and air-quality objectives in livestock systems.
Supplementary material
The supplementary material for this article can be found at https://doi.org/10.1017/S0022029926102696.
Author contributions
ZF: methodology, formal analysis, visualisation, writing original draft; SB: methodology, reviewing and editiing; JN: Conceptualisation, funding acquisition, reviewing and editing; GM: Conceptualisation, data curation, funding acquisition, writing original draft.
Declaration of interest
The authors declare no competing interests.
Ethics and approvals
This study was purely literature based, and so no animal or social ethics approvals were required.
Funding statement
This study was funded by the Scottish Government through its Strategic Research Programme of the Rural and Environment Science and Analytical Services Division (RESAS 22–27: SRUC D1-1).





 Open access

