

Introduction
The developmental origins hypothesis suggests that an unknown fraction of human morbidity and premature mortality arises from stressful perinatal and infant exposures. Such exposures presumably induce adaptive responses that promote survival in the short term, but lead to harmful consequences later in life.Reference Gluckman, Hanson and Beedle1 The human evidence most frequently cited in support of this speculation comes from cohorts that experienced famine during perinatal and infant development. Two recent studies, for example, compare a small sample of individuals in gestation during the Dutch famine (1944–1945) to their same-sex siblings born before or after the famine and who presumably had adequate nutrition. Both studies found differential DNA methylation of loci involved in growth and metabolic function.Reference Heijmans, Tobi and Stein2, Reference Tobi, Lumey and Talens3 Although the Dutch data suggest a possible connection between famine and later-life morbidity via epigenesis, the research makes an underlying assumption common in the developmental programming literature: that morbidity in later life, due to cardiovascular disease and other chronic conditions, increases the risk of premature death. The link between early-life nutritional deficiencies and mortality (whether caused by epigenetic changes or any other mechanism) in old age has not, however, been much studied in human populations. The little work that does address prenatal programming of excess later-life mortality, moreover, also comes from cohorts exposed to the Dutch famine and reports no significant relationship.Reference Roseboom, van der Meulen and Osmond4, Reference Painter, Roseboom and Bossuyt5
Data and methodological limitations, however, may have biased the Dutch Famine tests toward the null. The studies used comparison groups born in 1943–1944 and 1946–1947, which were years of invasion and occupation, as well as of post-war economic and civil disorganization. The comparison cohorts, therefore, suffered exposure to stressors that could induce outcomes like those following from nutritional deficits. As the authors of these studies have acknowledged, moreover, the small size of the study populations raise the possibility of a type II error due to lack of statistical power. Issues of external validity also arise from the fact that the existing studies all use births at two midwifery training schools and a university hospital, even though more than 70% of deliveries during this period occurred at home.Reference Lumey, Stein and Kahn6 The null findings in this sample may not, therefore, generalize to more representative populations.
Others have attributed the null findings in the Dutch data to the possibility that effects of famine on mortality have yet to be seen in the exposed population. Published studies of mortality in the Dutch famine cohort report findings through age 59 – well below period life expectancy for the cohort and its nearest neighbors in time (67 for those born in 1946, for example). It is therefore possible that mortality effects of the Dutch famine will be observed in that cohort's future; however, those data are currently lacking. We therefore contribute to the literature by using an earlier virulent famine to test the hypothesis that perinatal and infant exposure to maternal nutritional deprivation predicts excess mortality after age 59. More specifically, we examine the effects of early-life exposure to the Great Finnish Famine of 1866–1868 on cohort mortality from age 60 through 89.
The Finnish famine resulted from three successive crop failures beginning in 1866 and ending in 1868. The most severe crop failures occurred in the country's northern and central regions and thus mortality was highest in these regions. However, in the fall of 1867, farmers in most parts of Finland harvested little or nothing and mortality was elevated throughout the country.Reference Pitkänen and Mielke7 As a consequence of the famine, 8% of the total population of the country died, and infant mortality rose 40%, in 1868.Reference Kannisto, Christensen and Vaupel8 Annual age-standardized death rates (per 1000 population) rose to 91.1 for men and 75.2 for women – a dramatic increase from the 1861–1865 rates of 27.6 and 24.6 for men and women, respectively. Mortality rates returned to their pre-famine levels starting in 1869 following a good crop yield in autumn 1868. In 1869, the estimated age-standardized death rates (per 1000 population) for men and women were 28.0 and 25.4, respectively.Reference Pitkänen9 Of the 102,921 Finns born in 1867 and 1868, our analyses focus on the 35% (i.e. 36,333) who survived to age 60.
The Finnish famine caused a relatively brief and well-defined period of extreme nutritional deprivation. Later-life mortality among infants born in 1867 and 1868 can, therefore, be compared with cohorts born earlier to test the development origins hypothesis. Given that the Finnish famine cohorts have no survivors, we can answer the question raised by the Dutch Cohort findings – does perinatal and infant nutritional stress predict mortality after age 59? Unlike the Dutch famine, moreover, the Finnish famine affected the entire country, allowing us to use life table data to describe the universe of nutritionally deprived infants, not just a sample.
Despite their advantages over the Dutch famine data, only two studies have used the Finnish data to study adult mortality among cohorts exposed in early development to famine – and these report conflicting results. Kannisto et al.Reference Kannisto, Christensen and Vaupel8 reports little or no association, whereas Doblhammer et al.10 exhibited lower adult life expectancy.
Our study can ‘break the tie’ between the Kannisto et al. and Doblhammer et al. studies by offering a third analysis of the Finnish cohort data. Unlike the earlier studies, which used demographic methods, we use the Wiener–Granger approach previously used by neuroscientists to answer questions related to epigenesis and early-life development.Reference Bressler and Seth11 We, moreover, contribute to the literature by focusing exclusively on mortality beyond age 59, whereas the earlier Finnish studies studied mortality among cohorts of adults at varying ages.
Methods
Data
We extracted Finnish birth cohort death rates from the Human Mortality Database (HMD).12 Inclusion in this database requires that life table data meet standards agreed among demographers for completeness and reliability. The quality of Finnish vital statistics improved sufficiently by 1878 that the HMD includes death rates among Finns aged 60 and older for cohorts born as early as 1818. The methods we employ, described below, work well with ∼50 pre-stressor time points, making the 1818 birth cohort an appropriate starting group for our test.
Analyses
Our test asks whether men or women born in 1867 or 1868 in Finland exhibited higher than expected death rates at age 60–64 and at five subsequent 5-year age periods (i.e. through age 85–89). We derive expected rates from death rates for cohorts at the same age but born from 1818 through 1866. Our analyses stop with the 85–89 age group because small populations at risk beyond 89 make the high death rates among very old Finns appear unstable.
Tests like ours typically assume that the expected value for the two exposed cohorts for any age by sex group would be the mean of the 49 cohorts that preceded them. Data collected over time, however, often exhibit trends, cycles and or the tendency to remain elevated or depressed, or to oscillate, after high or low values. The mean of a series exhibiting such patterns, collectively referred to as ‘autocorrelation,’ is not the expected value for any case. The expected value would be, rather, that forecasted from autocorrelation. Researchers dating at least to Fisher (1921)Reference Fisher13 have solved this problem by decomposing time series into values expected from autocorrelation and residuals (i.e. the difference between expected and observed). The test, therefore, reduces to the question of whether the observed values fall outside the 95% confidence interval of the expected. Wiener (1956)Reference Wiener14 and Granger (1969)Reference Granger15 developed the logic of this test more fully and neuroscientists have adopted it to shed light on mechanisms that could connect, for example, early-life trauma to later-life functioning.Reference Bressler and Seth11
We implemented Wiener–Granger logic through the following steps devised by Box et al.Reference Box, Jenkins and Reinsel16 First, we used the method of Box and Jenkins to identify and estimate models of autocorrelation in death rates in each of the 12 sex-by-age groups for the years 1818 through 1866. The method, Auto Regressive, Integrated, Moving Average (i.e. ARIMA) modeling, identifies which of a very large family of mathematical expressions best describes measurements made over time. The method assumes that the measurements passed through an unobserved filter, or model, that imposed autocorrelation upon them. The approach looks for patterns in the data that narrow the likely model to a few and then applies estimates of ‘fit’ to identify the most likely candidate.Reference Ljung and Box17 The best fitting model forecasts values that approximate what would occur if the circumstances that produced earlier observed values remain unchanged.
The general Box–Jenkins model is as follows:
 $${{\nabla }_d}{{Z}_t}\: = \:C\:{\rm{ + }}\:\frac{{(1\,{\rm{ - }}\,{{\theta }_{\rm{1}}}B\,{\rm{ - }}\,{{\theta }_{\rm{2}}}{{B}^{\rm{2}}} {\rm{ - }} \cdots {\rm{ - }}{{\theta }_q}{{B}^q} )}}{{(1\,{\rm{ - }}\,{{\phi }_{\rm{1}}}B\,{\rm{ - }}\,{{\phi }_{\rm{2}}}{{B}^{\rm{2}}} {\rm{ - }} \cdots {\rm{ - }}{{\phi }_p}{{B}^p} )}}{{a}_t}\eqno\rm$$
Zt is the sex-by-age death rate at year t. ∇d is the difference operator indicating that Z has been differenced (i.e. Zt subtracted from Zt −d) to render the series stationary in its mean (i.e. to remove secular trends and cycles). C is a constant. at is the residual, or unexpected, component of Z at year t. θ and φ are the ‘moving average’ and ‘autoregressive’ coefficients that express the tendency of the Z series to remain elevated or depressed, or to oscillate, after high or low values. B n is the ‘backshift’ operator that indicates the distance in time between a high or value in Z and its ‘echo’ such that n = 1 suggests the echo is immediate, whereas the delay is, for example, 4 years when n = 4.
Second, we used the Box and Jenkins methods to forecast the expected values for the years 1867 and 1868 and to estimate the standard errors of the forecasts. We also used the routines devised by Chang et al.Reference Chang, Tiao and Chen18 to adjust the standard errors of the forecasts for any outliers in the 1818 to 1866 series.
Third, we compared the observed values for the 1867 and 1868 cohorts to the confidence interval of the expected values for those years. If perinatal exposure to the famine made cohorts born in 1867 and 1868 frailer at old age than cohorts born earlier, we would find observed death rates for these two cohorts above the confidence intervals of their expected values.
Results
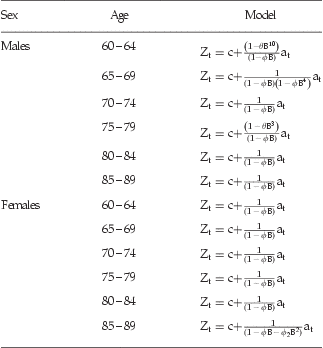
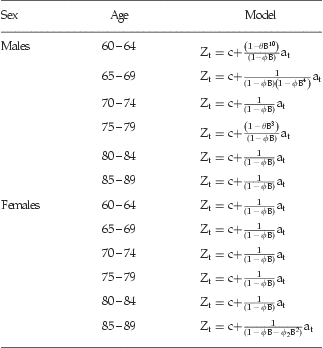
Step 1 in our test, identifying autocorrelation in cohort death rates among each of the 12 age-by-sex groups, yielded the Box–Jenkins models shown for men and women in Table 1. None of the series showed consistent secular trend (i.e. differencing not indicated) but all exhibited autocorrelation in which high or low values persisted, albeit shrinking geometrically, into subsequent years. Several series also exhibited ‘echoes’ in which high or low values repeated later, although much reduced. Any explanation of this autocorrelation would amount to post hoc speculation.
Best fitting Box–Jenkins models for each sex-by-age cohort death rate
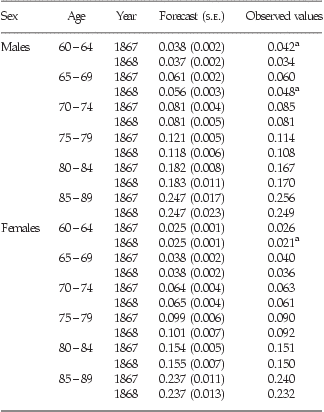
Steps 2 and 3 yielded the results shown in Table 2. We estimated 24 coefficients and would expect one to fall outside the 95% confidence interval by chance. We found three outside the interval. Men born in 1867 exhibited a higher death rate at age 60–64 than expected from unexposed cohorts, whereas women born in 1868 had lower than expected rates at age 60–64. Men born in 1868, moreover, had lower than expected death rates at age 65–69. We know of no variation on the developmental origins argument that would predict these findings. We, therefore, infer no support for an effect of prenatal famine exposure on mortality at ages 60 through 89.
Expected (standard errors in parentheses) and observed death rates for 1867 and 1868 for 12 age-by-sex groups from Finland

aObserved value outside 95% CI, two-tailed test.
Alternative approaches to our test produced the same results as the original test. We, for example, converted the death rates into their natural logarithms and tested again to determine if variability in variation over time could have distorted our tests. The results did not change.
We also converted the tests for which we found observed values outside the confidence intervals of those expected into the interrupted time series, ‘transfer function’ format.Reference McCleary and Hay19 More specifically, we built Box–Jenkins models for the three series for the years 1818 through 1870 and added a famine variable scored 1 for 1867 and 0 otherwise to the models. We estimated the association between the famine variable and the death rates in 1867 and 1868, controlling for autocorrelation in the rates. We estimated these models for the raw rates and their natural logarithms. We then estimated the models again applying outlier detection routines.Reference Chang, Tiao and Chen18 Results for four variants of the test (i.e. with and without log transform and with and without outlier detection) remained as in the primary test.
Discussion
We find no evidence that the profound nutritional stress on Finns in 1867 and 1868 increased old-age mortality among cohorts born in those years. Our results suggest that any programming effects induced by nutritional stressors and famine-related adversity, whether biological or social in nature, do not affect mortality later in life among survivors of famine. Given that other studies have shown no effect of the Dutch famine on mortality before age 59, our results suggest that perhaps famine-related adversity has no significant effect on mortality beyond infancy.
Our tests use methods different from those applied earlier to Finnish data. By using time series methods for our forecasts, we took into account autocorrelation in mortality rates over time, which may have biased the expected values calculated in earlier tests. Although we believe our use of Wiener–Granger logic improved on earlier tests, assuming equivalent rigor would still leave the literature focused on the Finnish famine with two of three tests finding no association between earlier life exposure and later-life mortality.
Unlike the Dutch famine studies, our findings cannot stem from faulty comparison groups or from small or biased samples. We derived our counterfactual from trends and other autocorrelation in age-specific death rates among all known Finnish citizens born from 1818 through 1866. A type II error due to geographic variation in the intensity of the famine is, moreover, unlikely. Aggregation could induce a type II error only if an increase in age-specific death rates in the population most affected by famine was balanced by an unexpected decrease for the same age group in the population least affected by famine. We know of no theory that would predict such symmetry.
Our results add to the literature suggesting prenatal famine does not induce, via epigenesis or any other mechanism, premature mortality in exposed individuals who survived to age 59. Our results agree not only with the earlier work studying mortality in Dutch famine cohortsReference Roseboom, van der Meulen and Osmond4, Reference Painter, Roseboom and Bossuyt5 but also with other studies of the association between exposure in utero to famine and later-life mortality. These studies include analyses of the Chinese Great Leap Forward famine from 1959 to 1961Reference Song20 and season famines in Bangladesh from 1974 to 2000.Reference Moore, Fulford, Streatfield, Persson and Prentice21 Analysis of the famines in China and Bangladesh showed no increase in adult mortality.Reference Lumey, Stein and Susser22 In contrast, studies in the Gambia have shown that people born during the wet season, when there is a shortage of food, have mortality rates that are 10 times greater than individuals born during the harvest season.Reference Moore, Fulford, Streatfield, Persson and Prentice21 However, this result could not be replicated in other studies, and excess mortality was suggested to be due to either a cohort effect or infectious diseases.Reference Painter, Roseboom and Bossuyt5, Reference Moore, Cole and Collinson23
Our results concerned with persons over age 60, as well as findings from other studies reporting no effect of famine exposure during gestation on adult mortality under age 60, seem intuitively at odds with risk factor research reporting associations between indicators of poor early-life nutrition and premature adult death. The literature includes, for example, reports that low birth weight predicts premature mortality.Reference Risnes, Vatten and Baker24 Although low birth weight has causes other than poor nutritional environment, the inconsistency between the two literatures emphasizes the need to more fully understand the complicated effects of the nutritional environment on the developmental programming of adult health.
The literature arguing for developmental origins of health and disease often suggests that a nutritionally deprived prenatal environment followed by an obesogenic postnatal environment increases the risk of adult morbidity.Reference Gluckman, Hanson and Beedle25 It remains possible, therefore, that our finding of no effect arises from the fact that food availability in Finland after the famine returned to ‘normal’ rather than to an obesogenic level.
We conclude that the research to date finds no premature adult mortality among gestational and infant cohorts exposed to famine. This conclusion suggests that ambient stressors may induce adaptations that compensate for morbidity among individuals surviving into adulthood. Exposures in utero to the maternal stress response or to inadequate nutrition during early life may trigger trade-offs in development that increase morbidity, but do not induce life-threatening changes.
Acknowledgment
This research was supported by the Robert Wood Johnson Health and Society Program.