

 $$\raster="fx1"$$
In the 1950s, after extensive animal studies, Dr C. Walton Lillehei and his associates at the University of Minnesota began a series of
 $$\raster="fx2"$$
operations using cross-circulation, in which the patient was connected to a human “donor”, usually a parent, who served as a living oxygenator. Although intracardiac surgery using only hypothermia had been performed before, Dr Lillehei's cross-circulation approach was truly the first practical open heart surgery that provided both direct vision and enough time to complete complex repairs. His early efforts were remarkably successful. Between 1954 and 1955, Dr Lillehei used cross-circulation to perform open heart surgery in 45 patients, with a survival rate >70%. He performed the first complete repairs of tetralogy of Fallot and atrioventricular canal defect. These results are even more remarkable when viewed in the setting of medicine in 1954, as precise pre-operative diagnosis was not always possible, the development and impact of pulmonary vascular disease was not well understood, and of course there was no such thing as the modern intensive care unit with the ability to view multiple haemodynamic waveforms simultaneously. Dr Lillehei's decision making in the early era of cardiac surgery was guided not by “high-level” evidence, but only by the knowledge of the natural history of congenital heart disease and the potential to intervene in the known anatomic pathology.
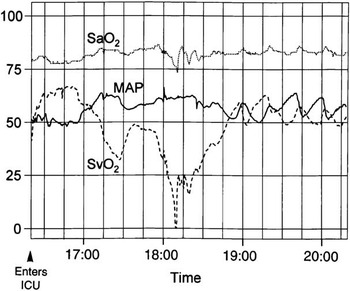
As cardiac surgery matured as a speciality from the heroic first steps of Dr Lillehei and colleagues, more and more complex anatomic challenges were undertaken. Despite our progress, the Norwood procedure in patients with hypoplastic left heart syndrome remains one of the higher risk neonatal cardiovascular surgery procedures commonly performed. Even when the procedure accomplishes the goals of relieving systemic outflow tract obstruction, providing coronary blood flow, creating a large non-restrictive atrial septal defect, providing enough but not too much pulmonary flow and getting prompt haemostasis, the post-operative course can be challenging. An all to common scenario in the first 12 hours was that of stable “railroad track” vital signs that was followed by sudden and unanticipated cardiovascular collapse.Reference Tweddell, Hoffman and Fedderly 1 In 1996, we began to place small, 4-French oximetry catheters in the superior caval vein of neonates following stage 1 palliation of hypoplastic left heart syndrome in order to measure venous oxygen saturation as an approximation of mixed venous saturation. The oxygen saturation of the mixed venous blood is an indication of the tissue oxygen economy; it is the last blood in contact with cells in the capillary bed and is a reflection of the balance between oxygen delivery DO2 and oxygen consumption VO2. We quickly identified that there could be large sudden changes in systemic oxygen delivery as a consequence of the trade-off between the pulmonary and systemic blood flow that is possible with parallel circulation.Reference Tweddell, Hoffman and Fedderly 1 These events were due to sudden abrupt increases in systemic vascular resistance and would result in a sudden increase in pulmonary blood flow at the expense of systemic blood flow. These shifts in the pulmonary-to-systemic flow ratio were not quickly or obviously identified by changes in blood pressure, central venous pressure, or arterial saturation, and yet systemic blood flow could decrease to critically low levels in a matter of a few minutes (Fig 1). This was the invisible problem that standard post-operative haemodynamic monitoring had not revealed. We learnt that sustained afterload reduction limited these systemic vascular resistance crises and resulted in a much more stable post-operative course.Reference Tweddell, Hoffman and Mussatto 2 , Reference Hoffman, Tweddell and Ghanayem 3 We began a prospective peri-operative observational database that includes data on the patient's anatomy, demographics, surgical and perfusion details, haemodynamics, ventilator management, vasoactive medications, laboratory data, and since 2001 regional tissue perfusion measured with near-infrared spectroscopy. The data in this database have been linked to a variety of outcome variables such as survival, use of extracorporeal membrane oxygenation, cardiopulmonary resuscitation, neurodevelopmental outcome, interstage course, and outcomes of subsequent stage 2 and 3 procedures.Reference Tweddell, Ghanayem and Mussatto 4 – Reference Ghanayem, Hoffman and Mussatto 6
Multi-channel recording of the arterial saturation (SaO2), mean arterial blood pressure (MAP), and superior vena cava saturation (SvO2) during the first 4 hours after the Norwood procedure in a control patient with aortic atresia. The Y-axis common to all three curves indicates both the percent saturation and the MAP. The X-axis indicates the time, with the vertical grid indicating 15-minute intervals. Two episodes of decreased SvO2 were identified, one beginning at 5:00 pm and a second beginning at 5:45 pm. Changes in the SvO2 were mirrored by changes in the MAP. Initially, the changes in the SvO2 were mirrored by changes in the SaO2, but with a marked decline in the SvO2 such as that which occurred between 6:00 and 6:15 pm. The SaO2 decreased as well. However, throughout the early post-operative period, the SaO2 remained within an acceptable range. These data indicate that the SaO2 cannot be relied on to indicate a balanced circulation. Acute changes in the SvO2 can occur, which are not reliably identified by either an increase or a decrease in the SaO2. These changes in SvO2 are associated with increases in blood pressure, and therefore are the result of abrupt increases in systemic vascular resistance. ICU = intensive care unit.Reference Tweddell, Hoffman and Fedderly 1

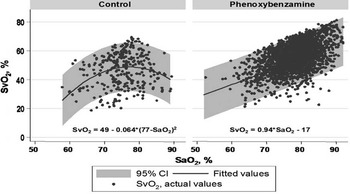
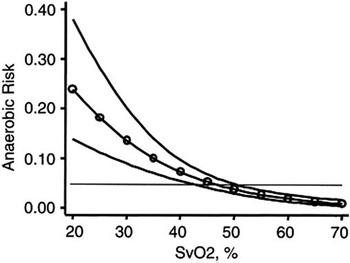
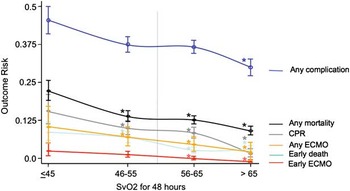
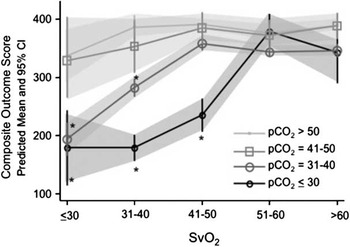
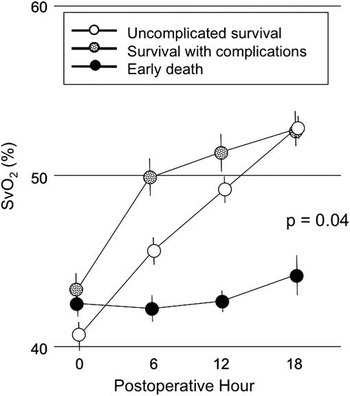
Over the last 15 years, we have learnt a great deal from this database. We have confirmed the benefits of sustained afterload reduction and the advantages of strategies targeting systemic vascular resistance rather than pulmonary vascular resistance for stabilising Qp/Qs in the early post-operative period (Fig 2).Reference Hoffman, Tweddell and Ghanayem 3 We have shown that as the venous saturation approaches 30% the risk of metabolic acidosis increases (Fig 3).Reference Hoffman, Ghanayem and Kampine 7 We have shown that venous saturation correlates with mortality and morbidity (Fig 4).Reference Tweddell, Ghanayem and Mussatto 4 We have identified a correlation between the early post-operative haemodynamics and late neurodevelopmental outcome.Reference Hoffman, Mussatto and Brosig 5 We have shown that near-infrared spectroscopy is also correlated with the anaerobic threshold, survival, complications, and neurodevelopmental outcome.Reference Hoffman, Ghanayem, Mussatto, Berens and Tweddell 8 – Reference Hoffman, Ghanayem and Mussatto 11 We identified the beneficial impact of mild hypercapnoea on neurodevelopmental outcome particularly among patients with lower cardiac output (Fig 5).Reference Hoffman, Mussatto and Brosig 5 All of these findings have been gleaned from our observational data that have been systematically collected and validated on patients undergoing stage 1 palliation of single ventricle heart disease for over 15 years. The relationships identified, such as the impact of afterload reduction and the relationship between neurodevelopmental outcome, venous saturation, and pCO2 (Fig 5), resulted in changes in practice and outcomes at our centre and centres around the world. The collection and analysis of data in real-time and reflecting actual real-world practice allowed us to make rapid changes to improve outcomes. Although we believe that monitoring venous saturation and regional perfusion provide important information for the individual patient, our prospective observations cannot show that for the individual patient the identification of low venous saturation or regional perfusion impacts outcome. Although this kind of “goal-directed therapy” has been studied in septic shock in children, we can only infer a benefit of this kind of monitoring for the post-operative Norwood patient (Fig 6).
The relationship between superior vena cava saturation (SvO2) and arterial saturation (SaO2) over the first 48 hours is shown for patients managed with and without sustained afterload reduction with phenoxybenzamine. Hourly data and fitted fractional polynomial regression lines with 95% prediction intervals are shown for the control (left panel, n = 307) and sustained afterload reduction with phenoxybenzamine (right panel, n = 2513) groups; the SvO2–SaO2 relationship was distinctly different between groups, as shown by fitted fractional polynomial equations. The SvO2 peaked at SaO2 of 77% in control patients, but continuously increased as SaO2 increased in patients receiving sustained afterload reduction.Reference Hoffman, Tweddell and Ghanayem 3

Prediction of anaerobic risk from superior vena cava saturation (SvO2). Predicted anaerobic risk and 95% confidence interval (CI) by logistic regression from SvO2 over a range from 20% to 70%, after adjustment for covariates. The 95% CI exceeds the baseline 4.8% risk, indicated by the horizontal line, as SvO2 approaches 30% (model R2 = 0.28; p < 0.0001).Reference Hoffman, Ghanayem and Kampine 7

Risk of complications according to post-operative superior vena cava oxygen saturation (SvO2) assessed hourly for 48 hours. The * indicates a significant difference from risk at lower SvO2 in time-series regression. (Error bars show the standard deviation. Blue line = any complication; black line = any mortality; grey line = cardiopulmonary resuscitation (CPR); orange line = extracorporeal membrane oxygenation (ECMO); green line = early death; red line = early ECMO.)

The interaction between post-operative pCO2 and systemic venous oxygen saturation (SvO2) is shown in a predictive model. Patients with lower post-operative pCO2 had poorer outcomes at lower SvO2 compared with that of patients with higher pCO2 (*p<0.05, analysis of variance). Adjustment for other parameters did not change the main or interaction model effects but increased the power (from R2 = 0.52 to 0.64). CI = confidence interval.Reference Tweddell, Ghanayem and Mussatto 4

Evidence for the benefit of venous saturation monitoring for individual patients can, strictly speaking, only be inferred by observational data. Among 116 patients undergoing a Norwood procedure with a right modified Blalock–Taussig shunt, those with the lowest 25th percentile for superior vena cava oxygen saturation (SvO2) upon arrival to the cardiac intensive care unit are shown here. Efforts were made to raise venous saturation by optimising rhythm, preload, afterload, and contractility, as well as haemoglobin, to improve blood oxygen-carrying capacity. A failure of the SvO2 to normalise in the first 18 hours was characteristic of those in the early mortality group (black circles). These data suggest that efforts to increase a low SvO2 are successful in a proportion of patients with the lowest SvO2. (Error bars show the standard deviation. Clear circles = uncomplicated survival; patterned circles = survival with complications.)Reference Tweddell, Ghanayem and Mussatto 4

As stated above, cause and effect relationships cannot be verified from observational data; this requires a randomised trial, and therefore the randomised trial is the gold standard of clinical studies. Observational studies suffer from the potential for uncontrolled factors to play a role in outcome and suggest correlations where there are, in fact, none. Perhaps one of the best examples of this in recent history of heart disease was the use of hormone replacement therapy in the treatment of post-menopausal women. Observational data suggested that hormone replacement therapy could reduce the risk of heart disease and stroke in post-menopausal women, but neglected to control for the fact that women on hormone replacement therapy tended to have more active lifestyles.Reference Stampfer and Colditz 12 – Reference Petitti 18 There were three randomised controlled trials including just under 20,000 women that showed no benefit and possible harm in terms of heart disease and stroke in women placed on hormone replacement therapy.Reference Beral, Banks and Reeves 19 Currently, hormone replacement therapy is not recommended to reduce the risk of heart disease. In this case, a randomised controlled trial was particularly well suited to the question of the benefit or harm of hormone replacement therapy. There was an enormous public health question to be answered, because half the population over a certain age was potentially at risk. It should be remembered, however, that in a randomised trial comparing treatment effects, one group will not benefit from the study and may be placed at increased risk. In the case of hormone replacement therapy, those women randomised to receive hormone replacement therapy were in fact placed at greater risk of heart attack and stroke.Reference Beral, Banks and Reeves 19 In the Woman's Health Initiative Study, comparing oestrogen plus progesterone to placebo among 8506 women receiving hormone replacement therapy, this amounted to 42 excess cases of coronary artery disease and 42 excess cases of stroke.Reference Rossouw, Anderson and Prentice 20 This could be justified because the answer before the study could not be ascertained and there was a large population at risk; in addition, there were other risks and benefits to hormone replacement therapy. In the treatment group, there was a decreased risk of endometrial cancer and femoral neck fracture, whereas the risk of breast cancer and pulmonary embolism was increased.Reference Beral, Banks and Reeves 19 These kinds of data could be used to guide therapy in individual cases where specific risks might merit the use of hormone replacement therapy.
Within the world of congenital heart disease, the recently completed Single-Ventricle Reconstruction Trial comparing the Norwood procedure with a right modified Blalock–Taussig shunt to the right ventricle to pulmonary artery conduit is another example of a question that was well suited to a randomised trial.Reference Ohye, Sleeper and Mahony 21 Indeed, the question of the relative advantage of a right ventricle to pulmonary artery conduit in comparison with a Blalock–Taussig shunt could only have been answered by this study. By the time the Single-Ventricle Reconstruction trial was initiated, there was little productive discussion on the topic, although the discussion was frequently entertaining, and most reports were retrospective studies with either historical or contemporary control groups that differed with respect to known risk factors. Paradoxically, it seems that some of the strongest opinions are based on the most meagre data. In the Single-Ventricle Reconstruction trial, a total of 555 neonates were enrolled in the trial, and the transplant-free survival at 12 months was better in the right ventricle to pulmonary artery conduit group. Despite the obvious need for a well-structured randomised trial in cases such as the decision making concerning the right ventricle to pulmonary artery conduit versus the Blalock–Taussig shunt, it must be remembered that one of the treatment groups will not benefit from participation in the study. In the Single-Ventricle Reconstruction trial among the 275 neonates randomised to a Blalock–Taussig shunt, there were 23 excess deaths and five excess heart transplants.
In what situations would a randomised trial be inappropriate? The Berlin Heart is the first practical paediatric assist device for the management of systemic ventricular failure and provides an example within the world of congenital heart disease where a randomised trial was not feasible. After it was widely adopted in North America and the superiority of the Berlin Heart to other forms of mechanical support in children was widely acknowledged, a study was designed to provide high-quality data to the United States Food and Drug Administration to seek approval for the device. Up until the introduction of the Berlin Heart, the most commonly used form of mechanical support in children was extracorporeal membrane oxygenation. Although capable of providing excellent short-term support for the heart and lungs, the duration of support was only about 14 days, too short to be of practical use as a bridge to transplant, and there was little potential for rehabilitation while on extracorporeal membrane oxygenation. In contrast, the Berlin Heart allowed patients to be extubated and even ambulate. Support could be measured in weeks rather than days. Clearly, a head-to-head randomised trial between extracorporeal membrane oxygenation and the Berlin Heart would be unethical and expose one arm of the study to substantially increased risk of mortality.Reference Addonizio 22 Rather, multi-institutional prospective observational data on the Berlin Heart recipients were compared with a control group drawn from the Extracorporeal Life Support Organization registry.Reference Almond, Buchholz and Massicotte 23 This study ultimately led to Humanitarian Device Exemption approval by the United States Food and Drug Administration for the Berlin Heart.Reference Foreman 24 , Reference Fraser, Jaquiss and Rosenthal 25
Other significant drawbacks to randomised trials include the limitations of external validity. The study design is necessarily focused to answer a specific question concerning a treatment under highly controlled conditions. Owing to strict inclusion and exclusion criteria in a randomised trial study, subjects could be quite different than those who may potentially receive the treatment after approval in the real world. There are many examples of medications that were found to be beneficial in drug company-funded studies only to be pulled after post-market analysis found significant drawbacks when applied to typical “real-world patients”. One noteworthy example is aprotinin, which was found to decrease bleeding in multiple randomised trials with thousands of subjects but was then found to be associated with increased mortality in a multinational observational data set.Reference Royston, Bidstrup, Taylor and Sapsford 26 – Reference Mangano, Miao and Vuylsteke 30
The aprotinin story also brings up the problem of pro-industry findings in industry-funded studies. Industry-funded randomised trials are three and four times more likely to result in findings favouring the industry funding the study.Reference Bekelman, Li and Gross 31 In the case of aprotinin, a randomised trial funded by the Canadian Institutes of Health Research and the Ontario Ministry of Health, the Blood Conservation Using Antifibrinolytics in a Randomized Trial, a comparison between antifibrinolytics in high-risk patients undergoing cardiac surgery essentially confirmed the results of the observational studies of Mangano et al and showed that compared with the lysing analogues aprotinin was associated with an increased risk of mortality.Reference Fergusson, Hebert and Mazer 32
Additional problems with randomised trials that limit their broad application to common problems in medicine include the high cost and long duration necessary to accumulate enough subjects. Furthermore, randomised trials are not well suited to studying rare events and/or those with end-points that are in the distant future. The study question must be narrow and the outcome must be definitively measurable. Although the data set of a randomised trial may be very rich and post hoc analyses may yield additional insights, these subsequent analyses of the original data set only have the strength of a prospective observational study.
Randomised trials are sometimes proposed shortly after a new treatment becomes available and while equipoise is still present. New treatments sometimes need time to become refined and an early randomised trial may not test the best way the new treatment can be applied. This could prevent widespread adoption of a beneficial treatment or render the study obsolete when subsequent refinement in the treatment strategy may show that it is clearly superior.
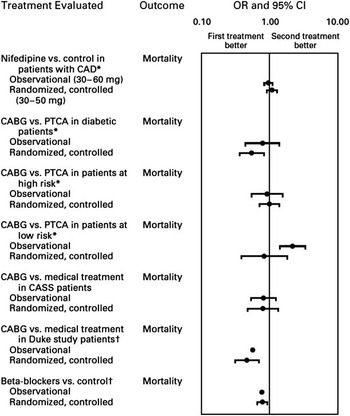
In two studies comparing randomised trials and observational studies, it was found that high-quality observational studies frequently correlate with randomised trials.Reference Benson and Hartz 33 , Reference Concato, Shah and Horwitz 34 Although observational studies commonly showed a stronger treatment effect, the direction of outcome was usually the same (Fig 7). Important divergence between randomised trials and observational studies was found most commonly in non-prospective studies with historical controls.Reference Ioannidis, Haidich and Pappa 35 Benson and Hartz analysed 136 reports on 19 treatments in a variety of areas and concluded “that observational studies usually do provide valid information. They could be used to exploit the many recently developed, clinically rich databases”. Concato reviewed 99 reports on five clinical topics and similarly concluded that “The popular belief that only randomized, controlled trials produce trustworthy results and that all observational studies are misleading does a disservice to patient care, clinical investigations and the education of healthcare professionals”.
Comparison of observational studies and randomised trials for treatment of cardiac disease. In general, there is good agreement between randomised trials and observational studies. CABG = coronary artery bypass graft surgery; CAD = coronary artery disease; CI = confidence interval; CASS = Coronary Artery Surgery Study; Duke = the Duke University Cardiovascular Disease Databank; OR = odds ratio; PTCA = percutaneous transluminal coronary angioplasty. Asterisks indicate studies that reported relative risks rather than ORs. Daggers indicate studies that reported neither a CI nor a p-value for the OR.Reference Benson and Hartz 33

Randomised trials are absolutely necessary to answer questions concerning the effectiveness of treatments when there is equipoise between treatment options, and this means that the treatment effect could be obscured by uncontrolled factors. Ideally, randomised trials should be applied to problems where there is a large population at risk, that is, all patients with hypoplastic left heart syndrome or all post-menopausal women. Owing to the fact that they have the potential to expose individuals to harm, randomised trials should not be undertaken if there is reasonable data suggesting that one therapy or another is better. The lack of a randomised trial is not equivalent to equipoise.
Even within the relatively narrow confines of questions that could be answered by randomised trials given the expense, duration, and narrow study questions, it is simply unrealistic to believe that we will have randomised trials to guide our decision making in most areas unless funding increases dramatically or we can find a rapid, inexpensive, and less cumbersome way to recruit patients and conduct the studies. Indeed, randomised trials guide us in very few areas in medicine. Rather, the vast majority of recommendations are based on expert opinion.Reference Tricoci, Allen, Kramer, Califf and Smith 36 Observational studies make up only a slightly larger proportion of the studies upon which guidelines are built. It must be remembered that the birth of cardiac surgery like all new areas of medicine was simply a series of case reports. Lillehei and colleagues were learning on the job. The outcome of a patient with an atrioventricular canal defect or tetralogy of Fallot was certain and Lillehei and those we followed believed they could save lives. Cross-circulation may not have turned out to be the optimal way to complete intracardiac repairs in children, although it most certainly never would have been attempted if a randomised trial had been required to evaluate it. In the meantime, the opportunity to acquire a great deal of knowledge about congenital heart surgery and indeed a number of young lives would have been lost.
Although information technology will benefit all study designs, it is already having an impact on observational studies. With the Internet, digital databases and registries, and the electronic medical record, we are on the threshold of a revolution of the prospective observational study. These databases are populated by various mechanisms and individuals with responsibility to specific areas, including financial, governmental, quality improvement, research and medical care. Increasingly, there is the potential to populate the databases almost automatically. Although accuracy needs to be established and validated, the potential for bias becomes less and less as those completing the data collection become disconnected from those analysing the data. Although each data set may be inadequate in some respects, combined they amplify the data in ways that may be more than additive.Reference Hammill, Hernandez, Peterson, Fonarow, Schulman and Curtis 37 – Reference Hernandez, Hammill and Peterson 39 The Society of Thoracic Surgeons Congenital Heart Database contains information on diagnoses and operative procedures, as well as short-term outcomes and complications, whereas the Pediatric Health Information System that is part of the Children's Health Corporation of America has data on medications. Pasquali et alReference Pasquali, Jacobs and Shook 40 , Reference Pasquali, Li and He 41 have shown that these data sets can be combined in a de-identified manner to detect relationships between diagnoses, operations, hospital medications, and survival, which would be impossible with each individual, stand alone data set. It must be remembered that we are just at the threshold of combined database analysis. With the expansion of the electronic medical record and the increasing amount of data collected, we could begin to collect enough data to have a high degree of granularity on the subjects, limiting the potential for confounding/uncontrolled variables, the primary shortcoming of observational data. Further, although there is some expense these studies are accomplished in a fraction of the cost and time of randomised trials. The Perioperative Working Group of the Pediatric Heart Network identified this need stating: “A registry based on a flexible platform with common data collection forms and a uniform data dictionary that could be used in a variety of settings (eg, different clinical trials and studies, screening and recruitment for studies, and routine clinical care) would greatly enhance the work of the PHN”.Reference Kaltman, Andropoulos and Checchia 42
Owing to the fact that we are only querying a database or databases, this kind of research could be very democratic and agnostic, permitting only those with a good hypothesis to participate. At the very least, it might identify questions and subject groups that would benefit from a randomised trial.
Conclusion
Prospective observational data sets will increasingly guide clinical management. Although all forms of clinical research will be augmented by the increasing amount of electronic data, observational data sets created almost as a byproduct of the electronic medical record and hospital administrative data sets can be increasingly combined with other data sets such as the Society of Thoracic Surgeons’ Database etc. to create larger data sets that will provide a large amount of data with increasing detail to permit identification of important associations between treatment and outcome, which will guide our management and identify specific areas where more rigid experimental design is necessary and justified.
Acknowledgements
The work presented in this paper on the peri-operative management of hypoplastic left heart syndrome was a combined effort of a number of my friends and colleagues, most notably and in alphabetical order: Stuart Berger, Nancy Ghanayem, George Hoffman, Maryanne Kessel, and Kathy Mussatto.