Before the nineteenth century, a trading voyage between Europe and Asia was long, arduous, and dangerous. The round trip generally took close to two years. Mortality of sailors was often high, and many ships were lost, wrecked, or captured. The only commodities which could bear the cost of freight were high-value, low-volume items such as tea, spices, raw silk, and cotton and silk textiles. These goods were sold in Europe for much higher prices than they had been purchased for in Asia. Kevin O'Rourke and Jeffrey Williamson (2002) have argued that although there was a trade boom in such goods, there was little globalization before the nineteenth century, because the price spread did not decline. Their view has been challenged by Jan de Vries (2010) among others.Footnote 1
O'Rourke and Williamson (2002, p. 46) date globalization to the early nineteenth century when, they argued, there was “a dramatic discontinuity…associated with steamships, railroads, the demise of mercantilism, the rise of trade liberalization, and the disappearance of trading monopolies.” Their evidence for this discontinuity was a large fall just after the Revolutionary and Napoleonic Wars in price differentials for products such as cloves, pepper, and coffee.Footnote 2 The same phenomenon can also be seen for less exotic products: in the 1780s the price of raw cotton in Liverpool was 5–7 times higher than that in Gujarat; by 1830 it had fallen to roughly two to one (Allen 2011, p. 60). In the 1780s the exports of this lower-value, higher-volume item from India to Europe were negligible but by the 1820s they had risen to about a tenth of Britain's cotton supplies (United Kingdom, 1847–48, p. 375).
This article takes no issue with when price differentials fell; it seeks to clarify the causes. The decades of the 1810s and 1820s were far too early for steamships or railroads to have mattered in trade between Europe and Asia.Footnote 3 This leaves a few alternatives. To begin with, the Dutch and French East India companies were casualties of revolution and war. The English East Company lost its monopoly on trade with India in 1813, though it kept control of the China trade until 1833.Footnote 4 If the fall in price differentials came from eliminating the East India Company's monopoly profit, we would have new evidence on the impact of early joint stock chartered trading companies. Ann Carlos and Stephen Nicholas (1988, 1990, 1996) characterize the companies as proto-multinational enterprises, with vertically integrated structures and administrative hierarchies designed to reduce transactions costs and limit opportunistic behavior. S. R. H. Jones and Simon Ville (1996) suggest instead that they were primarily effective at extracting monopoly rents. Neither party has proffered much evidence on the degree of monopoly profits. Jones and Ville would be vindicated if the sharp drop in price differentials that had persisted for over two centuries was entirely due to the disappearance of excess profits. On the other hand, supporting the view that the companies were cost-reducing organizations requires both low monopoly rents and a specific set of factors behind the decline in price spreads.
This article argues that a significant reduction in the cost of shipping between Europe and Asia took place between the 1770s and the 1820s. There was certainly the potential for major cost reductions. In his survey of early modern transport, Russell Menard (1991) notes that East Indiamen in the late eighteenth century carried only five or six tons of cargo per man, whereas in the Atlantic trades the ratio was between 15 and 20.Footnote 5 Unfortunately, whilst there is a vast literature that draws on the rich archives of the chartered companies, there has been very little work on continental European countries' Asian shipping after the early 1790s.Footnote 6 Most were, of course, shut off from Asian markets for about two decades by war, but trade did resume after 1815. Research on British shipping before the 1840s has focused on the East India Company (Sutton 1981), leaving in the dark the non-Company trade that emerged after 1815 (Ville 1987, pp. 7–8). Interest only tends to resume in the mid-nineteenth century when large-scale shipping companies, such as the Peninsular & Orient and British India lines, started to become important.Footnote 7
The wars partly masked the improvements in shipping to Asia that occurred between the 1770s and the 1820s. Conflict pushed up insurance rates until the mid-1810s and it constrained ships to travel in convoys. Other changes only took place after the India monopoly ended in 1813. But long-term progress, as will be seen here by comparing the peacetime period of 1783–1792 with that of the 1820s, was impressive. By the 1820s ships were making more frequent and faster voyages over longer lifetimes, and they carried twice as much cargo per crew member. In addition, losses of shipping in peacetime years fell, bringing down insurance costs. These cost reductions came partly from technological changes and partly from changes in the economic and political environment faced by shippers, notably in the rise of British naval hegemony in Asia. The end of the chartered companies did play a role, but it was a subsidiary and derivative one.
The focus of the article will be on British shipping to Asia during this period partly because Britain came to dominate the trade and partly because in certain respects it has been has been less well-studied than that of the continental countries.Footnote 8 But, where possible, information on the experience of the French and the Dutch, Britain's main rivals in the eighteenth century, as well as that of lesser players like the Danes and Swedes, will be integrated so as to tell as a European story. The United States, which was to become Britain's major nineteenth-century rival in Asian trade, will also play a part.
THE END OF THE EAST INDIA COMPANY MONOPOLY: WERE THERE HUGE RENTS AT STAKE?
There are several reasons to think that monopoly profits in Asian trade may not have large enough to drive the fall in price differentials. First, with a few exceptions, the companies had incomplete control over the quantities of Asian goods available to their home markets: they competed against each other in third markets, and smuggling of exotic goods was not uncommon (Bowen 2006, pp. 237, 241; De Vries 2010, pp. 724–25). The English East India Company also left room on its ships for private trade, which accounted for a significant share of imports. In K. N. Chaudhuri's (1983, pp. 806, 816–47) view, the English company's attempt to create a monopoly “was largely unsuccessful mainly through the connivance of the Company's own servants in India to illegal trading by private merchants.” Second, the English East India Company's monopoly was a temporary one, with its charter up for renewal in 1793, 1813, and 1833. Had exorbitant profits accounted for the huge price differentials, they would certainly have undermined the case for renewal in a political climate that was increasingly influenced by liberal principles (Mui and Mui 1984, pp. 133–34).
Third, the English East India Company, at least, did not seem to behave like a classic monopolist. Hoh-Cheung Mui and Lorna Mui (1984, pp. 130–33), in their detailed investigation of how the monopoly in Chinese tea was managed, argue that the Company's guiding principle was to ensure sufficient supplies of the various varieties of tea at reasonable and stable prices. The Company kept large stocks of tea in London and rather than restricting supply, released stocks to keep prices from rising too much. It consulted with buyers to forecast demand and to make sure that sufficient supplies were available. On tea, at least, the company's monopoly profit, relative to the prime cost in China was estimated to be only about 40 percent (Mui and Mui 1984, p. 152). The price differential for tea was only two to one and stayed at that level from the 1780s to the 1820s.
ENGLISH EAST INDIA COMPANY STOCK PRICES, 1807–1820

Finally, any loss of huge monopoly profits from the India trade had no echo in the Company's stock price (Figure 1). To be sure there is a dip during the period in which the renewal of the charter was under discussion, but afterward prices reverted fairly quickly to their earlier level.Footnote 9 In any case, the stock price only fell by about 15 percent, and it shows the same movement as Bank of England stock prices. Nor did the stock price fall with the onset of competition; on the contrary, it rose in the late 1810s, as did that of the Bank of England. These facts are not definitive because the loss of privilege in the India trade could have been compensated for either by additional profits in the still monopolized China trade or by revenues arising from the Company's political position in India. In addition, with the loss of the monopoly the Company was able to give up the export of British woolens to India and to get out of the saltpeter trade, two often loss-making activities mandated by Parliament (Bowen 2006, p. 254; Frey 2009). Still, resilience of the Company's stock price remains a prima facie indicator that no huge pool of profits was dissipated by competition. Moreover, the rises in stock prices that took place after the Indian monopoly ended in 1813 and the Chinese monopoly in 1833 might suggest that investors thought the Company well out of commercial activity. As De Vries (2010, p. 727) observed of the Dutch Company, an investor in “1648, or almost any date thereafter, is unlikely to have profited from his/her VOC share (i.e., government bonds would have paid as well).”Footnote 10
CHANGES IN EAST INDIA SHIPPING, 1770–1830
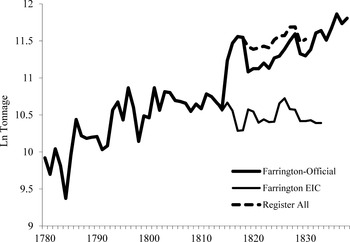
Figure 2 displays the numbers of ships leaving Britain for Asia, and Figure 3 shows the tonnage of these ships. The series come from several sources. Official statistics start in 1814 and over time provided an increasingly detailed breakdown of shipping by destination (though ships ultimately headed for China but stopping first in India were often included in the Indian figures).Footnote 11 The other series are aggregates from data on individual voyages. One series for East India Company shipping draws on Anthony Farrington's Catalogue of East Company Ships' Journals and Logs (1999), which is more complete than the contemporary compilations by Charles Hardy (1811, 1835).Footnote 12 In cases in which Farrington did not give tonnages, they have been filled in where possible from Lloyd's Register. The second series for East India company ships and the series for non-Company ships underlying the alternative series for all ships come from tables included in Lloyd's Register from 1818 onwards. These tables listed both “Ships in the East India Company's Service” (the Company hired, rather than owned, the ships, but they will hereafter be referred to as “Company ships”) and what were variously described as “Licensed India Ships” and “Ships Trading to India” (the “non-Company ships”). “India” clearly includes ships destined for Indonesia, China, and other Asian destinations. Information on tonnage that was missing from these tables has been supplied by reference to the general listings in the Register. Since tonnage measurements were often updated, the tonnages have been standardized to those found for the latest entry for any given ship.
BRITISH SHIPPING TO ASIA, 1780–1838: NUMBERS OF SHIPS
Figure 2 shows the rapid and continuing expansion of non-Company shipping after 1814 and the slow fall in the number of Company ships during the same period. The tabulations from individual voyages show a much larger increase than the official figures. Checks using the reports of clearances in Lloyd's List indicate that the official statistics do seem to significantly understate the number of voyages that took place, though the reason for this understatement is not evident.
Figure 3 shows the tonnages cleared from Britain to Asia expressed in logarithmic form. The discontinuity after the wars is still present, but a longer-term perspective suggests that the 1780s, 1790s, 1820s, and 1830s were on a common trend line. The intervening discontinuity had two elements. First, cargo volumes stagnated in the first fifteen years or so of the nineteenth century, which might be attributed to effects of war. This, however, was followed by a sharp recovery from 1815 to 1818 driven by unusually large imports of raw cotton from India.
BRITISH SHIPPING TO ASIA, 1780–1838: LOG TONNAGE

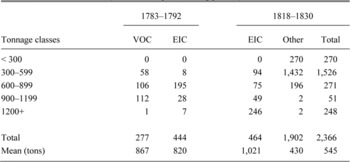
After 1814 the number of non-Company ships increased far more than did the tonnage they carried. This is because the non-Company ships averaged slightly over 400 tons, as against the average Company ship of about 1,000 tons. Although the Company had occasionally employed smaller ships before 1814, they still tended to be in the 500–700 ton range. The same change took place in Dutch shipping to Asia. In the 1780s the average Dutch East Indiaman measured 867 tons. In the late 1820s it was only 488 tons (Dagblad van's Gravenhage, 28 May 1830). In the analysis that follows, I track productivity separately for the large Company ships over the entire period from 1770 to 1830 and for the smaller ships after 1814. The specialized ships used by the companies were unusually large, compared to the ships used in the European and Atlantic trades (Menard 1991, p. 260). The move to smaller ships will be a central element in the fall in shipping costs.
SHIPPING FROM EUROPE TO ASIA BY SIZE OF SHIP

Sources:
VOC: Bruijn, Gaastra, and Schöffer (1979); EIC (1783–1792): Farrington (1999); EIC and Non-EIC (1818–1830): Lloyd's Register.
Beyond the shift from large to smaller ships, there were six major changes affecting shipping between Europe and Asia: 1) East India Company ships became larger in size; 2) ships, both Company and non-Company, made more frequent voyages to Asia; 3) ships came to have longer working lives; 4) ships made faster passages; 5) fewer ships were lost or wrecked; and 6) ships employed fewer men per ton.
Table 1 shows that the size distributions of ships for the Dutch and English companies. In the 1780s the English company's ships were somewhat smaller (820 tons) than the Dutch company's (860); both were between the Danish company's ships (787) tons and the Swedish company's (907).Footnote 13 The size of the EIC's ships grew over the period. The mean tonnages do not tell the whole story because from the 1790s the Company started engaging more “extra ships” for one voyage, and these were almost always smaller than regular ships. Setting aside the extra ships, the standard Company ship expanded from about 800 tons in the 1780s to 1,200 tons in the 1820s.
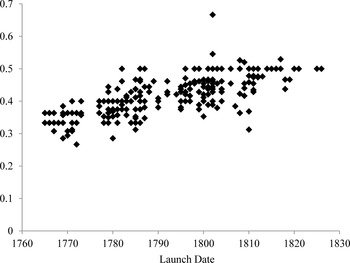
Ships were used more intensively over the period (Figure 4). In the 1770s and 1780s English East India Company ships were making roughly one voyage every three years, which was also the case for the ships of the other companies.Footnote 14 Frequency increased gradually until in the 1820s the English company's ships were making an outward voyage every two years.Footnote 15 Non-Company ships were used even more intensively: of the ships making at least four voyages between 1818 and 1830 the average frequency was three outward voyages every four years, and many ships were making an outward voyage every year.
VOYAGES PER YEAR: ENGLISH EAST INDIA COMPANY SHIPS (at least four voyages; excluding “extra ships”)

Ships also came to have longer working lives. Until the 1780s the English company had limited the ships that it hired to four voyages on the principle that its high value cargoes should not be entrusted to worn-out vessels. This was hard on shipowners because Indiamen were specialized vessels less well-suited to other trades: in 1792 vessels that went to the United States and the West Indies averaged only 221 and 233 tons (Fayle 1934, p. 223).Footnote 16 As a result, many East Indiamen were broken up on returning from their last voyage to Asia (Dalrymple 1786, pp. 2–5; Philips 1940, p. 80).Footnote 17 Dutch experience shows that the EIC's four-voyage cap may not have been very binding. Of the 101 ships built and owned by the VOC between 1750 and 1775, only 28 made more than four voyages and only three more than six voyages. The average was 3.7 voyages.Footnote 18 In 1780, under wartime conditions, the English company temporarily suspended the four-voyage limit, but it was not until 1790 that it increased the limit to six voyages (Sutton 1981, p. 35). In 1803 the limit was raised to eight voyages, and after 1810 the Company engaged ships for further voyages if they were judged to be in good repair (Auber 1826, pp. 653, 660).
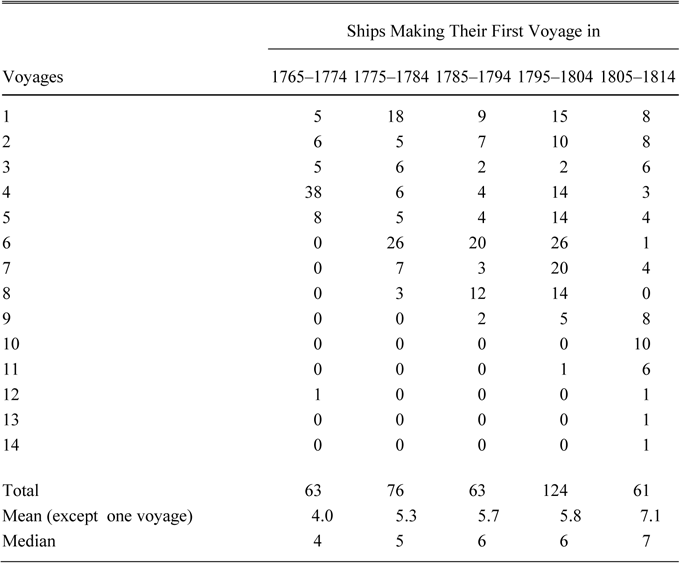
Table 2 shows the number of voyages made by English East India ships launched in various decades. The figures for 1765–1774 make it clear that the Company adhered to its rule with few exceptions. A few ships were allowed five voyages between 1763 and 1765. Then there were no exceptions until 1780; in the next few years, nine ships were allowed to make a fifth voyage, but none made a sixth. The trend towards more voyages was set, and ships launched around 1790 made about two more voyages on average than those launched around 1770, and those launched around 1810 made three more. The Company's principal ships, indicated by the modes, went from four voyages for those built in 1765–1774 to close to ten for those launched from 1805 to 1814. Four voyages, with a voyage every three years, imply a standard ship life of about 12 years; ten biannual voyages imply a life of about 20 years.Footnote 19
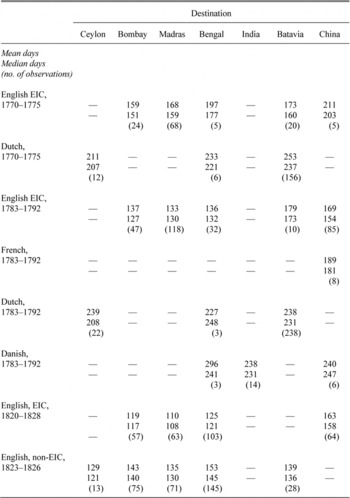
One element, but probably not the major one, in the higher frequency of voyages was faster sailing times. Table 3 summarizes the evidence on days of sailing from Europe to the first port of call in Asia. Since the distributions tend to have long tails and the occasional extremely rapid passage, both the mean and median days to each destination are given.
VOYAGES PER SHIP: ENGLISH EAST INDIAN COMPANY SHIPS
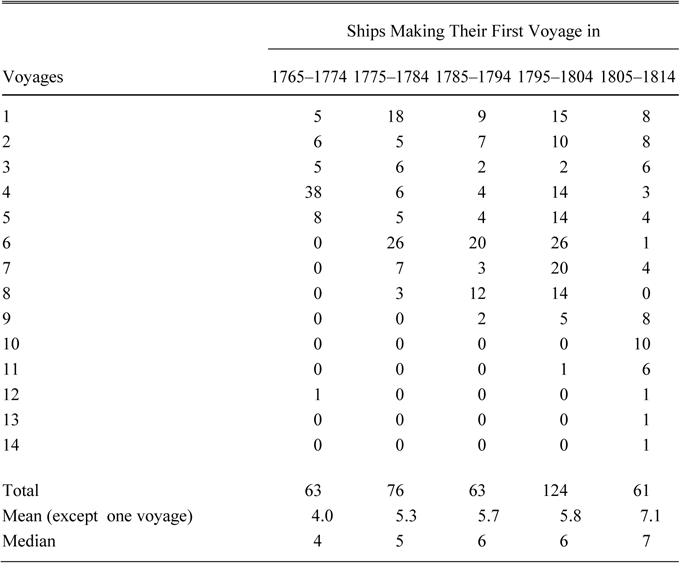
Notes:
The means are calculated without ships making one voyage since the Company occasionally hired unspecialized vessels for one voyage only.
Source:
Farrington (1999).
Before considering changes over time, it must be noted that in the 1770s Dutch and Danish ships took about two months longer to reach (and to return from) Asian destinations than their English rivals. This is a very large gap, the causes of which deserve further research.Footnote 20 The English advantage increased by another month or so in the 1780s, but from then until the 1820s the gains in speed were more modest, something on the order of 10–20 days for East India Company ships. Although non-Company ships were making more frequent voyages than Company ships in the 1820s, they do not seem to have done so by sailing faster. They generally made slower passages than did the Company ships of the 1780s.
DURATION OF OUTWARD VOYAGES TO ASIA

Notes:
Numbers of observations are in parentheses.
Sources:
EIC: Farrington 1999; Non-EIC: Lloyd's Register, 1822–1826; Lloyd's List, 1823–1826; French: Veyssière 2000, pp. 215–79; Dutch: Bruijn, Gaastra, and Schöffer 1979; Danish: Velschow 1972.
EUROPEAN SHIPPING TO ASIA: SEASONALITY OF DEPARTURES

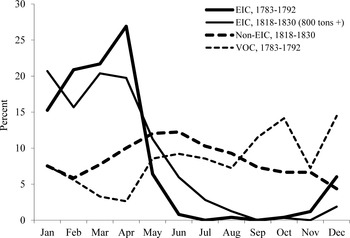
The differences in voyage duration may help account for some substantial variations in the seasonality of voyages. Initially, East India Company departures were heavily concentrated in the first half of the year (Figure 5). In the 1780s the season started to get underway in December and ended in late May or early June, but by the 1820s December departures were less common and departures in the summer more common, which may be related to the shorter voyage durations. In the 1780s Dutch (and Danish) ships departed mainly in the second half of the year, perhaps because they took two or three months longer en route.Footnote 21 What is particularly interesting is that the departures of non-Company English ships in the 1820s were spread fairly evenly over the year, with a peak in May and June. (A similar pattern characterized the departures of the smaller ships employed by the Company in the same period.) Why the monsoons were not as much of a constraint for non-Company shipping remains obscure.
Ship losses fell over time. In the peacetime years between 1783 and 1792, the English East India Company lost seven ships in 249 voyages, for a loss rate of 2.8 percent. The Dutch company had a slightly higher rate, at 3.3 percent of 301 voyages. By the peacetime years 1818–1830, the English company's loss rate had fallen to 1.1 percent. In the 1820s the smaller non-Company ships may have had a somewhat higher loss rate than the Company ships. Reports of losses and wrecks in Lloyd's List for the seasons 1822/23 to 1825/26 indicate a rate of about 3 percent.
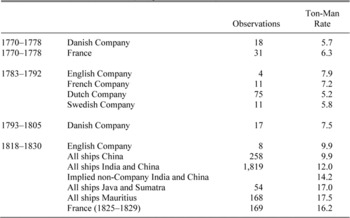
Crew size also fell over time. The nominal crew for EIC ships throughout the eighteenth and early nineteenth centuries was 100 men, though this could go up to 130 on larger ships. An 800-ton ship of the 1780s should thus have been operated at eight tons per man. In 1830 William Maxwell, a captain with 25 years' East India Company service, regarded ten tons per man as conventional (United Kingdom, Lords Journals 1830, p. 601). Direct observations on East India crews are relatively rare, but the few available observations (Table 4) are consistent with the nominal rates and show an increase from about eight to about ten tons per man. Note that in 1780s the English Company's ships already operated with more tons per man than did the continental companies' ships.
No direct observations on the crews of non-Company ships in the 1820s are available, but we can approach staffing numbers in three ways. One is to infer it from the aggregate statistics of shipping to India and China by subtracting the tonnage of Company shipping from the numerator and the implied crew numbers from the denominator.Footnote 22 This gives a figure of 14.2 tons per man. The second way is to observe labor usage on Asian routes that were largely served by non-Company shippers. Ships to Mauritius and Indonesia had rates of 17 tons per man or higher. The third way is to see what happened to staffing in the India and China trades after the Company's China monopoly ended in 1833. Over just a few years rates rose by about six tons per man on ships bound for China and by just over three tons per man on the ships bound for either India or China. The speed with which this change took place implies that it was due to the withdrawal of the large ships from the trade. The evidence thus suggests that whilst Company ships had ten tons per man in the 1820s, non-Company ships had about 16 tons per man, a finding that accords well with the ton-man rate on French ships in the late 1820s.
TON-MAN RATES

Sources:
Danish: Gøbel 1993, p. 107; France, 1770–1778 and French Company, 1783–1792: Veyssière 2000, pp. 215–79; France, 1825–1829: France, Tableaux du Commerce, 1825–1829; English Company: Farrington 1999; other English: United Kingdom, annual returns of shipping.
CHANGES IN SHIPPING COSTS ON ASIAN ROUTES
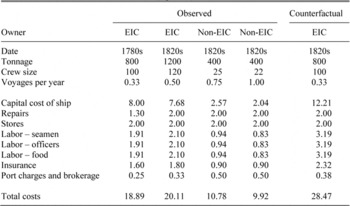
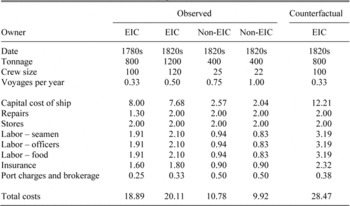
What did all of these improvements mean for shipping costs? With a good number of assumptions, it is possible to make some rough calculations of costs for five stylized cases (Table 5). The first four cases correspond to contemporary experience: 1) a representative East India Company ship in the 1780s (800 tons, 100 crew, four voyages over twelve years); 2) a typical East India Company ship of the 1820s (1200 tons, 120 crew, ten voyages over twenty years); 3) a typical non-Company ship (400 tons, 25 crew, 15 voyages over 20 years); and 4) a best practice non-Company ship (400 tons, 22 crew, 20 voyages over twenty years). The fifth case is a counterfactual: an East India Company ship of the 1780s (800 tons, 100 crew, four voyages over twelve years) facing 1820s factor prices. Note that all of these calculations are for English ships. Since continental ships had longer passages, made less frequent voyages and had lower ton-man rates in the 1780s, their costs in the 1780s may well have been higher and the corresponding fall in costs over time even greater.
COSTS OF ENGLISH SHIPPING TO ASIA (£ per ton)
Notes:
See the text.
Sources:
See the text.
Fixed capital costs were calculated as the charges per voyage that over the lifetime of the ship would, when properly discounted, just cover the cost of construction. The cost of construction included not only the hull, but also sheathing, masts, rigging, and guns. East Indiamen are taken to have cost £19 per ton in the 1780s and £30 per ton in the 1820s.Footnote 23 Non-Company ships were much cheaper to build. In the 1780s costs of non-Company ships built by London yards were said to be about 40 percent lower (Bowen 2006, p. 283). Contemporaries put the cost in London at around £9 per ton and in the outports at about £8, but Henley & Son were able to have ships built in the early 1790s for as low as £5 per ton (Davis 1962, p. 361; Ville 1987, pp. 47–48).Footnote 24 In the 1830s several witnesses before the Select Committee on Manufactures put the cost of a good ship ready for sea at about £15 per ton, which is the value that will be used for non-Company ships in the 1820s.Footnote 25 The discount rate used is 12.5 percent, based on Robert Allen's (2009a) calculations of the aggregate return to capital in the British economy during this period, as well as the evidence he cites concerning realized profit rates in cotton and woolen textile enterprises.Footnote 26 This rate also accords well with the average of the realized profit rates on voyages undertaken by the London firm of Michael Henley and Son, which was 13.4 percent (Ville 1987, pp. 174–75). Ships were not worthless at the end of their lives, so it has been assumed in the capital cost calculations that their scrap or resale value was 20 percent of the initial cost.
Ships had to be maintained and equipment replaced. A calculation for 1804 suggests that major repairs were needed after three voyages and that these could amount to £9–10 per ton for an East Indiaman. Since prices were much higher in war years than in the 1780s or 1820s using the 1804 figure may tend to exaggerate the costs, so repair costs, for both East Indiamen and non-Company ships, will be taken as £1.3 per voyage in the 1780s and £2 per voyage in the 1820s. These costs are in line with Charles Feinstein's (1978, p. 65) index of timber and wage costs in shipbuilding. The replacement of sails, rope, and other equipment may have cost another £2 per ton per voyage in the 1820s. The same value is used for the 1780s on the basis that the price of sailcloth was similar in the two periods.Footnote 27
Labor costs were calculated in three stages. First, it was assumed that 60 percent of the crew was ordinary sailors and that in the 1780s and in the counterfactual they were paid for 17 months and in the 1820s for 14 months on Company ships and 10 months on non-Company ships, reflecting the frequencies and duration of voyages discussed above.Footnote 28 Wage costs per voyage for ordinary seamen are then simply the combination of those durations with monthly wages of £1.5 in the 1780s and £2.5 pounds in the 1820s.Footnote 29 Second, the wage cost for officers was calculated on the assumption that they were paid in aggregate the same as the ordinary seamen.Footnote 30 Third, the cost of feeding the officers and crew was assumed to be half the total wage cost, along the lines suggested by an East India shipowner in the 1830s (United Kingdom 1835, p. 424 (James Aiken)). Ralph Davis (1962, pp. 355–56) cites costs for the mid-eighteenth century consistent with this ratio.
During the second half of the eighteenth century, the peacetime rate for marine insurance on shipping to Asia was about 8 percent (John 1958).Footnote 31 Although the observed fall in shipping losses discussed above would seem to indicate that the rate in the 1820s should have been about 3 percent, several bits of evidence suggest that it was about 6 percent and this latter figure has been used.Footnote 32
Other shipping costs included port charges and brokerage costs. Ville (1987, pp. 702–22) puts these at about 6.5 percent of variable costs for Henley's fleet. For a ship of 400 tons, this would come to about £200, or £0.5 per ton. Port and brokerage charges were not proportional to tonnage, and they are assumed to be £300 for an 800 ton ship in the 1820s, £400 for a 1,200 ton ship in the 1820s, and £200 tons for an 800 ton ship in the 1780s (Martin 1832, p. 104). These calculations of total costs (Table 5) correspond surprising well to the relatively limited information available on freight rates between England and Asia. In 1786, after prolonged negotiation with shipowners, the East India Company agreed to rates of £24 per ton to China direct, £26 to Bombay and £27 to “Coast and Bay” (Bengal) (Auber 1826, p. 452). These rates are somewhat higher than the calculated cost, likely because the powerful group of shipowners who were also major shareholders in the English Company earned some rents. In 1823, when conditions were more competitive, the Company hired large ships for six voyages at £21 5s, not far off the calculated cost of £20.11 (Hardy 1835, n.p.). The Company also hired ships, usually of much smaller size, for one voyage. In the 1820s it paid an average of £11 16s per ton, a bit above the calculated cost (Hardy 1835, n.p.). For non-Company ships, contemporaries put the sum of outward and return freight rates to India at between £7 and £8 10s, but regarded these rates as “not remunerating.”Footnote 33
The cost calculations bring out several important features of the evolution in shipping between 1780s and 1830. The move to small ships after the wars cut the cost of shipping in half.Footnote 34 But this ignores the improvements that had been made over time in Company (and non-Company) ships. The counterfactual calculation, combining as it does 1780s techniques and conditions with 1820s prices, shows these improvements to have been almost as important in reducing costs as was the move to small ships. The cost calculations also make it possible to gauge the importance of different factors in the reduction of costs. As concerns the changes over time, falling capital costs arising from more frequent voyages over a longer ship's lifetime accounted for 54 percent of the reduction in costs, higher ton-man rates accounted for 39 percent, and lower insurance costs 6 percent. Of the change from large Company ships to smaller non-Company ships, lower capital costs due to less elaborate ships and more frequent voyages accounted for about 55 percent of the gains, higher ton-man rates for about 37 percent, and lower insurance costs 9 percent. This last reduction in insurance costs arises from the lower value per ton of non-Company ships, which is closely related to their lower capital costs. The importance of savings on capital is a feature of the changes in shipping in this period that the usual concentration on labor productivity fails to detect.
FACTORS BEHIND THE COST REDUCTIONS IN SHIPPING OVER TIME
Capital costs fell in shipping to Asia because of the rise in the frequency of voyages and because of ships' greater longevity. The increased longevity of ships owed most to improvements in ship construction, especially the introduction of copper sheathing as protection against worm and weed (Harris 1966). In tropical waters ships bound for Asia faced the threat of teredo worms which could rot the ship's hull and imperil its security. The accumulation of barnacles and weed slowed ships and made them less maneuverable. In Britain the Royal Navy led the way and coppered the entire fleet between 1779 and 1781. Merchant vessels, followed soon after: the share of the English fleet coppered rose from 3.3 percent in 1786 to 17.9 in 1816 (Rees 1971, p. 87). The first ships to be coppered were slavers and privateers, followed quickly by Indiamen and somewhat later by ships trading to the West Indies.Footnote 35 By 1788, 22 of the 26 vessels used by the English East India Company had copper sheathing and the advantages of coppering figured in its decision in 1790 to allow ships to make six voyages (Rees 1971, p. 91). In the 1820s both Company and non-Company ships trading to Asia were almost all coppered.
Copper sheathing contributed to the increased frequency of voyages by reducing the need for lengthy refitting and by increasing speeds. The impact of copper sheathing on voyage times can be seen in a sort of natural experiment. The Dutch East India Company did not start sheathing its ships until the early 1790s. As Table 3 shows, there was little change in outward voyage durations for Dutch ships between the early 1770s and the 1780s, whilst the English ships gained a month or so. Copper sheathing was not a free lunch. Estimates in 1790 suggest that it cost something close to £1 per ton (Harris 1966, p. 555). The sheathing also had to be renewed, usually after three voyages, but much of the copper could be reused, reducing the cost of maintenance. Given the savings in capital costs realized over the period, the return to coppering was high.
Alternative, but less plausible, explanations for the low frequency of voyages in the late eighteenth century are rationing of voyages and inadequate infrastructure. In the 1760s and 1770s there were complaints that the English company's costs were inflated because it had too many ships on its books. In 1772 Parliament forbade the Company from chartering new ships until its total tonnage was reduced to 45,000 tons. It is possible that there was still too much tonnage in the 1780s, but the experience of the continental companies makes this unlikely. Of the ships that made only two voyages for the English Company in the years 1783–1792, the average gap between departures was 2.8 years. For the Dutch Company it was 3.6 years, for the Danish 3.2, and for the Swedish 3.0. For ships making three voyages the English gap of 5.6 years between first and last departure compares favorably with the Dutch one of 5.9 years and the Danish one of 6 years.
Inadequate infrastructure and commercial organization, either in Asia or Europe, might have prolonged voyages, but given the average voyage duration, English vessels generally spent four to six months in Asia acquiring cargo before returning with the monsoon. The greater frequency of voyages, taken together with the modest reduction in passage time, implies that ships were spending less time in port in the 1820s than they had in the 1780s. Beyond copper sheathing which reduced maintenance downtime, other factors may have contributed. Improvements in port infrastructure, in Europe or in Asia, may have helped speed turnaround times, but it is difficult to isolate the major changes that took place. Another possibility is changes in the composition of cargoes. Shippers may have increasingly specialized, reducing the time needed to acquire a return load. In the late 1820s there were certainly some ships that brought back only cotton, but most ships carried a mix of saltpeter, rice, indigo, sugar, and spices (LMPC 1828; GGA 1828).
Labor costs on East India Company ships fell for two reasons. One was a modest increase in the ton-man rate, probably part and parcel of an equally modest increase in rates for English mercantile shipping as a whole (Lucassen and Unger 2011, pp. 11, 16). Labor costs also fell because voyage length shrank. Faster sailing times and changes in departure dates meant that the voyage lasted on average 14 months instead of 17 months. Some of this reduction in costs resulted from coppering and other improvements in ship construction, but part was also probably due to improvements in navigation. Longitude measurement improved, charts became more accurate, and the prevailing winds became better understood (Kirkaldy 1914, pp. 307–09; Fayle 1934, pp. 210–12). C. Northcote Parkinson (1937, pp. 106, 161) notes that a route saving a thousand miles from the journey was unknown until 1811, though he argues elsewhere that passage times improved after 1815 only because of competition.
The fall in insurance costs is also to be attributed to improved ship construction and better navigation. Philippe Haudrère (1991, p. 17) judges that most French ship losses in the eighteenth century were the result of erroneous or incomplete charts. There was also a fall in piracy after the wars, but this made little difference to well-manned and armed East Indiamen. In the peacetime years between 1783 and 1792, no East India Company ships had been taken; they had only been lost, burnt, blown up or never heard of (Hardy 1811).
FACTORS BEHIND THE COST REDUCTIONS DUE TO SMALLER SHIPS
When the trade shifted from large East India Company ships to smaller non-Company ships capital costs fell again for two reasons. Smaller ships with their much reduced armament simplified design and fabrication (Unger 2011, p. 257). Less timber was required and hulls were easier to mould, reducing construction costs (Glete 1993, pp. 52–53). Smaller ships also reduced loading and unloading time, permitting a higher frequency of voyages.Footnote 36
Abandoning heavy armament reduced labor costs directly and indirectly. There was no longer any need for a large crew to man the guns. Fewer guns and men also made more space available for cargo. The effects of doing so can be seen from 1828 when the English Company's began hiring “dismantled ships,” vessels which had been stripped of their armament. The freights paid were much lower than for the regular Company ships, though still well above the rates that the Company paid to hire smaller vessels.
The lower cost of smaller ships raises the key question: why did the English East India Company, or the continental companies for that matter, not use them earlier? Richard Unger (2011, p. 250) has argued that “by the eighteenth century shipbuilders and shippers had, through trial and error and because of the rising volume of trade, discovered the optimum size for sailing ships at somewhere around 400 tons.” Indeed, in 1786/87 a French census of European shipping (Britain excepted) showed only 282 ships of 600 tons or more (Romano 1962). These large ships, many of which would have been involved in Asian trade, accounted for only 3.6 percent of all European ships over 100 tons. To some extent, the companies did use smaller ships. From the 1790s the English East India Company occasionally hired what were called “extra ships” for a single voyage. These extra ships were generally smaller than the regular company ships, but were still relatively large, in the 500–700 ton range. The Dutch Company also sometimes sent out ships of this size, and even smaller, in the 1780s. But the main business of the companies continued to be done in heavily manned and armed ships, and the reason was clearly security. The importance of large ships was still being defended in the early 1830s. As Peter Auber (United Kingdom 1831/32, p. 146), Secretary to the English Company, argued before the parliamentary committee on the Company's affairs:
I doubt very much, upon the outturn of the whole concern in the long run, whether it will be found, that when the services they have performed, the cargoes they bring, and the security and safety altogether of that class of ships are considered, they much exceed the cost of the private traders. It is an important point to bear in mind, that from the opening of the trade to the present time peace has existed; but I should confidently predict, that if we were to be at war again with any naval power, the India trade (and supposing the China trade to be thrown open it would be still worse, for the Indian Archipelago presents the means of resort for privateers, and rendezvous for an enemy,) the loss to the commercial interests of this country would be very great, for anything like a sufficient convoy or security to that commerce could not possibly be afforded.
Auber identifies two sorts of threats, from other powers and from privateers. But he was not taking account of a world that had changed fundamentally during the Revolutionary and Napoleonic Wars.
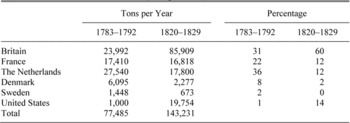
In the eighteenth century, power in Asia was multipolar. On land, and occasionally at sea, native rulers were still important (Marshall 1980). At sea, the English, French, and Dutch were more or less on a par in Asian trade (Table 6).Footnote 37 There are no figures for these powers' naval strength in Asia, but in total numbers of frigates and small ships, the sorts of vessels usually deployed there, the English navy had slightly more ships than the French and Dutch navies taken together (Glete 1993, appendix 2). It is a commonplace that wars were frequent in the eighteenth century, and these wars had implications for Asian trade. The European powers sought to capture each other's' trading ports and ships, both naval and mercantile. The chartered company fleets were at first the principal actors in this struggle (Bowen 2006, pp. 44–50; Lavery 1996, pp. 31–39). Only from the early 1740s did the European powers start to send naval squadrons to the Indian Ocean (Graham 1965, p. 44).
EUROPEAN AND AMERICAN SHIPPING TO ASIA (average annual)

Sources:
Britain: 1783–1792: Farrington 1999; 1820–1829: United Kingdom, annual returns of trade and navigation.
France: 1783–1792: Dermigny 1964, p. 206; 1825–1829: France, Tableaux du Commerce, 1825–1829.
Netherlands: Bruijn, Gaastra, and Schöffer 1979; 1820–1829: Horlings 1995, p. 391. The numbers of Dutch ships cleared for Asia in the 1820s comes from Horlings, who also gives figures for the tonnages cleared, derived by applying an estimated average tonnage of about 1,050 tons. Returns for the numbers and tonnage of ships entering ports in Java and Madura show that a correct factor should be more like 480 tons, which is used here (Dagblad van’s Gravenhage, 28 May 1830). Horlings' figures are also not consistent with the estimated fall of about two-thirds in employment in East Indian shipping between 1780 and 1827 (Van Lottum, Lucassen, and Van Voss 2011, p. 319).
Denmark: 1783–1792: Feldbæk 1978; 1820–1829: Møller 1974, p. 110, estimated according to the number of ships with China and East India destinations in 1820–1829 relative to 1783–1792.
Sweden: 1783–1792: Kjellberg 1974; 1823–1829: Sweden, Generalsammandrag 1824–1830.
United States: 1783–1792: assumed on the basis that the tonnage entered from Asia was 1,000 tons in 1791 and 1760 in 1792; United States, American State Papers, Commerce and Navigation, vol. 1, pp. 217, 252; 1820–1829: United States, Reports on Commerce and Navigation, 1820–1829.
Not only did navies attack merchant vessels, states licensed privateers to prey on enemy shipping. Henning Hillman and Christina Gathman (2011, p. 731) have shown that privateering in the eighteenth century was highly profitable, though becoming less so over time. They argue that it was “a strategy that both opened up promising business opportunities during wars and contributed to the economic and political power of states at little additional cost to their governments.” Even in peacetime, when privateering was not a threat, shipping in Asia was risky. Pirates from the Persian Gulf preyed on shipping along the west coast of India, and piracy was also common in the Moluccan straits. But the threat from pirates should not be overstated. In 1821 a witness told the House of Lords that ships of 250 or 350 tons would be considered secure against the pirates in the seas near Penang (United Kingdom, Lords Journals 54 (11 April 1821), pp. 215, 223).
In a world of war, privateering, and piracy, the use of large, armed ships by the chartered companies made sense and, as these vessels also made excellent privateers, their use by all the European companies can be thought of as the outcome of an arms race. Indeed, over time these vessels tended to become larger (De Vries 2003, p. 50). One of the lessons drawn by the East India Company from the wars between 1776 and 1783 was that their ships were not equal to those of the Dutch, and as a result they started to commission larger vessels (Parkinson 1937, p. 165).
Since large, armed ships were expensive to build and operate and difficult to deploy in other trades, their construction required a long-term commitment. The VOC built its own ships while the EIC signed long-term contracts with private shipowners. Both chartered companies' monopoly on trade prevented private shippers—using smaller, cheaper vessels—from cherry-picking in periods of peace. In the context of this arms race, the chartered monopoly was thus an effective way of organizing trade.
The French case is particularly interesting for this interpretation. In the 1760s the French Company's ships averaged 784 tons, considerably larger those of the EIC. After its financial failure and abolition in 1769, French ships trading to Asia became much smaller, averaging 482 tons in 1771–1777 and 388 tons in 1783–1792 (Haudrère 1989, vol. 4, pp. 1215, 1227). These smaller ships had to take care to avoid being captured. One French shipowner instructed his captain to “emploierés toutes les précautions imaginables pour n'étre pas approchés d'aucun navire de quelque pavillon qu'il vous parraise et vous fuirés tous les parages dangereux” (Dermigny 1959, p. 45). The perils of relying on small ships became apparent when France went to war against Britain in 1778. The aggregate tonnage of French shipping to Asia during the wars was only 43 percent of that in peacetime years of the 1770s and only 30 percent of that in the peacetime years of the 1780s. The founding of a new French Company in the mid-1780s had a good deal to do with widely expressed dissatisfaction with the results of free trade, but its difficulty in raising capital, as well as some financial shenanigans, meant that the average size of French Indiamen was only beginning to grow before the Company's demise in 1790 (Nussbaum 1933).Footnote 38
The Danish experience also departs from the European norm (Feldbæk 1978). The Danes had a chartered company, but its monopoly from 1772 was limited to the China trade. The Danish Company did send ships to India, but so, too, did other private shippers, often English merchants operating under the Danish flag. In the China trade the Danes used large ships, of 1,068 tons on average in 1783–1792, but smaller ships prevailed in the trade to India. The Danish company's India ships averaged 576 tons and non-Company ships 447 tons. The Danes may have been able to get away with using smaller ships because they remained neutral throughout the eighteenth century. Indeed, in wartime periods some ships from other countries arranged to sail under the Danish flag, though it meant that they were obliged to land their cargoes in Copenhagen. But if neutrality protected Danish shipping from the depredations of the major powers, it remains puzzling why the Danes continued to employ such large ships in the China trade.
The other country that used its neutrality to run smaller ships to India and China was the United States.Footnote 39 The small ships that Americans used in the China trade were particularly notable. In the 1790s and 1800s the East India Company was repeatedly frustrated in its efforts to rein in American ships carrying goods both within Asia and from Asia to Europe (Furber 1938).Footnote 40
French, Danish, and American experience shows that private shippers preferred smaller ships if it was safe to use them. The rise of British hegemony in Asian waters not only made the seas safer, but also by making the chartered monopolies no longer necessary as proxy navies, gave private shippers the leeway to use whatever sized ships they wanted. After 1815 the Royal Navy ruled the seas and Britain dominated trade with Asia (Graham 1967). Of frigates, the sort of ships most suited to Asian service, Britain's share had risen to 58 percent in 1820, twice as many as its European rivals taken together (Glete Navies, appendix 2). Table 6 shows that Britain's share of the mercantile tonnage cleared to Asia had doubled to 62 percent in the 1820s. Evidence on European and American shipping at Indian ports and at Canton confirms this dominance.Footnote 41 The British also began to take concerted action against pirates. In 1809 and 1810 naval and East India Company forces destroyed three pirate bases and over 80 pirate vessels in the Persian Gulf (Gardiner 2002, pp. 88–91). In 1819 another naval expedition was sent to subdue pirates based in the Strait of Hormuz. In the 1810s and early 1820s the British, with intermittent Dutch help, tried to eradicate piracy in the Moluccan Straits (Graham 1965, pp. 52–54; Tarling 1963, pp. 69–70, 82–89). With peace and the reduction in privateering and piracy, shippers from all countries went over to lightly manned ships of 300–400 tons, with the attendant reduction in costs.Footnote 42 The trade to East Asia was thus able to reap gains to safer seas that had been attained much earlier in the Atlantic (Menard 1991, pp. 274–75).
Greater security for shipping between Europe and Asia probably meant that shipping within Asia was also safer. Kaori Sugihara (2009) has argued for a resurgence of intra-Asian trade in the first half of the nineteenth century. He attributes this to a “regime change from mercantilism to forced free trade,” though he acknowledges the role played by improved ports and ships. In the eighteenth century the Dutch Company sent a regular surplus of large East Indiamen to Batavia, ships which were then used in intra-Asian trade. In the 1750s these averaged 819 tons. The English Company played a lesser role in trade from Indian ports, but private English shippers based in India also operated large ships, most of which were built in India.Footnote 43 These “English” ships were said to have been favored by Asian merchants, who were willing to pay higher freight rates for the security that they offered (Marshall 1987, p. 283). Safer seas may well have permitted a similar move to smaller, more lightly manned ships and promoted the increase in “country trade.”
IMPACT OF THE COST REDUCTIONS ON PRICE DIFFERENTIALS
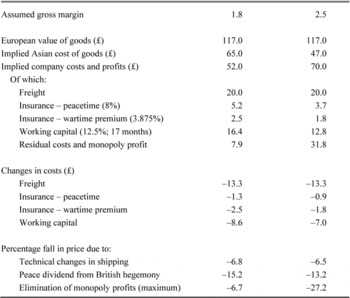
Table 7 reports estimates of the potential impact that these improvements in shipping could have had on price differentials. The calculations start from the overall gross margins of the chartered companies, which ranged from 1.8 to 2.5 in the mid- to late eighteenth century. De Vries put imports of Asian products by the British, French and Dutch at 52.8 million guilders in the 1770s. His total is increased to 60 million guilders to take account of the Danes, Swedes, and others. These products were brought to Europe by 46,000 tons of shipping, leading to a value of imports per ton of £117.Footnote 44 Given the range of margins, the cost of the goods in Asia was between £47 and £65 per ton and the difference between prime cost and sale price was between £52 and £70 per ton. Certain costs can be estimated, notably freight (from the calculations above); insurance on merchandise in peacetime; the wartime insurance premium (on the basis that conflict prevailed in half the years); and working capital costs (based on an interest rate of 12.5 percent). The residual includes all other costs of acquiring and selling the goods, general administrative overheads, and any monopoly rents.
POTENTIAL IMPACT ON PRICE DIFFERENTIALS, 1770S

Notes:
See the text.
Sources:
See the text.
The reductions in costs arose from lower shipping costs, from safer seas, and from shorter voyage times. These have been partitioned into changes due to technical progress in shipping, which includes half of the fall in shipping costs and the entire fall in the peacetime insurance rate, and changes due to safer seas and the consequent ability of smaller ships to make return voyages within the year. This second effect, attributed to British naval hegemony, is about twice as large as that due to improved ships and better navigation. Together they produce a 20–23 percent reduction in the European price of Asian goods. This fall is much larger than what could be expected from the elimination of monopoly profits. Indeed these are bounded above by the residual of the calculation which also includes administrative and other costs. Whatever monopoly profits remained after administrative and other costs would have been fallen to the company or to its shipowners and ship captains.Footnote 45
The observed reduction in price differentials came suddenly in the aftermath of the French wars because much of the gain was driven by the move to small ships. That move was hastened both by the end of the India monopoly in 1813 and by peace in 1815. The reduction in costs due to technical changes was more gradual, but its impact on freight rates and price differentials would have been offset, at least in part, by wartime increases in insurance rates and the use of convoys, which tended to increase voyage durations. Round trip durations were actually a month or two longer in the early 1810s than they had been in the 1780s (Hardy 1811, 1835).
Yet there must have been some fall in monopoly profits since the fall in shipping costs was too small to explain fully the very large fall in price differentials for exotic goods such as cloves, pepper, and coffee. Or perhaps it is better to say monopsony and monopoly profits. The Dutch Company did have fairly tight control over Asian supplies of these commodities and was able to keep supply prices very low. The price of cloves in Southeast Asia was fixed by the Dutch in 1656 and remained constant until the 1770s. Similarly, the price paid for pepper by the Dutch in their colonial domain remained the same from 1680 to 1789 (Bulbeck et al. 1998, pp. 26–31, 58–59, 82–84, 167–69). However, by the late eighteenth century these commodities represented less than 15 percent of the value of Dutch company shipments to Europe and an even smaller share of English shipments (Jacobs 2006, pp. 354–55; Chaudhuri 1983, pp. 818–19, 842). Given the special nature of supply conditions for these items and their small and decreasing importance in trade, one should not, like O'Rourke and Williamson, take the margins on these goods as representative of trade between Asia and Europe.
The fall in shipping costs had, of course, a larger impact than simply a fall in prices. It expanded the range of goods that could be profitably traded between Europe and Asia. As noted above, by the 1820s India came to supply about a tenth of Britain's cotton supplies. In addition to the fall in shipping costs, the large drop in the price differential for raw cotton owed a great deal to the increased capability of compressing this bulky item into denser bales. Davis cites a court case in the early eighteenth century in which it appears that a ton of cotton took three to four times as much space as a ton of sugar or water (Davis 1962, p. 178). Powerful baling presses were being imported into India from the 1790s, though it is hard to quantify their impact on Indian freight rates for cotton (BL, IOR, H/374, 21 May 1794, 18 October 1797). The American experience suggests that it could have accounted for a halving or more of rates (Harley 1988, p. 857; French 1987).
CONCLUSION
The end of English East India Company monopoly mattered, but not primarily because the Company had been acting like a classic monopolist, as has been suggested by O'Rourke and Williamson and Jones and Ville. The English Company and the other European chartered companies had been effective institutions for organizing trade in a multipolar world in which war was as common as peace and in a region where governments had not yet assumed what Frederic Lane (1966, chaps. 22–25) termed the costs of protection. As Britain came to control the seas and increasingly the land in Asia, the chartered company had outlived its usefulness and made way for the sort of ordinary trade carried on by smaller, lightly manned ships that had long characterized the Atlantic world. There was for European consumers a peace dividend in the form of lower prices for Asian goods, though they or the Europeans' Asian subjects may have had to pay somewhat higher taxes to sustain an increased imperial presence in Asia. These changes in the composition of shipping, as well as improvements in ship construction and navigation, were key to reducing shipping costs between Europe and Asia. The changes during this period are a mix of the premodern and the modern. Menard (1991, pp. 274–75), drawing on a literature pioneered by Davis and James Shepherd and Gary Walton, has argued that before the nineteenth century, “productivity gains rooted in better techniques played only a minor role in the growth of trade. Broad political and commercial developments fostered the safe shipment of large quantities across great distances by turning the oceans of the world into a vast inland sea dominated by Europe's major metropolitan capitals.” As he shows in the cases of the wine trade within Europe and of the rise of the Atlantic economy, safe seas could lead to significant reductions in freight rates. The effects of British hegemony on trade between Europe and Asia can be seen as the last act in this early modern story. Yet the introduction of copper sheathing heralds the changes in technology, notably the application of iron and steam power to shipping, that would lead to the further falls in freight rates during the second half of the nineteenth century, changes that have been so clearly explicated by C. Knick Harley (1988).
The changes that took place in shipping between Europe and Asia between the 1770s and the 1820s were a marked discontinuity in the global economy. Ton-man rates on Dutch East Indiamen had remained more or less constant since the early seventeenth century, as had real freight rates on Dutch and English ships (Menard 1991).Footnote 46 The large reduction in the costs of shipping after the French wars helps account for the narrowing of price differentials between Europe and Asia. As such, it contributed, along with the mechanization of industry in Europe, to the scissors movement in prices that in the nineteenth century turned India and China from manufacturers to suppliers of raw materials in the global division of labor (Chaudhuri 1983, pp. 807, 842–43).