Introduction
As is well known, the retina of the zebrafish (Danio rerio) provides an unusually favorable preparation for genetic, developmental, and functional studies of the retina (Connaughton & Dowling, Reference Connaughton and Dowling1997; Li & Dowling, Reference Li and Dowling1997, Reference Li and Dowling2000; Schmitt & Dowling, Reference Schmitt and Dowling1999; Emran et al., Reference Emran, Rihel, Adolph, Woong, Kraves and Dowling2007; Fadool & Dowling, Reference Fadool and Dowling2008; Nelson & Singla, Reference Nelson and Singla2009; Connaughton, Reference Connaughton2011; Randlett et al., Reference Randlett, Norden and Harris2011). The retinal anatomy has been described in detail and follows the general organization found in vertebrates (Connaughton & Dowling, Reference Connaughton and Dowling1997; Schmitt & Dowling, Reference Schmitt and Dowling1999; Mangrum et al., Reference Mangrum, Dowling and Cohen2002; Connaughton et al., Reference Connaughton, Graham and Nelson2004; Connaughton, Reference Connaughton2011). The retinal neurons are relatively small, and thus, their light-evoked responses are difficult to study by intracellular recording. Hence, the vast majority of what is known about the light-evoked response of the zebrafish retina comes from studies of the electroretinogram (ERG), a mass extracellular field potential typically recorded with a gross electrode on the cornea in response to illumination of the entire retinal surface (Hughes et al., Reference Hughes, Saszik, Bilotta, Demarco and Patterson1998; Patterson et al., Reference Patterson, McDowell, Hughes and Bilotta2002; Saszik et al., Reference Saszik, Alexander, Lawrence and Bilotta2002; Wong et al., Reference Wong, Gray, Hayward, Adolph and Dowling2004; Nelson & Singla, Reference Nelson and Singla2009). The zebrafish ERG shows the classic components found in other vertebrates—an a-wave of photoreceptor origin along with b- and d-waves that are believed to arise primarily from bipolar cells (Wong et al., Reference Wong, Gray, Hayward, Adolph and Dowling2004; Nelson & Singla, Reference Nelson and Singla2009). Thus, the ERG has provided an accessible index of the massed light-evoked response of the outer retina. On the other hand, little is known about the light-evoked response of the inner retina since intracellular recordings from amacrine and ganglion cells have not been reported to date.
The present report provides new insight into signals in the inner retina. By intraretinal recording, it will be shown that the zebrafish retina generates a local and prominent field potential, the Proximal Negative Response (PNR) whose properties are fundamentally similar to the PNR previously found across all vertebrate classes (Burkhardt, Reference Burkhardt1970; Holden, Reference Holden1972; Ogden, Reference Ogden1973; Burkhardt & Mooney, Reference Burkhardt and Mooney1977; Gustafson et al., Reference Gustafson, Stevens, Wolosker and Miller2006) including unpublished work in rabbit (D.A. Burkhardt and R.F. Miller) and mouse (R.F. Miller). The response arises in the inner retina of zebrafish, is largely restricted to small (e.g., 100 μm) precisely positioned spots of light, and is exceedingly sensitive to negative luminance contrast. It is clearly distinguished from the intraretinal b-wave of the ERG recorded in the distal retina. The distribution in depth, polarity, waveform, and correlation with nerve impulse activity suggests that the PNR primarily reflects the response of ON-OFF neurons in the proximal retina.
Color contrast may well have been the driving force for the evolution of color vision in vertebrate vision (Walls, Reference Walls1963). It is known that zebrafish have four classes of cone photoreceptors (Robinson et al., Reference Robinson, Schmitt, Harosi, Reece and Dowling1993) and chromatic-type horizontal cells in the outer retina (Connaughton & Nelson, Reference Connaughton and Nelson2010) but nothing is yet known about signals for color contrast. Here, we devise an experimental design to search for the existence of the encoding of color contrast in the inner retina. The relation between color contrast and luminance contrast is analyzed quantitatively by comparing the response of a moving green bar on green versus red backgrounds. We conclude that color contrast is encoded in the zebrafish retina and important when luminance contrast is low, as if often found in nature (Burkhardt et al., Reference Burkhardt, Fahey and Sikora2006), whereas when luminance contrast is high, color contrast is not evident and may be suppressed. These results have an intriguing parallel with Kirschmann’s third law of color contrast, long known for human vision (Kirschmann, Reference Kirschmann1891; Boring, Reference Boring1942; Alpern, Reference Alpern1964; Gordon & Shapley, Reference Gordon and Shapley2006). Taken together, the findings in the present report provide new evidence for spatial discrimination, color, and luminance contrast processing in the zebrafish retina and suggest that the PNR may provide a tractable tool in the future for investigating function in the inner retina for genetic and developmental studies of zebrafish.
Materials and methods
Preparation and Recording
Adult zebrafish (D. rerio) were obtained from commercial sources. Animals were anesthetized with a 0.05% solution of MS222 for 5–10 min prior to decapitation and pithing in accordance with a protocol approved by the IACUC of the University of Minnesota. The surgical procedure was similar to that developed by Nelson and Singla (Reference Nelson and Singla2009). The eye was enucleated and placed cornea up on a piece of Millipore filter paper (EMD Millipore, Billerica, MA). A #25 hypodermic needle was used to make a very small puncture in the cornea for the entry of a small scissor (Fine Science Tools, #15006-09, Fine Science Tools, Inc., Foster City, CA). Most of the iris and cornea were then cut away without encroaching on the retina. The lens was removed by suction while undercutting the vitreous. The resulting eyecup was then covered with Ringer solution and the scissor used to make about 10 radial cuts (about 1 × 1 mm, W × H) around the circumference of the eyecup. The resulting flaps were partially retracted. The Ringers solution was then rapidly drained so that the flaps retracted further, yielding a relatively flat eyecup preparation. The eyecup, still adhering to the Millipore paper, was transferred to a small recording chamber (about 50 × 12 × 2 mm, L × W × H). The edges of the flaps were very gently restrained against the base of the chamber by small pieces of waterproof tape. The retina was then superfused at about 1 ml/min with Ringers solution at room temperature (20–23°C). Fluid level in the chamber was stabilized to a level of 1–2 mm above the retina by continuously draining the Ringer solution via gravity with a paper wick of appropriate dimensions. The Ringers solution was composed of (in mM): 111 NaCl, 22 NaHCO3, 2.5 KCl, 1.5 MgCl2, 1.5 CaCl2, and 9 dextrose. The pH was regulated at about 7.5 by bubbling the superfusate with 98% O2 and 2% CO2.
Intraretinal recordings were made with glass micropipettes, pulled on a patch electrode puller to a tip dimension of 2–4 μm and then filled with Ringer solution. Electrodes had resistances ranging from about 3 to 6 MΩ. Light-evoked responses were amplified (band-pass filtered at either DC to 1000 Hz or 0.1 to 1000 Hz), permanently recorded on tape and later digitized for analysis. Signal/noise was improved by a noise eliminator (“HumBug”; Quest Instruments, North Vancouver, BC, Canada) without distorting the response. In the illustrated figures, the high frequency cutoff was reduced to 225 Hz.
Stimulus generation
Stimuli of white light from a tungsten halogen source were generated by an active matrix liquid crystal display (Magnabyte m3x; Telex Communications, Minneapolis, MN) controlled by custom software as previously described in detail (Burkhardt et al., Reference Burkhardt, Fahey and Sikora1998, Reference Burkhardt, Fahey and Sikora2004, Reference Burkhardt, Fahey and Sikora2007). Luminance contrast steps of white light of variable magnitude and optimal spatial dimensions were presented on a 2-mm background field of 200 or 20 cd/m2. The stimulus position could be varied in discrete steps of 15 μm and the diameter of circular spots in discrete steps of 45, 100, 240, 382, 496, 609, 750, 1000, 1490, and 2000 μm. Luminance contrast is specified as the logarithm of the contrast ratio, defined as log10 (S/B), where S is the intensity during the step and B is the background intensity. Thus, stimuli that increase or decrease the background light level by the same factor differ only in sign: for example, 10× increases and 10× decreases are specified as log contrasts of +1.0 and −1.0, respectively. For detailed discussion and advantages of this contrast metric, see Fahey and Burkhardt (Reference Fahey and Burkhardt2001).
For color contrast experiments, a Mitsubishi projector (MT 830) (Mitsubishi Electric Corporation, Irvine, CA) with an arc lamp source, modified optics, and custom software were used to generate green moving bars of variable irradiance on a red or green background field. The bar was 1 mm long by 200 μm wide and moved in the direction of axis of the long dimension over a track of about 2 mm at a velocity of 660 μm/s. The lateral position of the bar was always carefully adjusted to evoke a maximum response. Two broadband high pass filters (Kodak Wratten #86, 594-nm dominant wavelength) were placed in series to modify the spectral distribution and the relative irradiance levels of the projector output. This was essential to get the red and green lights at appropriate levels for experiments on color contrast. The resulting spectral distributions were measured with a spectroradiometer in 10 nm steps. The green light had a peak output at 550 nm with half-bandwidth points of 530 and 575 nm. The red light had a peak output at 595 nm with half-bandwidth points of 580 and 645 nm. The relative irradiances of the red and green lights were varied under computer control and by neutral metallic film filters without producing significant changes in the spectral distributions. The maximum output irradiances of the red and green lights were 2.52 and 2.92 log μW/cm2, respectively.
Results
Defining properties of two field potentials in the zebrafish retina
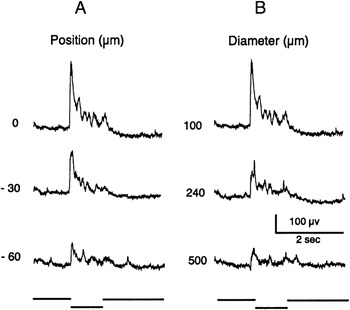
When the electrode was advanced to contact the surface of the retina, small nerve impulses were typically seen riding upon a small field potential at the onset and offset of a 0.5-s light flash of white light. The potential then increased markedly to reach maximum amplitude as the electrode was gradually advanced in the proximal retina to a depth of about 30–60 μm from the retinal surface, thus lying near the distal border of the inner plexiform layer. As shown in Fig. 1A, a vigorous response of good signal/noise was then evoked by a small spot of 100 μm in diameter but the response was much reduced when the spot diameter was increased to 2000 μm. As will be shown and discussed in further detail below, this response recorded in the proximal retina has all the properties of the field potential previously demonstrated in other vertebrate retinas and known as the PNR (Burkhardt, Reference Burkhardt1970; Burkhardt & Mooney, Reference Burkhardt and Mooney1977; Gustafson et al., Reference Gustafson, Stevens, Wolosker and Miller2006). In contrast, Fig. 1B shows that a response of quite different spatial properties and waveform was observed when the electrode was advanced into the distal retina. This response is the local intraretinal ERG (Burkhardt, Reference Burkhardt1970). The large diameter spot evokes a waveform that is dominated by a large negative b-wave but the b-wave is then greatly reduced when the spot diameter is reduced to 100 μm. Although the exact electrode depths at which the PNR and the intraretinal b-wave reach maximum amplitude were not determined in the present work, the pattern and sequence of results shown in Fig. 1 were invariably observed. At intermediate depths, a hybrid response, consisting of both b-wave and PNR, was observed. In sum, the distribution of field potentials in the zebrafish retina is consistent with that found previously in other vertebrate retinas. The remainder of this report focuses exclusively on the PNR. The electrode depth was adjusted to obtain a PNR of maximum amplitude, while the retina was held in a steady state of light adaptation by background illumination of 200 or 20 cd/m2 covering the entire retina. Spontaneous fluctuations of the baseline of about 0.5–1.0 Hz were typically associated with the PNR.
Responses of the PNR in the proximal retina (row A) and the intraretinal ERG in the distal retina (row B) to light flashes of identical centered spots of 100 and 2000 μm in diameter. The ERG evoked by the 2000 μm stimulus shows a small positive a-wave followed by a large negative b-wave. Negative is up in this and all subsequent figures. Flash illuminance is 30 cd/m2. No background illumination.

For all quantitative studies described below, the position of a 100-μm test spot of low contrast was first carefully adjusted to yield a maximum response. This proved to be critical since the zebrafish PNR is very sensitive to stimulus position. Fig. 2A shows an example. For the response at the top left, a 100-μm spot is positioned to evoke a maximum response. When the 100-μm spot is then displaced only 30 μm, the response is much reduced and subsequently, only a small response is observed at a displacement of 90 μm. Fig. 2B shows that a striking reduction in the response also occurred when the diameter of the centered spot was increased above 100 μm. The acute position sensitivity to small spots and the marked reduction in the response to large spots were invariably observed. These spatial tests were carried out with the flash contrast held constant at a low level (see Fig. 2 legend) to avoid response saturation. In the following section, stimuli were always centered in position and were 100 μm in diameter.
(A) PNR evoked by a contrast step of 100 μm in diameter when centered (position 0) or displaced from center by 30 and 90 μm. (B) Effect of stimulus diameter on the PNR. The response for the 100-μm diameter spot is the same as for the 0 position in (A). The amplitude is significantly reduced for concentric stimuli of 240 and 500 μm. The contrast of all the stimuli is −0.15 on a 2-mm background field of 200 cd/m2.

Responses to luminance contrast
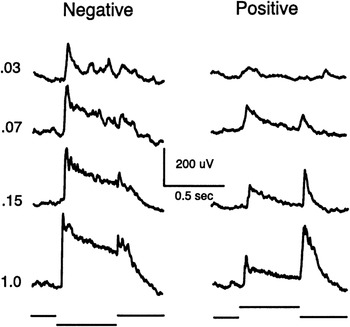
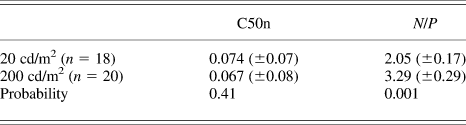
Fig. 3 shows responses evoked by negative and positive contrast steps of white light on a background of 200 cd/m2. The representative findings are: 1) the response is very sensitive to small contrast steps. 2) The peak amplitude increases rapidly, approaching saturation at modest contrasts. Thus, a contrast of about −0.07 evoked a half-maximal response. 3) The ON-response to negative contrast, in both sensitivity to small contrasts and maximum amplitude, is much greater than that to positive contrast steps. This new finding, called “negative contrast dominance” hereafter, was invariably observed. 4) For the OFF responses, the maximum amplitude to positive contrast was larger than the OFF-response to negative contrast but was always less than the maximum ON-response evoked by negative contrast. 5) Following the peak response, the waveform of the response to negative contrast is more sustained than the positive contrast waveform. This tendency was common, although the sustained component varied in degree, depending both on the contrast magnitude and from one retina to the next (compare Fig. 2vs. Fig. 3). All quantitative analyses below are based on measurements of peak amplitude, measured from the baseline level found just prior to the peak of the ON- or OFF-response. There was variation in the peak amplitude of the maximum ON-response from one retina to the next (mean = 472 μV ± 178 s.d., n = 32) and in the contrast response (see Table 1). However, in any given retina for fixed stimulus conditions, responses were quite reproducible when repeated stimuli were monitored. Hence, response averaging was not necessary and all responses and measurements in this report are based on single stimuli.
PNR evoked by steps of negative contrast (left column) and positive contrast (right column) for a centered spot of 100 μm in diameter on a 2-mm background field of 200 cd/m2.

Mean values (±s.e.m.) of measurements on backgrounds of 20 and 200 cd/m2 for C50n, the contrast that evokes a half-maximal response to negative contrast and N/P, the ratio of the maximum response to negative contrast divided by the maximum response to positive contrast
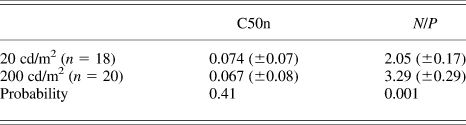
Probability was determined from Student’s t-test for unpaired samples. Tests for paired samples (n = 12) gave very similar statistics to those shown.
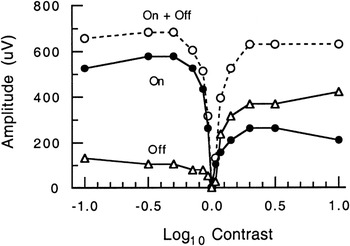
Fig. 4 shows complete contrast/response plots for the peak responses of the recording described in Fig. 3. These measurements reinforce the general points summarized in the previous paragraph. In addition to plots for the ON-response (filled circles) and OFF-response (triangles), the sum of the ON- and OFF-response amplitudes is plotted as open circles. The curve for the sum is V-shaped, passing through zero contrast and then rising rapidly. The approximate symmetry of the curves for the sum is largely a consequence of the roughly inverse asymmetries seen in the underlying curves of Fig. 4.
Contrast/response plot for the responses of Fig. 3. Peak amplitude of the ON-response (filled circles), OFF-response (triangles), and sum of the ON and OFF amplitudes (open circles).

Contrast/response plots were analyzed in a total of 26 retinas. The finding of negative contrast dominance was quantified by computing the ratio, N/P, where N and P are the maxima of the ON-responses to negative and positive contrasts, respectively. As shown in Table 1, negative dominance increased significantly from about 2 to 3 on backgrounds of 20 versus 200 cd/m2, respectively. This effect was largely due to a change in the maximum responses to negative versus positive contrast, whereas the total amplitude range and C50n, half-maximal amplitude for negative contrast, remained approximately constant (Table 1). Measurements on lower backgrounds were not fully investigated but the response to negative contrast steps on very weak backgrounds was reduced along with the N/P ratio.
Responses to color contrast
In human vision, the existence of responses to color contrast may be tested by presenting a stimulus of one color (e.g., red) on a background of another color (e.g., green) when the red and green lights are equated for luminance (see, e.g., Legge et al., Reference Legge, Parish, Luebker and Wurm1990). However, for zebrafish and most other animals, settings for equal luminance are either indeterminate or problematic. Responses to heterochromatic flicker have been reported for zebrafish (Patterson et al., Reference Patterson, McDowell, Hughes and Bilotta2002) but these results are based on the mass corneal ERG and not readily generalized to intraretinal recordings nor to the broadband spectral stimuli and the adaptation conditions of the present report. Therefore, the approach taken in this report consists of presenting a green stimulus on either a red or a green background while varying the irradiance of the green stimulus over identical values on both backgrounds. Thus, the only difference is whether the background is red or green. With the rationale that a moving stimulus is more germane to natural stimuli than flashes of light, the stimulus consisted of a rectangular bar, 200 μm wide and 1000 μm long, moving in the direction of the long dimension of the bar at a velocity of 660 μm/s. The values of these parameters and the background irradiance levels were selected as optimal from preliminary results. The bar generated distinct responses to the leading and trailing edge as it first moved into and then out of the background field.
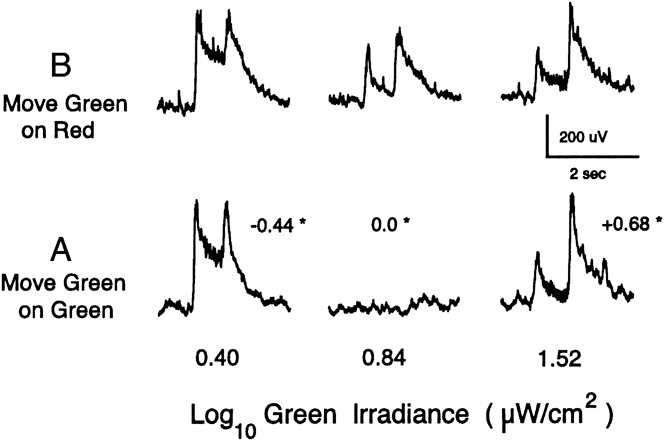
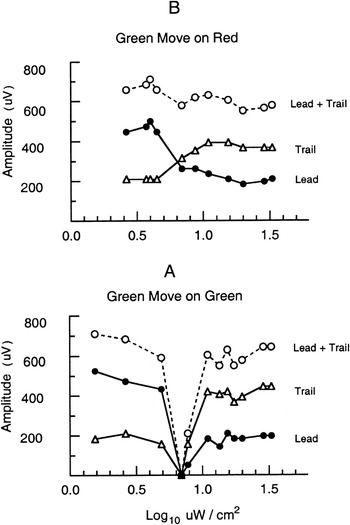
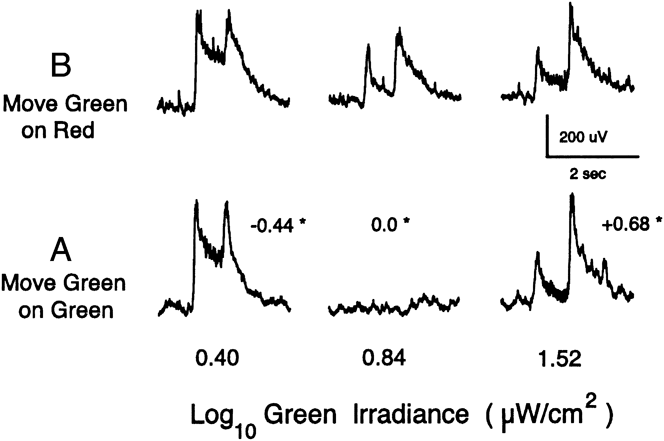
Fig. 5A shows responses evoked by the green bar on the green background at three levels of irradiance given along the bottom. Since the spectrum of the green bar and background are identical, the luminance contrast of the bar relative to background can also be specified by the equation given in the Materials and methods section. The resulting contrast values are shown in small print with an asterisk next to each of the three responses. As expected, there is no detectable response at zero contrast. On the other hand, strong ON-OFF responses are evoked at the two extreme irradiances, equivalent to contrasts of +0.68 and −0.44. Fig. 6A shows measurements for all the leading and trailing responses in the contrast series. The sum of the leading and trailing responses is also plotted (open circles). The measurements in Fig. 6A for green lights are clearly similar to that found in Fig. 4 for responses to steps of luminance contrast for white light.
Responses to a moving green bar (200 × 1000 μm, W × L) on a green background (A) and on a red background (B). The irradiance of the green bar is shown at the bottom. The luminance contrast for the green bar on green background is shown by the small numbers with an asterisk near each response. Velocity of the bar is 660 μm/s. Irradiances of the green and red background fields are, respectively, 0.84 and 1.12 log μW/cm2. The green background is equivalent to a white light of about 90 cd/m2.
Peak amplitude of the responses evoked by the moving green bars of Fig. 5. Response to the leading edge (filled circles), trailing edge (triangles), and the sum of the responses to the leading and trailing edges (open circles). (A) Green bar on green background. (B) Same green bar irradiances on red background.

Fig. 5B shows responses to the green bar on the red background to the same three irradiances of the green bar as used in Fig. 5A. The amplitude and waveform of the responses at the two extreme irradiances are very similar to those in Fig. 5A, suggesting that all four responses are dominated by luminance contrast. However, unlike the case in Fig. 5A, a clear response is evoked at the intermediate irradiance (0.84) in Fig. 5B, thereby providing evidence for encoding of color contrast. The results from the green on red condition of Fig. 5B are shown in full quantitative detail in Fig. 6B. Although the responses to the leading and trailing edges vary with the green bar irradiance, neither come close to approaching zero, as would be expected in the absence of color contrast. Consequently, the sum of the trailing and leading edge responses (open circles) defines a curve that is almost flat over the entire irradiance range. On the other hand, the curve for the sum of the responses for the green bar on green background in Fig. 6A is V-shaped.
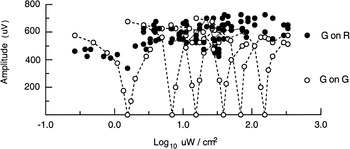
The pattern of results shown in Figs. 5 and 6 was confirmed in 14 of 15 retinas studied. The results were largely independent of the level of light adaptation. This is shown in Fig. 7 for measurements made in the same retina spanning an irradiance range of two decades for both the red and green backgrounds. For simplicity, Fig. 7 is restricted to plots of the sum of the response to the leading and trailing edges but plots of complete measurements for the separate responses to leading and trailing edges were similar to those shown in Fig. 6A and 6B. This pattern of results was also found when the red background was increased by a factor of 0.4 log unit above that used in Fig. 6. On the other hand, if the red background was set at much higher or much lower levels, the response waveform did not vary appreciably as the green bar was varied over the complete irradiance range. Thus, in these conditions, when the green bar remained either much more or much less intense than the red background, all the responses were apparently due to luminance contrast and thus no unequivocal evidence for color contrast could be identified.
Relation of the responses to luminance contrast (open circles) and color contrast (filled circles) remains largely invariant on six levels of background irradiance from 0.20 to 2.20 log μW/cm2. Responses are the sum of the peak amplitudes evoked by the leading and trailing edge of a green bar on a green background (G on G) and on a red background (G on R). The summed responses on the background of 0.84 log μW/cm2 are the same as those plotted in Fig. 6.

Discussion
Properties, significance, and sources of the PNR in zebrafish retina
This report identifies the PNR as a prominent local field potential in the inner retina of zebrafish. The polarity and waveform are consistent with what would be expected for an extracellular field potential arising primarily from the depolarizing ON/OFF amacrine and ON/OFF ganglion cells found via intracellular recording in the inner retina of many vertebrates (Miller, Reference Miller, Schmidt and Worden1979, Reference Miller2008; Dowling, Reference Dowling1987; Burkhardt & Fahey, Reference Burkhardt and Fahey1999; Wu, Reference Wu2010; Zhang & Wu, Reference Zhang and Wu2010). However, the inner plexiform layer of the inner retina is a highly complex neuropil (Grimes, Reference Grimes2012), known to contain 5–11 morphological types of amacrine and ganglion cells, as well as axon terminals of bipolar cells (Mangrum et al., Reference Mangrum, Dowling and Cohen2002; Connaughton et al., Reference Connaughton, Graham and Nelson2004; Connaughton, Reference Connaughton2011). Thus, the relative contributions of the various cell types in the inner retina to the generation of the PNR remain to be determined. On the other hand, the findings of the present report show unequivocally that the PNR provides a very sensitive and highly local index of signal processing in the inner retina. Although not studied quantitatively, an intimate relation to excitatory pathways of the retina was further evident from the observation that the nerve impulse discharge of ON-OFF neurons are correlated with the peak of the ON and OFF waves of the zebrafish PNR. Although the amplitude of the impulses was of too small for quantitative analysis, the correlation was consistently seen online and heard very clearly with high pass filtering over an audio monitor. In the frog, it was possible to study the correlation quantitatively, thereby showing that the strength of the impulse discharge of single ON-OFF neurons was linearly related to the amplitude of the PNR (Burkhardt & Whittle, Reference Burkhardt and Whittle1973). In larval zebrafish, about 65% of ganglion cells are of the ON-OFF type (Emran et al., Reference Emran, Rihel, Adolph, Woong, Kraves and Dowling2007).
The spatial properties of the PNR are characteristic and striking, raising the question of how they might arise. The marked attenuation of the response by stimuli of large diameter is probably the consequence, at least in part, of the covert and overt center-surround antagonism found in intracellular recordings from ON-OFF amacrine and ganglion cells (Burkhardt & Fahey, Reference Burkhardt and Fahey1999; Zhang & Wu, Reference Zhang and Wu2010). The surround antagonism and acute position dependency of the PNR (Fig. 2) may also be shaped by current cancellation due to extracellular laterally oriented sinks and sources since, as is the general case for vertebrate retinas, the dendrites of amacrine and ganglion cells in zebrafish have a predominant lateral orientation (Mangrum et al., Reference Mangrum, Dowling and Cohen2002; Connaughton et al., Reference Connaughton, Graham and Nelson2004).
Utility of the PNR versus the ERG for studies in zebrafish
Because the neurons in the zebrafish retina are so small, satisfactory intracellular recordings from bipolar, amacrine, and ganglion cells seem largely beyond reach. To date, studies of the light-evoked response of the zebrafish retina have relied almost entirely on recordings of the ERG, obtained by a gross electrode placed on the cornea of the intact eye. The corneal ERG is largely accepted as arising primarily from bipolar cells of the outer retina (Wong et al., Reference Wong, Gray, Hayward, Adolph and Dowling2004; Nelson & Singla, Reference Nelson and Singla2009) but is a spatially diffuse mass response, which, in practice, requires illumination of the entire retina. By contrast, the PNR provides an index of neuronal activity in the inner retina that is highly localized and best evoked by small critically positioned spots of light that will first evoke local activation in the distal retinal network.
The required techniques to record the PNR are more tractable and productive than for intracellular recording but considerably more difficult than that for recording the corneal ERG from the intact eye. Although the eye is very small, the retina can be accessed via the microsurgical procedures developed by Nelson and Singla (Reference Nelson and Singla2009) and elaborated in the present report. Ringers-filled electrodes of modest tip size (ca. 3 μm) are sufficient. Once conditions are optimized, the PNR remains stable and thus amenable to quantitative studies (Figs. 4–7). On the other hand, precise control of the light stimulus and electrode depth is critical (Figs. 1 and 2). Otherwise, the PNR may be confused and confounded with the intraretinal ERG.
The PNR has been found in a wide variety of vertebrates including fish, amphibians, reptiles, birds, and primates (Burkhardt, Reference Burkhardt1970; Holden, Reference Holden1972; Ogden, Reference Ogden1973; Burkhardt & Mooney, Reference Burkhardt and Mooney1977; Gustafson et al., Reference Gustafson, Stevens, Wolosker and Miller2006) and in unpublished work in rabbit (R.F. Miller and D.A. Burkhardt) and mouse (R.F. Miller). In sum, the PNR of zebrafish described in this paper exhibits the defining properties common to many other vertebrates, reinforcing the view that zebrafish may serve as a model for retinal function and that the PNR may provide a new approach for studies of development, genetics, and retinal degeneration in zebrafish.
The encoding of luminance contrast
Figs. 3 and 4 show that the PNR gives vigorous responses to steps of luminance contrast of centered spots of white light. In recordings from more than 30 light-adapted retinas, the on-response to negative contrast was, without exception, strikingly more sensitive and of larger maximum amplitude than the response to positive contrast. This “negative contrast dominance” was not known previously in vertebrates since the PNR had not been studied with negative contrast steps heretofore. It is well known that the neurons of the inner retina receive primary input from ON and OFF bipolar cells (Miller, Reference Miller, Schmidt and Worden1979, Reference Miller2008; Dowling, Reference Dowling1987; Nelson & Kolb, Reference Nelson, Kolb, Chalupa and Werner2004; Wu, Reference Wu2010). Thus, it is likely that negative contrast dominance occurs because the input from OFF bipolar cells to the zebrafish PNR is stronger than that from ON bipolar cells. The present results show that negative contrast dominance becomes stronger with the level of background illumination. In turtle cones, the ON-response to negative contrast becomes progressively larger than that to positive contrast on higher levels of background illumination (Burkhardt, Reference Burkhardt1994). A similar effect in cones and OFF bipolar cells may underlie the enhancement of negative contrast in the zebrafish PNR. For positive contrast steps, the OFF-response was considerably larger than the ON-response (Figs. 3 and 4). This is assumed to reflect a large and dominant overshoot in OFF bipolar cells.
Color contrast versus luminance contrast
The response to a moving green bar on a green background (Fig. 6A) was in striking agreement with that found for the response to luminance contrast evoked by flashes of white light (Fig. 4). In Figs. 5A and 6A, a null response, corresponding to zero contrast, was found at an intermediate level of irradiance of the green bar. On the other hand, a null response was not found for the green bar on a red background (Figs. 5B and 6B). Thus, over an intermediate range of identical irradiances, the response to green on red was significantly different than the response to green on green (Figs. 6 and 7). This is taken as strong evidence that red/green color contrast is encoded in the zebrafish retina and expressed at the level of the PNR. On the other hand, at much higher and lower stimulus irradiances, the responses to green on red and green on green were virtually identical. It follows that both achromatic and chromatic systems contribute to the PNR. When the luminance contrast is low over an intermediate range of irradiance, the chromatic input is significant. On the other hand, when the stimulus irradiance levels are more extreme in either direction, the achromatic system seems to wholly dominate the response, perhaps by suppressing or inhibiting the chromatic input.
In nature, most colored objects differ in variable degree from their backgrounds in both luminance and color. Thus, there is a continuum of luminance contrast relative to color contrast across the population of colored objects. To discriminate objects from backgrounds in cases where the luminance contrasts are high, there may be little functional need or added value for color contrast. On the other hand, when luminance contrast is low, as is common in nature (Burkhardt et al., Reference Burkhardt, Fahey and Sikora2006), color contrast may be critical. The findings in the present report (Figs. 5 and 6) complement this view. They also complement Kirschmann’s third law of color contrast, proposed more than a century ago for human vision (Kirschmann, Reference Kirschmann1891; Boring, Reference Boring1942; Alpern, Reference Alpern1964; Gordon & Shapley, Reference Gordon and Shapley2006), which holds that “color contrast is best observed when contrast in brightness is lacking or minimum” (Berliner, Reference Berliner1949). The present evidence for color contrast in zebrafish also resonates with the insightful suggestion of Walls (Reference Walls1963) that color contrast for object detection may have been the driving force for the evolution of color vision in lower vertebrates.
Acknowledgments
I thank Ralph Nelson for advice on surgical methods and Robert F. Miller for insightful discussions and permission to cite his unpublished observations on the rabbit and mouse PNR.