

Far from being a merely esoteric topic animating academic exchanges, inequality has become the focal point of intense policy debates in recent years. While most of the controversy has concerned the income and wealth discrepancies among individuals and related questions of redistribution,Footnote 1 there is a growing realization that inequality between ethnic groups is at least as important. Such between-group or “horizontal” differentials constitute special cases of the more general concept of “categorical” inequalities.Footnote 2 Recent research shows that ethnic inequality is associated with various deleterious outcomes, such as democratic breakdown, bad governance, deficient public goods provision, as well as ethnic civil war.Footnote 3
As the consequences of ethnic inequality begin to become clearer, we still know very little about what drives it in the first place. Some of the existing empirical literature identifies static factors such as geographic endowments or long-lasting historical legacies as important determinants of intergroup disparities.Footnote 4 Others, however, argue that inequality between groups is the result of political favoritism along ethnic lines, where powerful groups and elites channel the state's resources toward their constituencies.Footnote 5 Most of this literature assumes that discrepancies between politically included and excluded groups are constant, even calling them an “axiom of politics.”Footnote 6 Rather than accepting this claim as an assumption, we examine whether and why economic inequality between included and excluded groups changes dynamically over time.
We argue that changing patterns of ethno-economic inequality are the result of two interrelated mechanisms. First, increasing integration into the global economy has the potential to produce significant welfare gains in most countries. However, ethnic elites in control of the national government influence how gains from trade arising from increasing economic globalization are distributed. These gains could be directed to poor and politically marginalized ethnic regions in an effort to reduce economic disparities between groups, or they could be channeled toward the incumbent ethnopolitical elite, thus reinforcing inequality. Which of these strategies prevails, however, depends on a second mechanism: the strength of domestic institutions.Footnote 7 Strong state institutions feature infrastructural power to widely distribute gains from trade and a meritocratic bureaucracy that prevents elite capture and patronage, making it less likely that powerful groups use the state's resources in favor of their own kin. Taken together, these arguments suggest that the effect of globalization on the gap between included and excluded groups is moderated by domestic institutions. Where institutions are weak and prone to ethnic domination, increasing economic openness does not alter preexisting patterns of ethnic favoritism, thereby depriving politically excluded groups from potential gains from trade. On the contrary, strong state institutions enable politically excluded groups to secure significant gains from economic openness and thus to catch up with their countries’ average levels of productivity.
To test these arguments, we examine the interplay between domestic institutions and economic globalization and its relationship to inequality between included and excluded groups over the past twenty-five years. Using remote-sensed nighttime lights to extract a measure of individual ethnic groups’ economic trajectories since 1992, we provide a systematic trend analysis of inequality between included and excluded groups, and how it is affected by economic globalization. This pattern of dynamic change cannot be explained by static geographic and historical factors or ethnic favoritism alone. It is also unlikely that decreases in inequality are similar across world regions and individual countries. Relying on a conservative fixed-effects estimator, we show that increasing integration into the world economy is robustly correlated with ethnic inequality. However, whether openness to globalization decreases economic differentials between ethnic groups varies across institutional settings as predicted by our theory. We find support for both the infrastructural power and the meritocratic bureaucracy mechanisms, although the former is stronger and more robust.
We proceed by spelling out the theoretical mechanisms that link political exclusion, economic globalization, and institutions to inequality along ethnopolitical lines. We describe how we generate group-level time-series data from night light, and how we analyze these trends in a regression analysis. Finally, we explore our theoretical mechanism in four short case studies before concluding by discussing potential tensions between state-driven economic integration and political equality among ethnic groups.
Explaining Diverging Trends in Ethnic Inequality
Economic globalization, especially in the form of international trade, ranks among the strongest drivers of distributional outcomes.Footnote 8 Rodrik estimates that reducing tariffs leads to distributional effects that exceed gross domestic product (GDP) growth by a factor greater than ten in African developing countries.Footnote 9 According to globalization skeptics, global markets expose particularly poor and vulnerable segments of the world population to economic fluctuations as social safety nets and regulatory standards yield to the need of keeping up with international competition.Footnote 10 In contrast, globalization optimists argue that trade liberalization benefits export-oriented firms and their poor workers in labor-abundant developing countries and translates into decreasing individual inequality.Footnote 11 Since the vast majority of the global labor force resides in the developing world, global inequality decreases as workers in China, India, and other emerging markets join the global middle class.Footnote 12
Yet the debate between globalization skeptics and enthusiasts overlooks an important mediating variable: political institutions. According to Rodrik, domestic “conflict-management institutions” mediate the redistributive effects of trade openness.Footnote 13 We apply Rodrik's general intuition about distributional conflict between “social groups” to multi-ethnic societies that are vulnerable to the political and economic domination of elites from only one or few ethnic groups.Footnote 14 Variation in institutional strength goes a long way toward explaining the distributional effects of trade openness on inequality between ethnopolitical insiders and outsiders. This view builds on prominent theories of economic growth as well as more specific qualitative studies on how political and institutional forces shape the effects of trade liberalization in developing countries.Footnote 15
The distinction between ethnopolitical insiders and outsiders is key in examining globalization effects potentially moderated by state institutions. If institutions matter, distributional outcomes are no longer a function of factor endowments, relative prices, and comparative advantage.Footnote 16 Instead, the institutional “rules of the game” determine whether there is broad and equitable access to economic opportunities or whether a narrow political and economic elite monopolizes most gains.Footnote 17 While economic “inclusiveness” and the threat of elite capture are central pillars in the recent institutionalist literature,Footnote 18 few studies identify the political and economic elite groups that are in a position to grab disproportionate shares of the economic pie. Studying societies with politically salient ethnic cleavages and unequal access to central state power provides an opportunity to focus on the type of inequality most relevant for analyzing institutional effects—inequality between elite groups and their politically marginalized counterparts.
To understand how state institutions shape the distributional effects of economic globalization across ethnic groups, we first need to identify the most relevant aspects of institutional strength. The political economy literature highlights a whole bundle of growth-enhancing economic and political institutions ranging from fiscal capacity, secure property rights and impartial contract enforcement to civil liberties, equal access to education, and constraints on political elites and rent-seeking coalitions.Footnote 19 Based on this literature, we highlight two central dimensions of institutional strength that may plausibly affect distributional consequences of trade liberalization in multiethnic societies through their impact on the state's ability and political elites’ willingness to broadly distribute economic gains respectively.
The first component, infrastructural power refers to the state's ability to project its basic functions across the entirety of its territory and population. Where infrastructural power is low, economic gains will not reach peripheral and marginalized ethnic settlement areas. In such situations, even the most well-intentioned state agents are unable to effectively practice redistribution or invest in large-scale development programs. In highly capable states, however, political elites may be able but unwilling to prevent rampant rent-seeking and favoritism. Therefore, we highlight meritocratic bureaucracy as the second dimension of institutional strength that provides state agents with the right set of norms and incentives to promote widely shared development. In what follows, we outline what these two dimensions entail and how they matter for the economic fates of politically included and excluded groups during periods of rising economic openness.
Infrastructural Power
Only where the state and its bureaucratic agents are physically present and able to project unequivocal authority can they engage in its basic functions such as census taking, tax collection, public goods provision, and the enforcement of property rights that allow local populations to gain from trade. According to Mann, infrastructural power refers to “institutional capacity of a central state … to penetrate its territories and logistically implement decisions.”Footnote 20
While developed countries tend to be relatively uniformly governed across their territories and populations, in today's developing world, the state often fails to fully extend its reach into the home regions of politically unrepresented ethnic minorities populating what is, at least nominally, state territory.Footnote 21 This may be because of a lack of resources, logistical challenges, or evasion and backlash by local strongmen and communities in the state's periphery.Footnote 22
The implications for peripheral regions’ ability to benefit from international trade are clear. Broad-based provision of public goods, such as education, physical infrastructure, and contract enforcement, enables politically underrepresented parts of the population to benefit from international trade and capital flows. Standard economic models predict that these investments will yield the highest returns in the least developed parts of an economy.Footnote 23 Because group-based political and economic marginalization tend to overlap, politically marginalized groups will enjoy the greatest advantage from public goods and thus be able to catch up with wealthier groups. Where the state's monopoly of violence is contested, or where it lacks the administrative capacity to provide physical infrastructure, public goods, and economic security, local populations are unlikely to gain—no matter how intensively the economic core engages in international trade.
This problem can be expected to apply in particular to groups that are politically marginalized. The state's executive elite lacks the networks into and information about excluded groups that would be needed to adequately govern and respond to group-specific needs. Limited control over, and legitimacy among, excluded parts of the population confront those in power with what Migdal has dubbed “the ruler's dilemma.”Footnote 24 Any attempt to build capacity and develop weakly controlled subsets of a country's territory and society risks propping up alternative power centers with dubious loyalty to the central state. Leaders at the helm of infrastructurally weak states are frequently forced to eschew such investments because they may, ultimately, threaten their political survival.
A lack of fiscal capacity at the center further exacerbates the problem, since it reduces state elites’ incentives to extend trading opportunities to peripheral, ethnically distinct regions with limited state penetration. Broad-based economic growth is of little use to rulers if they cannot tax it, and infrastructurally weak states find it even harder to extract taxes from politically excluded ethnic groups than from the rest of society.Footnote 25 Based on this reasoning, we derive a first hypothesis:
H1 Increasing trade openness reduces the income gap between politically excluded and included groups in states with high levels of infrastructural power.
Meritocratic Bureaucracy
Drawing on Weber's ideal type of the “rational-legal state,” the second dimension of state strength refers to state institutions administered by a rule-bound bureaucracy whose members are recruited and promoted on the basis of meritocratic principles rather than loyalty or personal connections.Footnote 26 This dimension encompasses formal institutional constraints on government leaders and high-ranking bureacurats by, for example, strong and independent judiciaries.Footnote 27 In addition, it includes informal norms that foster state agents’ performance, professionalism, and impartiality. The institutional characteristics of meritocracy therefore limit leaders’ and bureacrats’ incentives to extract rents to the detriment of powerless groups.Footnote 28
States with independent and meritocratic bureaucracies are in a good position to check elites’ attempts to channel the gains from trade into their own pockets and to distribute club goods that benefit primarily their co-ethnics, instead of investing in public goods and market-supporting policies. Moreover, competitive recruitment into the bureaucracy differs from nepotistic hiring in weakly institutionalized states because it limits the growth of rent-seeking coalitions, undermines preexisting patron-client relationships, and socializes state officials into a culture of professionalism and efficiency.Footnote 29 As a result, political and bureaucratic elites face incentives to implement far-ranging development programs. Since both the availability of rents and the social acceptability of grabbing them are reduced, economic performance, tax revenues, as well as merit-based promotions within the state apparatus become the dominant avenues to further one's wealth and status. In short, meritocratic rules and norms align individual state agents’ self-interest with the broader goals of effective governance and broad-based economic development.
In contrast, state administrations without such professionalism enable ethnic clientelism, which in turn accounts for large or even increasing inequalities between the ethnic insiders and outsiders of patronage networks.Footnote 30 The absence of meritocratic rules and norms within the state bureaucracy makes excluded groups vulnerable to exploitation. Unchecked elites can benefit from increasing trade openness by granting import and export licences in return for bribes by manipulating the price of commodities via the control of marketing boards, by profiting from taxes on import and export goods, and even by creating trade monopolies that benefit their supporters.Footnote 31 Indeed, where bureaucratic rules and practices do not effectively prohibit such strategies, elites typically reward co-ethnics with public sector appointments, lucrative development contracts, and the disproportionate allocation of state funds to their home region.Footnote 32
Beyond the direct benefits that accrue to co-ethnic supporters, preferential recruitment into public sector jobs sets in motion a vicious circle that rewards political allegiance rather than individual merit.Footnote 33 Where economic policies and public investment follow the logic of political survival rather than economic productivity, resource allocation becomes inefficient to the point of decreasing economic output. The diminishing economic pie then reinforces rent-seeking even further. Under such conditions, international trade neither yields widely shared welfare gains nor reduces rent-seeking through the state apparatus as many proponents of liberalization have hoped.Footnote 34 Quite the opposite, trade policy tends to create “new rent havens” and “solidify domestic political alliances,” as Boone concludes from her analysis of liberalization policies in Senegal and Côte d'Ivoire.Footnote 35
Beyond these indirect effects, meritocratic bureaucracies can actively shape the massive changes that follow from trade openness.Footnote 36 If political considerations play a role, it is not to reward co-ethnic loyalists but to address potential inequities associated with economic reform in the spirit of Rodrik's “conflict-management institutions.”Footnote 37 In this respect too, administrative professionalism serves as a precondition of tax and investment policies to compensate globalization losers. For example, in Malaysia, government intervention as a part of the country's development strategy has decreased ethnic inequality considerably.Footnote 38 Similarly, the Vietnamese government runs programs specifically designed to boost development in ethnic-minority regions.Footnote 39 Such economic policymaking does not need to reflect egalitarian principles or accountability toward marginalized groups. Instead, local and central bureaucrats foster their status within the state apparatus, buy acquiescence to unequal political representation, and push through the central state's vision of economic development in marginalized ethnic settlement areas. We summarize our theoretical expectations in a second hypothesis:
H2 Increasing trade openness reduces the income gap between politically excluded and included groups in states with meritocratic bureaucracies.
Data and Operationalization
Estimating trends in horizontal inequality represents a formidable measurement challenge. Traditional data sources such as surveys are usually designed to capture trends in economic development at the national level, but not at the level of ethnic groups. In those cases where survey-based group-level estimates are available, they cover only few selected years. Since we require continuous group-level measurements over time to capture changes in the relative economic status of groups, we resort to estimation using spatial data, as existing research has done.Footnote 40 This procedure relies on two kinds of data: (1) a data set on ethnic groups and their settlement regions, which is combined with (2) satellite-based data on night light emissions to identify wealthy regions. Using these data, we calculate annual estimates of group wealth, which serve as the main outcome measure in the analysis.
Measuring Group-level Development Using Spatial Data
Our analysis uses a global sample of politically relevant ethnic groups provided by the 2014 version of the Ethnic Power Relations (EPR) project.Footnote 41 Ethnic groups are considered politically relevant when group members make claims on behalf of the group in the national political arena, or when the state discriminates against the group politically, for example, by denying voting rights to members of that group. Conversely, social and economic discrimination alone do not warrant inclusion into the sample. For each ethnic group, EPR codes the political power status between 1946 and 2013. Most importantly, it distinguishes “included” from “excluded” groups by assessing meaningful access to positions of executive power in the central government, which can change over time.Footnote 42
To estimate EPR groups’ economic trajectories, we combine data on night light emissions with information on ethnic settlement regions from the GeoEPR data.Footnote 43 For each EPR group, GeoEPR provides an approximation of the group's settlement region in an electronic format suitable for processing in a Geographic Information System (GIS). Group regions are given as vector polygons, where each polygon indicates the primary settlement area of that group. These polygons are time variant, since settlement regions can change as a result of mass migration, forced resettlement, or modification of country borders.
In a second step, we overlay these ethnic regions with global maps of night light emissions data. Light emissions have been shown to proxy economic development well, specifically in the many less-developed countries in our sample that have unreliable official statistics.Footnote 44 Equally relevant for us is that night light emissions can be used not only at the national level but also to track subnational variation in economic outcomes.Footnote 45 Investigating the source of horizontal inequality, De Luca and colleagues rely on changes in total night light emissions to demonstrate that a political leader's co-ethnics profit disproportionately from their putative cousin's rule.Footnote 46
The work discussed here demonstrates that remote-sensing data can complement, and even improve on, alternative sources of ethnic inequality measures such as surveys. Therefore, we base our analysis entirely on night lights and compute annual estimates at the level of ethnic groups. More precisely, our method relies on time-series data of night light emissions from the Defense Meteorological Satellite Program's Operational Linescan System (DMSP-OLS), provided by the US National Oceanic and Atmospheric Administration. The data come as annual rasters with a resolution of thirty arc seconds, which corresponds to approximately one kilometer. We use the “stable lights” version of the data, which removes nonstable light sources such as forest fires.Footnote 47 For each raster point, the data set encodes the level of radiation with a value between 0 and 63. Night lights imagery is available starting in 1992, which is why we limit our analysis to the years between 1992 and 2012.
Using the GeoEPR settlement regions we described, we compute the sum of the night lights emitted from each ethnic region.Footnote 48 This calculation is performed annually for each group to capture variation in luminosity over time as well as changes in the groups’ settlement regions. To disentangle changes in luminosity caused by population growth from those resulting from increased economic activity, we compute per capita estimates of group income. To this end, we estimate local group populations by overlaying ethnic settlement areas with disaggregated population data from the Global Rural-Urban Mapping Project's population density data set.Footnote 49 Unfortunately, these population estimates are available for only 1990, 2000, and 2010, which is why we linearly interpolate missing years.
Using our group-level measure of development, Figure A1 in the appendix shows the global trend in economic inequality between ethnopolitical insiders and outsiders over time. There is a gradual, but clearly discernible decrease in inequality in our sample of 398 ethnic groups in 120 states between 1992 and 2012.Footnote 50 This provides evidence for our main motivation in this paper. Inequality between included and excluded groups is clearly not constant over time, which raises the question of how to explain its dynamic evolution.
Explanatory Variables
We measure globalization using the trade openness variable from the World Development Indicators database.Footnote 51 Trade openness is calculated as the share of imports and exports of a country's total annual GDP. Our second explanatory variable captures a group's political status through a dummy variable from the EPR data set indicating if group representatives are excluded from the central government in a given year.Footnote 52
Throughout our observation period, economic globalization was on the rise. The average trade-to-GDP ratio in our sample increased by 36.6 percent from about 0.59 in 1992 to 0.81 in 2012. This trend was driven by relatively parallel growth rates across world regions, suggesting that rising trade openness similarly affected most countries, regardless of institutional or economic structure.Footnote 53 Turning to political exclusion, there was a global trend toward more ethnically inclusive government coalitions with especially fast progress in Africa.Footnote 54 The significant temporal changes in political exclusion raise the question whether political power is a consequence rather than a cause of group-level development. Trends in group-level luminosity may be at least partially explained by the selective inclusion of groups with particularly high potential for economic growth. We address this potential issue of reverse causation in the empirical section.
We use two proxies to operationalize our theoretical notion of institutional strength. These indicators mirror the dimensions of infrastructural power and meritocratic bureaucracy discussed earlier. First, we rely on the state antiquity index to capture the macro-historical origins and long-term persistence of effective state institutions.Footnote 55 The basic intuition is that today's states’ infrastructural power only gradually changes over time and is, to a large extent, historically inherited.Footnote 56 Like Mann in his definition of infrastructural power, Borcan and colleagues explicitly link state age to similar aspects of institutional capacity: “accumulated state history favors capacity building, taxation and the provision of public goods.”Footnote 57 More specifically, the state antiquity index codes the degree of centralized statehood on the territory of current-day states for the 110 half centuries between 3500 BCE and 1950 CE. Any form of government beyond the tribal level contributes to these statehood scores. The final index is calculated by aggregating all 110 scores and employing a discount rate of 5 percent per half decade.Footnote 58 The variable's credible exogeneity to contemporary political events provides another important reason to choose it over alternative measures such as the tax-to-GDP ratio.
Second, we use the country-year variable “criteria for appointment decisions in the state administration” from the Varieties of Democracy data set (V-Dem) to capture the degree of bureaucratic meritocracy.Footnote 59 The merit-based appointment variable is coded by country experts who assess to what extent “hiring, firing, and promotion in the state administration” are based on “skills and merit” rather than “personal and political connections.”Footnote 60 The V-Dem codebook instructs country experts to assess “the typical de facto (rather than de jure) situation obtaining in the state administration.” As such, the merit-based appointment indicator plausibly entails informal norms and practices that are not reflected in more legalistic measures of judicial independence, executive constraints, or the rule of law. Expert assessments of institutional quality have been criticized as potentially endogenous to recent economic performance.Footnote 61 To ensure that our findings are not a result of perceived, yet artificial and potentially endogenous short-term fluctuations, we use the country-specific pre-period value in 1991 for all country-years between 1992 and 2012.Footnote 62
Although we estimate a conservative set of fixed effects specifications, we cannot exclude the possibility that time-variant factors correlate with changes in countries’ trade openness and at the same time affect differential growth rates between politically excluded and included groups. To account for this possibility, we also run models that add a number of important control variables such as gdp per capita, resource rents per capita, export concentration, the agricultural share of gdp, political institutions, ethnic groups’ conflict incidence, and ethnic group size. Where appropriate we interact these variables with political exclusion and/or trade openness. We detail these variables and explain their relevance in our online appendix. Table A1 in the online appendix presents summary statistics of the main variables used in this study.
Empirical Strategy
Testing our hypotheses requires an analysis of (1) how variation in a country's trade openness over time affects group-level night lights, (2) how this effect differs between politically excluded and included groups, and (3) how the difference between excluded and included groups varies between countries with different levels of institutional quality. Thus, we need to interact variables across levels because our multilevel data structure nests groups in countries in years. Specifically, we are interested in how changes in a country-level variable (trade openness) affect changes in a group-level outcome (night light emissions), conditional on group (political status) and country-level (institutional quality) factors.
To accurately assess the effects of these cross-level interactions, we run linear models with a triple interaction along with ethnic group and country-year fixed effects. The interactions test for the heterogeneous effects we stipulated while the fixed effects account for time-invariant omitted variables at the group level and temporal shocks at the country level. Additionally, country-year fixed effects ensure that all estimates are based on group-level deviations in per capita luminosity from the country-year average. Using an indicator variable for excluded political groups allows us to interpret the estimated effects as changes in the income gap between excluded and included groups, as the average included group forms the base category in each country-year.Footnote 63 Our baseline regression specification thus takes the following general form:
 $$\eqalign{&\displaylines{\!\!\!\!\!\!\!\!\!\!\!\!\!\!\!\!\!\!\!\!\!\!\! log( y_{ict}) = \beta _1{\rm \smallcaps OPENNESS}_{ct} \times {\rm \smallcaps EXCLUDED}_{ict}} \cr & {+ \beta _2{\rm \smallcaps OPENNESS}_{ct} \times {\rm \smallcaps EXCLUDED}_{ict} \times \overline {{\rm \smallcaps STATE\ CAPACITY}_c}} \cr &+ \beta _3{\rm \smallcaps EXCLUDED}_{ict} \times \overline {{\rm \smallcaps STATE\ CAPACITY}_c} + \beta _4{\rm \smallcaps EXCLUDED}_{ict} \cr &+ \beta _kc_k + \mu _i + \rho _{ct} + {\rm \epsilon }_{ict}}} $$
The outcome variable y is the logarithm of per capita night lights in group i's settlement area nested in country c at time t.Footnote 64 The parameters μ i and ρ ct capture group and country-year fixed effects respectively, while ε ict is the error term. We use ethnic group fixed effects (μ i) to avoid bias from unobserved non-time-varying factors at the level of individual ethnic groups and the countries they are situated in. Thus, we ensure that the estimated effects of trade openness on group-level luminosity are not merely artifacts of time-invariant omitted variables such as a group's population share, its more or less favorable geographic location, its deep-rooted cultural heritage, or country-specific trajectories of interethnic relations prior to our period of observation. Country-year fixed effects (ρ ct) account for country-specific temporal shocks, for example, in economic performance, political regime, and similar time-varying country-level variables that may correlate with both night lights and our main independent variables. Because of country-year fixed effects, two constitutive terms and one two-way interaction drop from the model (tradect, state capacityc, and tradect × state capacityc).
Our main focus rests on the cross-level interaction between trade openness, excluded, and state capacity. Based on our theoretical reasoning, we expect the effect of trade openness on excluded groups to vary with institutional strength measured as state history or merit-based appointments. Our hypotheses predict a positive and significant coefficient β 2 on the triple interaction term. We expect relatively faster growth of excluded groups at high levels of institutional quality as trade openness increases. To explore size and significance of the trade openness effect at different levels of institutional strength, we need to combine all constituent effects that include openness. All else equal, a positive sum β 1 + β 2 × a c indicates increasing trade openness to be associated with disproportionate luminosity gains of excluded groups relative to their included counterparts in a country with institutional quality a c.Footnote 65 Conversely, a negative sum at a c indicates that excluded groups would grow slower in response to increasing trade than their included counterparts. Given that excluded groups are generally poorer than included groups, faster growth of excluded groups implies catch-up and reduced inequality.Footnote 66
Multiplicative interaction models potentially suffer two important flaws.Footnote 67 First, conventional models assume that the interaction effect is linear and changes at a constant rate along the range of the moderator, even if the data-generating process is nonlinear. Second, too few observations and little variation in the treatment variable at extreme values of the moderator may result in unreliable and highly model-dependent point estimates as well as artificially low measures of uncertainty. Hainmueller, Mummolo, and Xu propose a simple binning estimator that addresses both issues by estimating the marginal effects of a treatment variable (opennessct × excludedict) at typically low, intermediate, and high values of a continuous moderator (state history or merit-based appointments).Footnote 68 We implement this method and present the results both graphically and in formal tests of whether there are statistically significant differences between marginal effects at low, intermediate, and high values of our institutional moderators.
Results
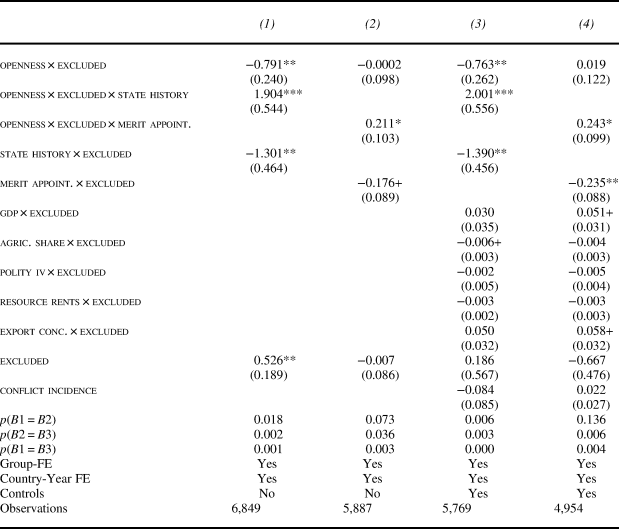
States with high levels of infrastructural power are more capable of widely distributing gains from trade and those with meritocratic bureaucracy will be more likely to withstand attempts of identity-based elite capture. In Table 1 we evaluate the effect of changes in trade openness on the relative growth performance of excluded groups along the two proxies for institutional strength: state history (models 1 and 3) and the merit-based appointments index (models 2 and 4).
Linear model of group-level night lights mechanisms, 1992–2012

Notes: Country-clustered standard errors in parentheses. Significance codes: +p < .10; *p < .05; **p < .01; ***p < .001.
As equation (1) outlined, we estimate a triple interaction term with one dichotomous (excluded groups) and two continuous variables (trade openness and state history/merit-based appointments). The institutional proxies in our base specifications moderate the impact of trade openness on inequality between excluded and included groups in the expected direction. Models 1 and 2 in Table 1 return positive estimates of the triple interaction. Put differently, the marginal effect of trade openness on excluded groups’ night light emissions is significantly larger in states with high levels of infrastructural power (model 1), and larger but with greater uncertainty for meritocracy appointments (model 2). Country-year fixed effects ensure that this marginal effect is estimated relative to the yearly average among politically included groups in the same country. Positive marginal effects thus translate into reduced inequality between excluded and included groups wherever included groups are, on average, richer. Whether the marginal effect of increasing trade openness on excluded groups’ relative growth performance indeed turns positive and significant at observed values of institutional strength cannot be assessed from coefficient estimates alone.
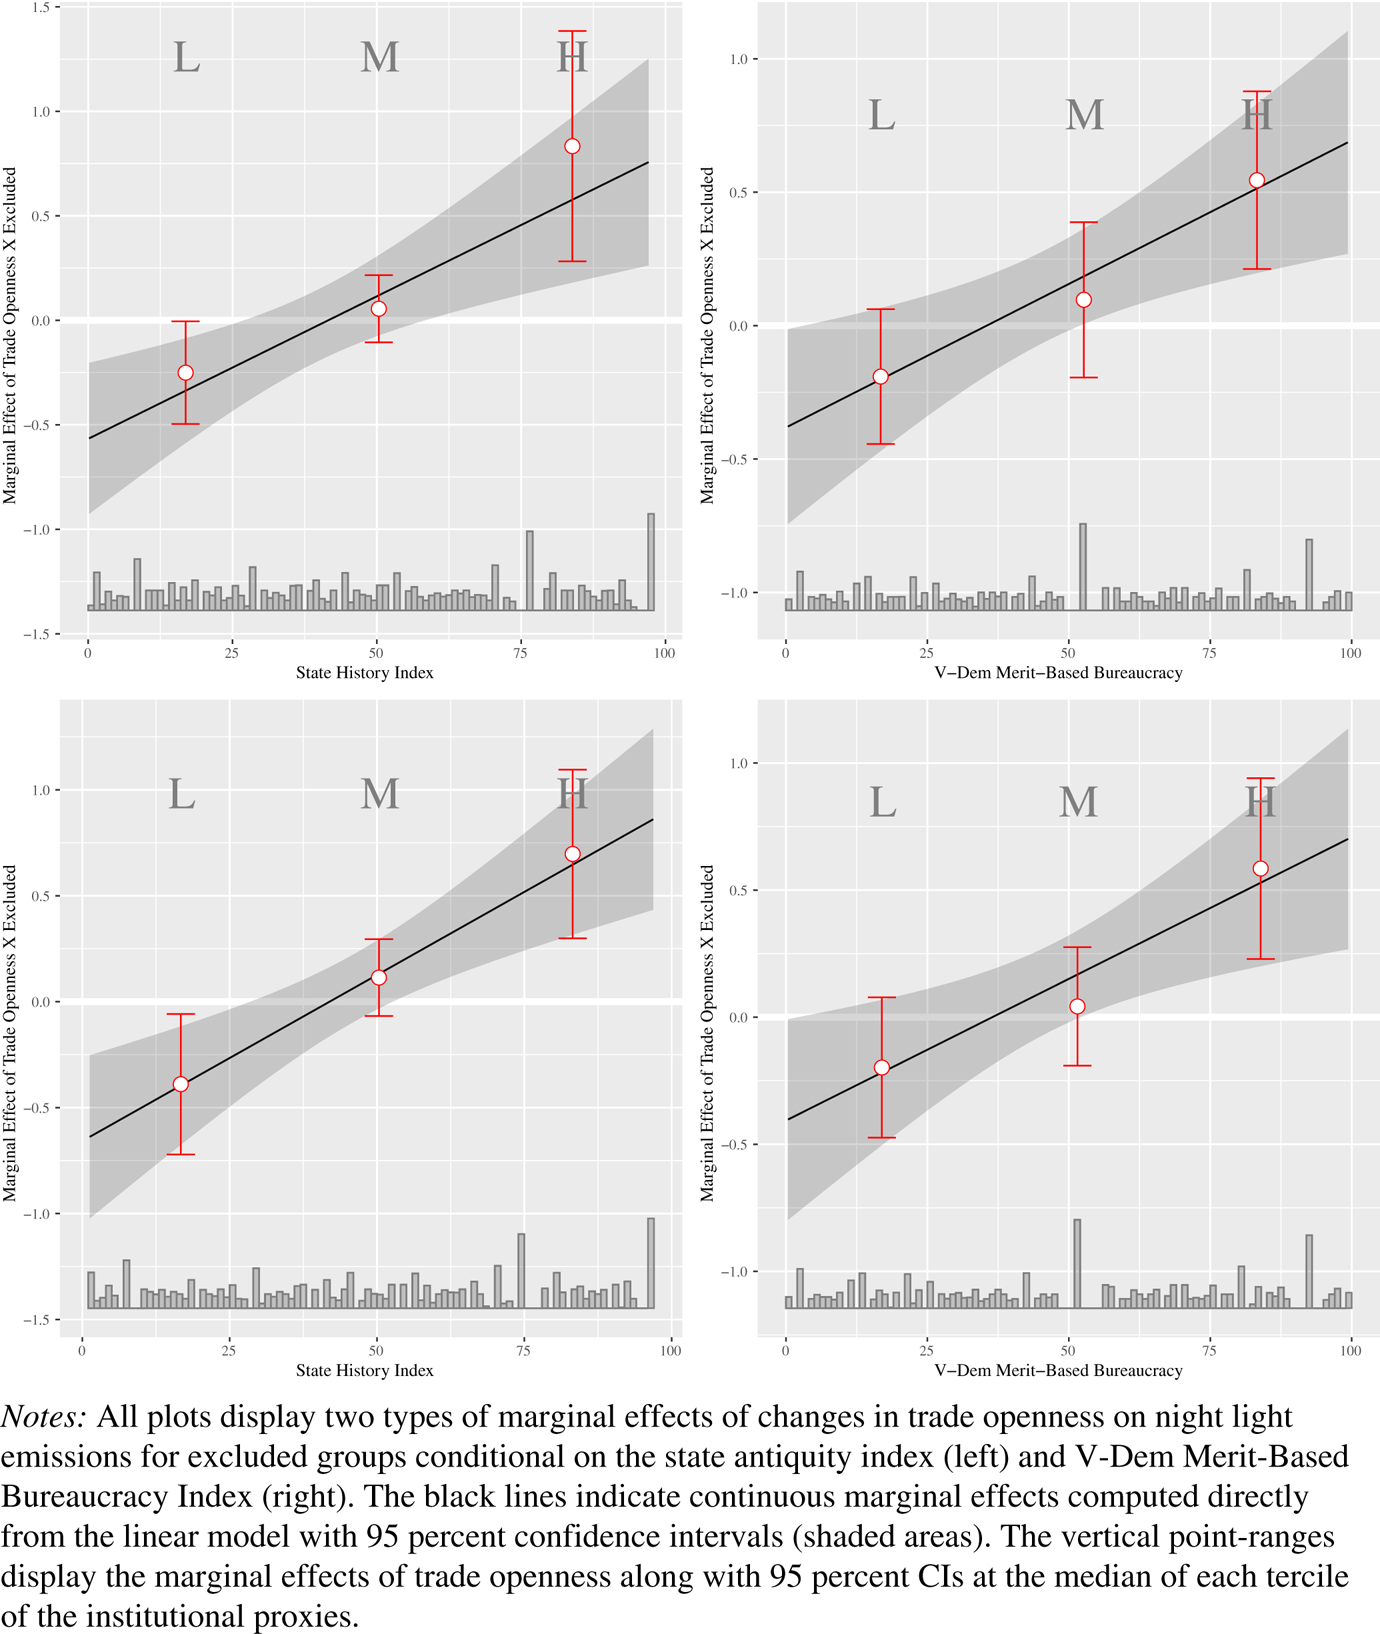
The top row of Figure 1 thus plots marginal effects of changes in trade openness on the relative growth performance of excluded groups (solid line) across the observed percentile range of the two moderators. At low levels of our institutional moderators—where the triple interaction is effectively 0—the marginal effect of trade openness is negative, albeit statistically indistinguishable from zero for merit-based appointments. With increasing values on either institutional indicator, however—and thus greater influence of the triple interaction—the picture changes. At the upper end of the spectrum, the estimated effects become positive and significant.
Marginal effects of interactions in Table 1 from models 1–2 (top) and 3–4 (bottom)

These results are robust to Hainmueller, Mummolo, and Xu's binning estimator. The three vertical point ranges depict the marginal effect of trade openness on relative night light gains for excluded groups at the median of each tercile of our institutional proxies. The point estimates of the binning estimators follow the marginal effect of our linear model almost exactly, and thus reduce concerns about nonlinear effects. The marginal effects at typically high values of infrastructural power and meritocratic bureaucracy are positive, statistically significant, and statistically different from the respective marginal effects at typically low and intermediate values of institutional strength (see the p-values from two-sided Wald tests at the bottom of Table 1).
In substantive terms, an increase in trade openness by one standard deviation of all observed within-country changes (i.e., 17.3 percentage points) in the top tercile of state history (merit-based appointments) translates into a 12.5 percent (10.9%) increase in night light emissions for excluded compared to included groups. This relationship is reversed in the bottom tercile, where the same change in trade openness is associated with a 5.6 percent (0.8%) decrease in luminosity for excluded groups compared to groups with access to the state apparatus. Consistent with our theoretical expectations, increasing trade openness is associated with disproportional luminosity gains by excluded groups and decreasing levels of inequality in states with stronger institutions. Increasing trade widens the gap between included and excluded groups in states with the lowest infrastructural power (left column of Figure 1), but we cannot reject the null hypothesis of constant inequality in states where nepotism dictates hiring practices in the bureaucracy (right column of Figure 1).
Robustness Checks
Establishing causality from the type of broad comparative analyses we pursue here is difficult. One threat to the robustness of our results derives from omitted variables. While our empirical setup is well-suited to minimize bias from unobservables at the group and country-year levels, omitted variables might still affect our results if they co-vary with both changes in trade openness and the average excluded group's economic trajectory. Models 3 and 4 in Table 1 thus include a battery of interactions with control variables.Footnote 69 Most interactions with control variables yield statistically insignificant estimates close to 0, and thus do not exert a meaningful effect on the luminosity gains of excluded groups.Footnote 70 Another concern is that the demographic dominance of the largest ethnic group rather than institutional quality drives our findings. We therefore rerun our baseline models and add an additional triple interaction between trade openness, excluded groups, and the population share of the country's largest group (Table A5 and Figure A7). Doing so slightly weakens our baseline findings, but trade continues to be significantly more beneficial for excluded groups at high rather than low values of both institutional moderators. Additionally, we probe the sensitivity of our results to unobserved heterogeneity through different fixed effects specifications (Tables A2) and by clustering standard errors along country and year (Tables A10–A11). Importantly, neither the inclusion of controls nor alternative modeling strategies affect our main results. Coefficient estimates, standard errors, and marginal effects (bottom row in Figure 1) remain very close to our baseline specifications.
A final concern of unobserved heterogeneity arises from the multilevel interaction of two time-varying factors: excludedict and trade opennessct. Although country-year fixed effects seem to account for time-varying confounders at the country level, the interaction with excludedict allows cross-country variation in trade openness, and thus potentially omitted cross-country confounders that interact with excludedict, to creep in through the back door.Footnote 71 To fully isolate the effect of changes in trade openness and to guard ourselves against this source of omitted variable bias, we demean trade opennessct, and thus split it into a within-country and a between-country term. Reassuringly, we find that our main results are robust to this specification, and that within- rather than between-country changes in trade openness drive the catch-up effects of excluded ethnic groups (Table A4, Figures A5 and A6).
Next to the challenge of omitted variable bias discussed before, we need to consider endogenous ethnic ruling coalitions and other forms of reverse causality. First, political leaders might include those groups that benefit most from trade openness in the government. By selecting economic winners into the ruling coalition, incumbent elites ensure better access to the spoils of increasing economic openness.Footnote 72 Such a policy would undermine our account of redistribution in weak states but would not affect our account of strong regimes where politically excluded groups catch up. Moreover, existing work demonstrates that democratization, and presumably greater ethnic inclusion, preceded the liberalization of trade policies in many developing countries.Footnote 73
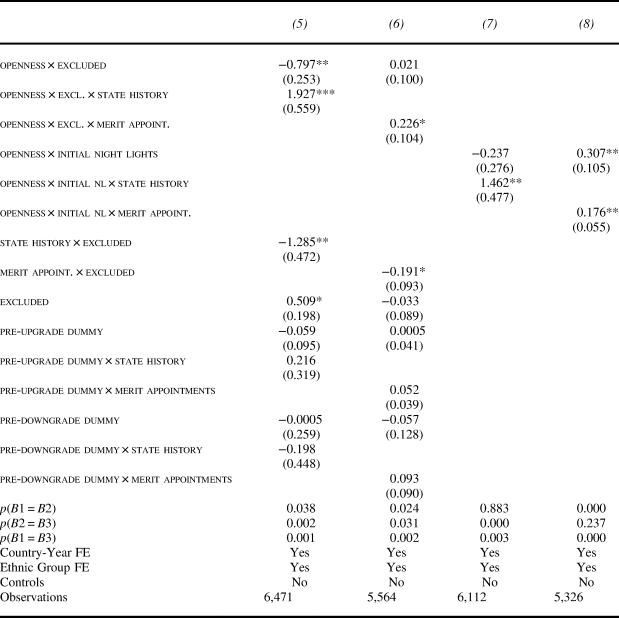
Nevertheless we explore this selection logic. To understand how strategic ethnic coalition formation could undermine our findings, consider a government that invites groups with positive growth in night light emissions into the ruling coalition. Wealthier and faster-growing groups would now be included, and we would observe a widening of the gap between included and excluded groups completely unrelated to the distributive effects of international trade. A similar dynamic would occur if governments strategically exclude groups with low economic growth. We provide a rough test of this logic in models 5 and 6 in Table 2 by including dummy variables that indicate if an ethnic group will be upgraded to or downgraded from the central government in the following year.Footnote 74 If the selection logic operated, the upgrade dummy should be positive, while the downgrade dummy should take a negative sign.
Robustness tests of group-level night lights mechanisms, 1992–2013

Notes: Country-clustered standard errors in parentheses. Significance codes: +p < .10; *p < 0.05; **p < .01; ***p < .001.
Importantly, this process needs to be more common in weakly than in strongly institutionalized states to undermine our finding that inequality between included and excluded groups stays constant or widens in weaker states. If the selection effect operated equally in all states, we would overestimate the effect of trade openness on excluded groups’ nightlights emissions in states with weaker institutions but underestimate it in stronger ones. The strategic inclusion of economically rising groups in strongly institutionalized contexts should exert a downward bias on our finding that excluded groups catch up with included groups as a result of rising trade openness. To test this effect, we interact the pre-upgrade and pre-downgrade dummies with our institutional proxies.
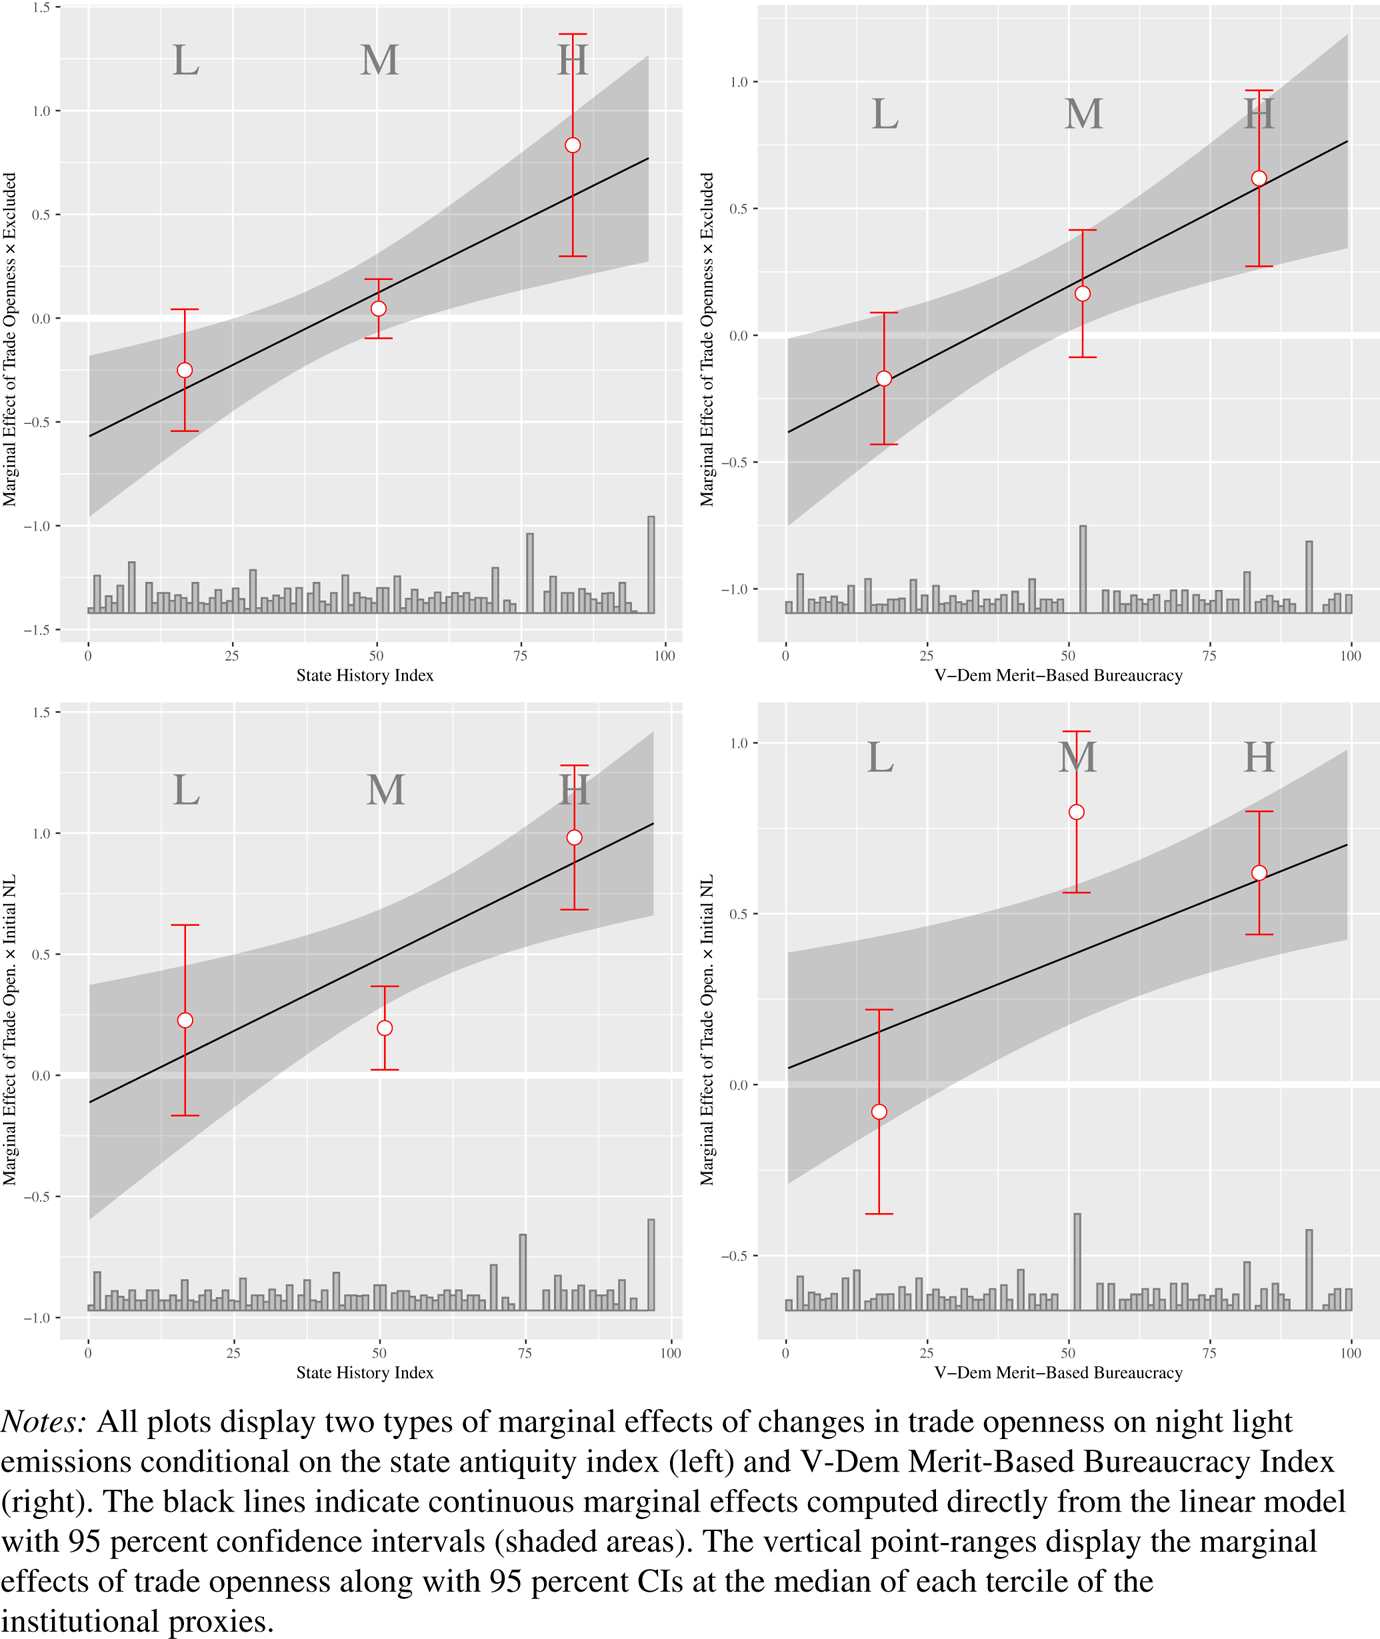
In all models, the coefficients on the dummy variables as well as the interaction terms remain statistically indistinguishable from 0. All coefficients remain substantively small and/or point in the direction that strengthens rather than weakens our interpretation.Footnote 75 In addition, ethnopolitical upgrades and downgrades are extremely rare and occur in less than 1.5 percent of all group years in our sample. Overall, we do not find any evidence for the strategic inclusion or exclusion of groups based on recent economic performance, and the results for changes in trade openness in models 5 and 6 remain practically indistinguishable from our baseline models (see Figure 2, top row).Footnote 76 Of course, pre-upgrade and pre-downgrade dummy terms capture effects of observed past performance rather than expectations about future economic growth. However, we doubt that governments are able to accurately predict growth performance of subnational regions inhabited by ethnically distinct groups.Footnote 77
Marginal effects of interactions in Table 2 from models 5–6 (top) and 7–8 (bottom)

While these results are encouraging, it is still possible that political elites strategically select their coalition partners, and that this selection is a function of the groups’ economic performance and potential to benefit from trade. To rule out that our results are driven by this mechanism, we drop information on the political status of groups entirely and replace it with their night light emissions in 1992.Footnote 78 Rather than estimating the differences between excluded and included groups, we investigate the relative changes in group-level night light emissions between initially poorer and wealthier groups in response to changes in trade openness at different levels of institutional strength.
Models 7 and 8 in Table 2 again display positive and statistically significant triple interactions suggesting that trade benefits poorer groups in states with high infrastructural power or meritocratic bureaucracies.Footnote 79 As the bottom-left panel row in Figure 2 shows, poorer groups grow relatively faster as trade openness increases but only in countries with a long history of statehood or medium to high scores of bureacuratic meritocracy. These findings rule out alternative accounts based on endogenous ethnic coalition building yet do not directly investigate the distributional effects between ethno-political insiders and outsiders as stipulated in our theoretical argument.
Other forms of reverse causality are possible. Rapacious political elites might enrich themselves and their coethnics, and while doing so, weaken or override existing institutions. Although it is plausible that elites craft or destroy institutions at times,Footnote 80 we disagree with the extreme view that political elites can ignore institutions regardless of their initial strength. In contrast, our argument stipulates that only institutions that are weak to begin with are vulnerable to elite capture. We ground our argument in historical institutionalist work that traces the origin of institutions to elite bargains at critical junctures but identifies institutional constraints on elite action after the critical juncture.Footnote 81 One of our measures of state strength, the state history index, predates current developments and makes short-term changes running from ethnic inequality to bad institutions less plausible. As far as the more contemporary measure of merit-based appointments in the state administration is concerned, our results remain robust to using the period mean instead of initial values (Table A7, model 4). Finally, both institutional interactions remain significant if included in the same model making it unlikely that they capture the same underlying dimension of institutional strength (Table A7, model 3).
Another concern of reverse causality arises from political elites who anticipate the distributional effects of trade openness. These elites could fine-tune the degree of openness to benefit themselves and their followers.Footnote 82 For example, political leaders representing industrial interests may close off their economy to shield their allies from global competition while hurting domestic farmers and their representatives who would benefit from closer integration into the world economy.Footnote 83 However, this argument does not explain why members of excluded ethnic groups, who have no say over political decisions, would ever benefit from increasing integration into the world economy.
To probe the temporal dynamics in our models, we estimate autoregressive distributed lag (ADL) models which include contemporaneous and lagged indicators of the explanatory and the lagged outcome variable.Footnote 84 We find limited support for including lagged explanatory variables but evidence for serial correlation. Adding a lagged dependent variable does not change the results of the state antiquity model but slightly lowers our confidence in the meritocratic bureaucracy specification (Table A8, Figure A12). Nonetheless, the difference between marginal effects at typically high versus typically low values of the merit-based appointments variable remain significant at the 5 percent interval. Yet, because our models also include group fixed effects, this introduces bias as a result of the fact that both the LDV and the error term at time t depend on the error term at t − 1.Footnote 85 Although this bias is likely to be small since our data cover more than twenty years for most groups,Footnote 86 we cannot exclude the possibility that this bias drives the lower confidence in the meritocratic bureaucracy models. These temporal specifications allow us to estimate the period over which increasing trade openness affects the gap between excluded and included groups. Just more than half of the effect occurs instantaneously, while most of the remaining part unfolds over the next four years.
Illustrative Case Examples
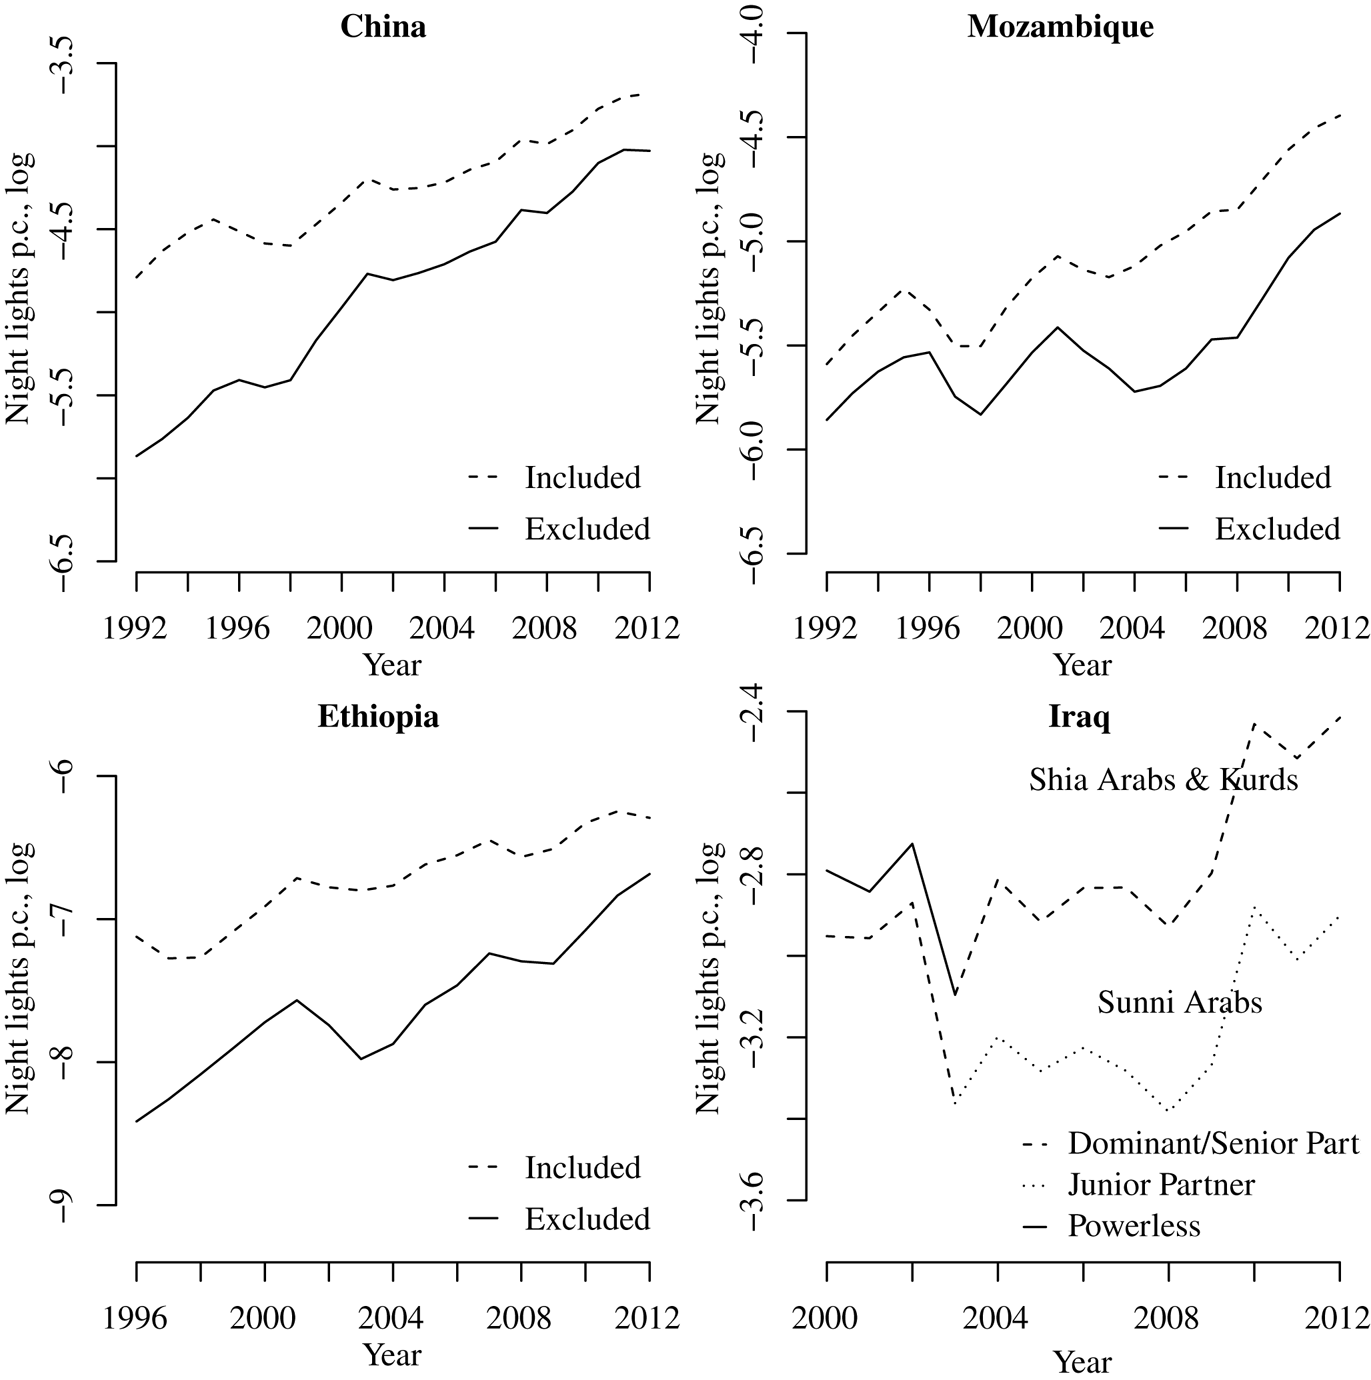
To explore the postulated institutional mechanisms in greater detail, we buttress our quantitative findings with narratives tracing ethnic inequality in China, Iraq, Ethiopia and Mozambique. We select these four states because they experienced increased trade openness over the last two decades while diverging in the quality of their institutional endowments and the makeup of ethnic government coalitions. Whereas China and Ethiopia feature stronger state institutions, Iraq and Mozambique represent weakly institutionalized neopatrimonial regimes. Figure 3 showcases trends of ethnic inequality in these four countries. In line with our theoretical argument, the developmental gap between included and excluded groups decreases in Ethiopia and China (left column) but increases in Mozambique and Iraq (right). Finally, the four narratives help us validate our measurement of ethnic inequality by comparing night light emissions to alternative data sources.
Trends of ethnic inequality in selected cases, 1992–2012

We first focus on the strongly institutionalized cases, which deepened their integration into the world economy during the period of interest. According to World Bank data, China increased its trade-to-GDP ratio by roughly forty-three percentage points whereas Ethiopia's more than doubled between 1992 and 2012.Footnote 87 At the same time, both countries carried out impressive developmental programs to lift many of their citizens out of poverty, and financed public investments to improve the economic welfare of officially recognized ethnic groups irrespective of their representation in the central government.Footnote 88
The Chinese government already started to address ethnic inequality in the 1980s by implementing affirmative action policies designed to increase education levels among ethnic minorities.Footnote 89 Efforts aimed at reducing regional disparities between the prosperous coastal and economically backward central and western areas, home to multiple minority groups, are complemented by the Ethnic Minority Development Fund, that has grown ten-fold between 2001 and 2014.Footnote 90 According to Chinese census data these efforts have paid off and minority groups have experienced relatively faster growth in education and urbanization levels than the majority Han Chinese, although minorities remain at lower absolute levels.Footnote 91 However, while many minorities have made economic progress, political inequality has in some cases increased as a result of the Chinese government's authoritarian methods of development. Internment camps for Uyghurs in Xinjang and large-scale persecution of Tibetans constitute unacceptable human rights abuses that cannot be justified with economic development.Footnote 92
We now turn to Ethiopia, which “identifies itself as a developmental state” and “is actively engaged in driving developmental efforts.”Footnote 93 Mirroring the Chinese developments, poverty fell most in the two Ethiopian regions of Tigray and the State of the Southern Nations, Nationalities and Peoples where it was highest in 1996 according to micro survey data.Footnote 94 These reductions in regional inequality match the catch-up of poorer ethnic groups documented by night light emissions of regionally concentrated ethnic groups (see Figure 3), and derive from Ethiopia's increasing integration into global markets, which enabled many small-scale farmers to benefit from rising world food prices. At the same time, the Ethiopian government invested in redistribution, the development of education and health services, and infrastructure projects.Footnote 95
The Chinese and Ethiopian states were able to implement these inequality-reducing policies thanks to capable institutions deriving from a long history of statehood and bureaucratic traditions. These descriptions fit the top ranks the two countries take in the state history measure, which we use in our empirical analysis. Despite the political dominance of the Han Chinese in China, competitive recruitment into the bureaucracy, decentralized decision making, and local elections restrict ethnic favoritism.Footnote 96 China places in the second quartile of the distribution of the merit-based appointments variable, behind the economically more advanced states of Europe, North America, and East Asia. Even though corruption is widespread, Chinese bureaucrats need to fulfill development targets set by the central government, some of which are directly measuring minorities’ economic well-being. Local elections further check bureaucrats’ attempts to favour co-ethnics.
While Ethiopia has fewer institutional constraints on state agents than China does, the country “has made a reputation for itself among donors as a reasonably honest and efficient user of the aid that it receives.”Footnote 97 Ethiopia's institutional strength mainly builds on the extensive bureaucracy that can implement government reforms throughout the country's territory. While individual corruption is widespread, the multiethnic recruitment into the state's former ruling party, the Ethiopian Peoples Revolutionary Democratic Front (EPRDF), and ethnic federalism guard against the most blatant forms of ethnic favoritism.Footnote 98 Although many groups criticized the central government for favoring the Tigry over other ethnic groups in the past, the appointment of Oromo Prime Minister Abiy Ahmed demonstrated that power sharing did not only exist on paper.Footnote 99 Ethiopia's rank in the lower half of the merit-based appointments index fits with this description, and points toward a stronger role of infrastructural power in this case.
In contrast to the two developmental success stories, ethnic inequality has increased in Mozambique and Iraq. In both countries, government officials far less restrained by state institutions favored their coethnics in distributing public funds. In Mozambique, the former independence movement Frelimo began its rule in 1975 with an ambitious state-driven development program.Footnote 100 After fifteen destructive years of civil war, a peace agreement in 1992 between Frelimo and the opposition movement Renamo attracted foreign aid and investment inflows. Under the liberalization paradigm of the Washington Consensus that saw a rise in the country's trade-to-GDP ratio by a factor of 1.77, Frelimo's leaders dominated government institutions,Footnote 101 while benefiting from privatization reforms,Footnote 102 and rewarding their Tonga and Makonde co-ethnics.Footnote 103 In contrast, Renamo's Shona supporters feel marginalized and deprived of the promises made in the 1992 peace agreement. Despite anticorruption efforts by President Guebuza in the 2000s,Footnote 104 country experts agree that embezzlement, ethnic patronage, and corruption are common in Mozambique and facilitated by weak state institutions.Footnote 105 Not surprisingly, Mozambique ranks near the bottom in the state history variable and in the lower half of the merit-based appointments index.
Like Mozambique, Iraq typifies a weak state, but its ethnic power relations, trade openness, and ethnic inequality exhibit greater dynamics than we observed in the other three cases. In the final years of Saddam Hussein's rule, the politically dominant Sunni Arab regions emitted slightly fewer night lights per capita than the excluded Shi'a and Kurdish areas. We attribute this reversal of included and excluded groups’ economic status before 2003 to the lingering consequences of the first Gulf War and the protection of the Kurdish region by the US-enforced no-flight zone that enabled de facto Kurdish autonomy and crossborder trade with Turkey. The Iraq War in 2003 reversed the ethnic power relations when the US military installed a multiethnic power-sharing coalition, in which Shi'a and Kurds held the senior government positions.Footnote 106 Part of the Sunnis’ subsequent economic demise can be explained by the destruction wrought by the 2003 invasion and the subsequent civil war that negatively affected oil production and in fact decreased Iraq's trade-to-GDP ratio until 2008.
The first national elections after the end of Saddam Hussein's rule were held in December 2005 and brought Nouri al-Maliki, a Shi'a Arab, to power. While Maliki initially promised to build bridges between the country's three major ethnic groups, he later adopted an explicitly ethnonationalist agenda that prioritized his political allies and Shi'a coethnics while discriminating against the Sunni populations.Footnote 107 During his first few years in office, Shi'a Arabs and Kurds mostly stagnated economically as measured by night light emissions. In the absence of increasing earnings from oil exports, political insiders could not benefit too much, even as Maliki and his allies began to undermine state institutions.
From his first day in office, “Maliki slowly built a shadow state that circumvented both the existing governing elite and democratic oversight of the exercise of power.”Footnote 108 The “lawlessness that prevailed until 2008” rendered possible “widespread corruption which spread like a virus throughout state institutions” and enabled officials to embezzle “billions of dollars … from state coffers, owing mostly to gaps in public procurement.”Footnote 109 As a result Sunni areas also grew slower than Shi'a and Kurdish regions during periods of relative stability and increasing integration into the global economy after 2008.Footnote 110 This growth in ethnic inequality stemmed directly from Maliki's overt ethnic nepotism and the widespread embezzlement of state resources enabled by weak institutions. This development fits well with Iraq's decline on the merit-based appointments index by fifteen places between 2005 and 2012, even if its starting point in 2005 was already in the lowest quintile. The Kurds used their autonomy and influence in Baghdad to resist some of Maliki's encroachments on their share of oil resources,Footnote 111 but the Sunnis were marginalized and fell further behind. Thus, the lack of strong state institutions enabled elite capture of the gains of trade and ethnic favoritism in both Mozambique and Iraq.
Conclusion
Motivated by the realization that extreme inequality poses an urgent challenge to development policy and the stability of ethnically divided societies, this study demonstrates that inequality between ethnic insiders and outsiders has been slowly decreasing since the end of the Cold War (Figure A1). While inequality levels remain substantial, such a decrease is striking because it contrasts sharply with the increase in levels of individual inequality in developed economies.Footnote 112 However, changes in ethnic inequality are themselves unevenly distributed across the globe. As our case descriptions reveal, some cases deviate from the overall trend and have exhibited increases in economic inequality along ethnopolitical lines.
We argue that these different trajectories derive from variation in two important dimensions of individual states’ institutional strength that govern the between-group distribution of gains and losses from rising levels of international trade—infrastructural power and meritocratic bureaucracy. Ethnic power relations assume a central role where state institutions are weak and exploited by ethnocentric elites. Politically marginalized groups fail to catch up or fall even further behind where the state lacks physical presence and clientelist networks absorb most gains from economic openness. In contrast, excluded groups stand a better chance of narrowing the gap to political insiders in more effectively governed states. Our empirical analysis shows that increasing trade openness disproportionately benefits excluded groups in polities with a longer history of centralized statehood and, to a slightly lesser extent, in states with meritocratic hiring and promotion practices in the bureaucracy.
What do these findings imply for the outcomes commonly associated with ethnic inequality? The more ethnopolitical and ethno-economic cleavages reinforce each other, the higher the potential for distributional conflict between groups, which in turn undermines governance, public goods provision, and political stability. The combination of ethno-economic inequality and ethnopolitical exclusion has been shown to be particularly conflict prone.Footnote 113 This does not bode well for the development prospects of weakly institutionalized countries. In such settings, increasing trade openness is likely to exacerbate divisions between the ethnic insiders and outsiders in political patronage networks. In the African context, these adverse effects may be partially counteracted by the clear trend toward ethnically more inclusive government coalitions (see Figure A2 in the appendix). However, a substantial number of groups remains excluded from political power. Moreover, a mere broadening of the patronage coalition is unlikely to compensate for the lack of long-term development strategies and effective political institutions.
Yet it would be a mistake to embrace the observed inequality reduction in strongly institutionalized states as an unambiguously benign process. Without political representation, the groups that benefit the most in economic terms are rarely able to influence the overall development path. Whether this is a price worth paying remains debatable. In fact, few fast-growing Asian countries with relatively strong state institutions live up to high standards of human rights and democracy.Footnote 114 In particular, China's policies toward Muslim Uyghurs and Buddhist Tibetans rank among the most blatant violations of human rights globally. Clearly, the developmental strategies chosen by some strong-state governments are part of a broader, nationalist state-building agenda.Footnote 115 In his anthropological study of peoples in the Southeast Asian highlands, James Scott reminds us that ethnic minorities rarely greet such state-building projects with much enthusiasm.Footnote 116 In the most extreme cases, developmental schemes in ethnic minority regions may trigger armed conflict between the “sons of the soil” and the state.Footnote 117
Thus, strong institutions do not guarantee that economic globalization translates into politically and economically inclusive development. Against this backdrop, future research needs to consider specific development programs and their consequences in terms of group-level inequalities, overall prosperity, and political stability. This agenda should include more fine-grained survey and census data to identify the effects of specific economic policy reforms on the income distribution and interethnic relations not only between, but also within, subnational geographic regions. To match the insights gained by students of class conflict and redistribution in developed states,Footnote 118 a clearer focus on distributional conflict between politically salient identity groups is needed to reveal what works and what does not in efforts to realize the developmental potential of trade in multiethnic societies. For now, this study provides a clearer picture of the global changes in ethnic inequality and how trade openness and domestic institutions may shape this process.
Data Availability Statement
Replication files for this article may be found at <https://doi.org/10.7910/DVN/QLG842>.
Supplementary Material
Supplementary material for this article is available at <https://doi.org/10.1017/S0020818321000096>.
Acknowledgments
We are grateful for comments by Carles Boix, Kristian Skrede Gleditsch, Marta Reynal-Querol, Andrea Ruggeri, Gerald Schneider, and workshop participants at ETH Zurich, the University of Konstanz, the ENCoRe conference at Geneva, the Ethnicity and Diversity conference at the Carlos III-Juan March Institute, Madrid, and the Conflicts and Institutions Workshop at the University of Genova. Special thanks to Philipp Hunziker for his invaluable help in data management.
Funding
This research was supported by the UK Arts and Humanities Research Council Grant No. AH/P0082757/1 and the Swiss National Science Foundation Grants No. 105511-143213 (work of Nils-Christian Bormann) and P0EZP1-159076 (Yannick Pengl) as well as a Sofja Kovalevskaja Award from the Alexander von Humboldt Foundation (Nils B. Weidmann).