Santa Maria Island, the south-eastern and geologically oldest island of the Azores Archipelago (Portugal), is a key geological archive within the North Atlantic. Its stratigraphic succession records more than 6 M years of volcanic, sedimentary and erosive processes shaped by the dynamics of the Azores Triple Junction, where the Eurasian, Nubian and North American plates interact (Miranda et al., Reference Miranda, Luis, Lourenço and Fernandes2015; Marques et al., Reference Marques, Hildenbrand and Hübscher2018; Vogt & Jung, Reference Vogt, Jung, Kueppers and Beier2018). Throughout its evolution, Santa Maria experienced alternating phases of volcanic activity and prolonged subaerial exposure, accompanied by fluctuations in sea level, marine transgressions and episodes of intense weathering and denudation. These processes collectively produced a landscape characterized by deeply altered basaltic–andesitic successions, thick residual clay profiles and localized sedimentary basins rich in fine-grained deposits (Nunes et al., Reference Nunes, Lima and Medeiros2007; Ramalho et al., Reference Ramalho, Helffrich, Madeira, Cosca, Thomas and Quartau2017). As a result, Santa Maria differs from the younger islands of the archipelago by displaying the most mature regoliths, extensive palaeosols and sedimentary sequences, all of which contribute to its distinct clay mineral assemblages.
The abundance and diversity of clayey raw materials on Santa Maria led to the earliest and most sustained ceramic tradition in the Azores. Archaeological and historical evidence indicates that local communities exploited clay deposits for pottery production since at least the Early Modern period, earning Santa Maria the designation of ‘mãe da olaria’ (mother of pottery). Historical documents and ethnographic accounts describe the extraction and inter-island export of Santa Maria clays, which were highly valued for their purity and workability, with archaeological discoveries, including an 18th century ceramic kiln, providing direct confirmation of historical ceramic production and highlighting the cultural and economic relevance of these deposits (Martins, Reference Martins1987). Although traditional pottery has nearly disappeared from the region today, Santa Maria remains the only island in the Azores where abundant residual and sedimentary clays occur in accessible, continuous deposits.
From a geological perspective, the clay-rich horizons resulted from the intense alteration of pyroclastic materials, basaltic lava flows and marine sediments under the warm, humid conditions typical of the mid-Atlantic climate. Weathering processes such as hydrolysis, leaching of mobile cations and transformation of volcanic glass and mafic minerals commonly produce kaolinite-, smectite- and palygorskite-rich assemblages (Madeira, Reference Madeira1986; Guo et al., Reference Guo, Wu, Chen, Xiong, Cui and Ding2022). Their presence in Santa Maria suggested significant potential for local industrial applications, particularly in structural ceramics, traditional pottery or even niche markets such as healing clays or geotechnical uses. The successful use of natural clays in ceramic formulations depends on a combination of textural, mineralogical, chemical and rheological properties. Granulometry affects particle packing and drying behaviour, while mineralogical assemblages, especially the proportions of kaolinite and smectite and associated quartz or feldspars, control the plasticity, shrinkage, firing temperature and mechanical strength of the final product (Rat et al., Reference Rat, Martínez-Martínez, Sánchez-Garrido, Pérez-Villarejo, Garzón and Sánchez-Soto2023). Chemical composition, particularly fluxing and refractory oxides, control vitrification and porosity evolution (Idoum et al., Reference Idoum, Tiskatine, Mounir, Bammou and Aharoune2024). The technologically relevant parameters, such as the cation-exchange capacity (CEC), pH, abrasivity, density, Atterberg limits and viscosity, provide insights into workability, durability and the clay’s behaviour during shaping and firing (Hajjaji et al., Reference Hajjaji, Hachani, Moussi, Jeridi, Medhioub and Lopez-Galindo2010; Weber & Quicker, Reference Weber and Quicker2018). Understanding these attributes is essential not only for assessing the suitability of raw clays for ceramic production but also for designing optimized blends that balance plasticity, stability and firing performance.
In the context of the Azores, relatively few studies have systematically examined the technological properties of local clay deposits, despite this particular volcanic island being rich in pedological processes and products as well as its historical ceramic heritage. Santa Maria, with its unique exposure of Miocene sedimentary units, deeply weathered volcanic formations and easily accessible outcrops, offers an exceptional natural laboratory for understanding clay genesis in mid-oceanic volcanic islands. Given the increasing demand for sustainable, locally sourced raw materials and the global emphasis on reducing transportation-related CO2 emissions in ceramic industries (Ibn-Mohammed et al., Reference Ibn-Mohammed, Randall, Mustapha, Guo, Walker and Berbano2019; Candeias et al., Reference Candeias, Novo and Rocha2025b), evaluating the properties of Santa Maria’s clays is both scientifically relevant and economically strategic. Local clay resources may serve as viable substitutes for imported materials, contributing to regional circular-economy initiatives and supporting the revival of traditional pottery or the development of new ceramic products.
The present research is part of an ongoing project aiming to characterize residual and sedimentary clays from the mid-Atlantic Azores Archipelago to assess their technological potential for ceramic formulations. The study is conceived as a first-stage screening assessment of the ceramic potential of Santa Maria clays, focusing on the mineralogical, chemical and physicochemical parameters that control technological performance, while acknowledging that full firing-related characterization lies beyond the scope of the present work.
The central hypothesis is that the long-term subaerial exposure and intense weathering history of Santa Maria have produced clay deposits with mineralogical and physicochemical characteristics comparable to or exceeding those of clays currently used in structural ceramic formulations. Specifically, the study addresses the following research questions: (1) How do the mineralogical assemblages and textural properties of Santa Maria clays reflect their volcanic and sedimentary origins? (2) To what extent do chemical composition and weathering-related indices influence their ceramic behaviour? And (3) do the technological properties, including plasticity and rheology, and the inferred firing-related behaviour based on compositional and mineralogical criteria, indicate potential suitability as local raw materials for ceramic production? To address these questions within the framework of a pre-technological screening study, a multi-analytical approach was applied, involving X-ray diffraction (XRD), X-ray fluorescence (XRF) and scanning electron microscopy–energy-dispersive spectroscopy (SEM-EDS) analysis, as well as granulometry, CEC, abrasivity, density, Atterberg limit and viscosity measurements. By providing the first island-wide, multi-parameter assessment of Santa Maria clay resources, this work aims to: establish a robust scientific basis for their technological valorization; contribute to the understanding of clay formation in oceanic volcanic settings; and support sustainable, locally sourced raw material strategies in the Azorean Island, while offering a transferable methodological framework that can be replicated in other volcanic island systems and geologically comparable regions worldwide. Although direct firing tests and mechanical performance evaluation are required for a complete technological validation, the present dataset provides a scientifically grounded basis for selecting the most promising deposits for subsequent, targeted ceramic processing trials.
Materials and methods
Geological setting
The Azores Archipelago is composed of nine volcanic islands and a few islets, and it is located in the North Atlantic Ocean, 1600 km west of the European continent. Santa Maria, the oldest and easternmost island of the archipelago, is heavily altered as a consequence of intense volcanic activity alternated with alterations in sea level and intense erosion episodes (Nunes et al., Reference Nunes, Lima and Medeiros2007). This island also represents a key location within the Azores Triple Junction, where the interaction between the Eurasian, Nubian and North American plates has controlled the long-term geodynamic evolution and the succession of volcanic and sedimentary units (Marques et al., Reference Marques, Hildenbrand and Hübscher2018). In general, the outcropping formations show visible alteration – in some cases very intense, forming residual deposits (Serralheiro, Reference Serralheiro2003). In particular, Feteiras and Almagreira formations (Fig. 1) correspond to the most recent explosive volcanic event that occurred on Santa Maria. These formations are composed of pyroclasts that were later altered to red clays under the action of a hot and humid climate (Madeira, Reference Madeira1986). Such alteration profiles commonly lead to smectite- and kaolinite-rich assemblages, which are typical weathering products of basaltic–andesitic pyroclasts in humid island environments and are of interest for ceramic applications due to their plasticity and thermal behaviour (García-Romero et al., Reference García-Romero, Vegas, Baldonedo and Marfil2005; Arslan et al., Reference Arslan, Kadir, Abdioğlu and Kolayli2006). Besides these residual outcrops, sedimentary limestones and marls of Vindobonian age do occur, with clay-rich levels. These marine deposits also record several palaeoenvironmental transitions linked to the Miocene palaeoclimate and host fine-grained detrital clays that may complement local residual materials in ceramic formulations (Ramalho et al., Reference Ramalho, Helffrich, Madeira, Cosca, Thomas and Quartau2017). These clayey deposits are laterally extensive and predominantly near-surface; nevertheless, their thickness and reserves have not yet been quantitatively assessed, and this aspect will be addressed in a subsequent phase through dedicated geophysical investigations.
Geological map of Santa Maria Island (left) with sample locations indicated and location of the Azores Archipelago (inside the red circle, right top square). Adapted from Zbyszewski & da Veiga Ferreira (Reference Zbyszewski and da Veiga Ferreira1960). Fm = Formation.

Figure 1 Long description
The geological map of Santa Maria Island displays various formations and sample locations marked as STM1 to STM16. The legend identifies different geological units: Alluvium, old Quaternary deposits; Tuff and stones, conglomerates and limestones (Vindobonian); Red pyroclasts (Feteiras, Almagreira); Basalts (Cedros and Pico Alto); and Undifferentiated basalts. The map includes main preserved craters. The right section shows the Azores Archipelago's location in the North Atlantic Ocean, marked inside a red circle. The map uses a scale bar indicating distances up to 8 km, with coordinates ranging from 660000 to 676000. Contour lines are visible, indicating elevation changes across the island.
Sampling and sample analysis
To determine whether the clayey resources of Santa Maria are available in terms of both quantity and quality, a representative sampling campaign was carried out across the entire island aiming to cover all of the outcropping geological formations, with particular emphasis on the most intensely weathered units. A total of 20 samples were collected, eight of which were representative of two well-known clay-rich deposits: the Faneca deposit (five samples: STM1, STM2, STM3, STM4A and STM4B), commonly referred to as the ‘Red Desert’; and the Piedade–Malbusca deposit (three samples: STM10A, STM10B and STM10C). Both deposits belong to the Feteiras Formation (Fig. 2).
General views of the Faneca and Piedade deposits.

Figure 2 Long description
Two side-by-side landscape photographs with the words FANECA and PIEDADE near the top. Left photograph, labeled FANECA: A wide outdoor view with a cloudy sky. Two adults are in the mid-ground on open ground, walking away from the camera. A line of trees and dense vegetation runs along the left edge. The ground shows uneven patches and a curving track leading toward the distance. Right photograph, labeled PIEDADE: A wide outdoor view with a cloudy sky. The foreground is open bare ground. Low shrubs and vegetation form a band across the middle distance, with a low rise behind them.
One sample was collected from a clay-rich level of the Vindobonian marly limestones. The remaining 12 samples were obtained from various locations across the island, where the alteration of volcanic rocks was most pronounced. All samples, referenced as STM1, STM2, STM3, STM4A, STM4B, STM5, STM6, STM7A, STM7B, STM8, STM9, STM10A, STM10B, STM10C, STM11, STM12, STM13, STM14, STM15 and STM16, were georeferenced and projected onto the geological map of Santa Maria Island using ArcGIS software (Fig. 1 & Table S1).
All samples were subjected to chemical, mineralogical and technological characterization, with particular emphasis on the parameters relevant for evaluating their potential as healing clays (Rebelo et al., Reference Rebelo, Viseras, Galindo, Rocha and Silva2011; Cerqueira et al., Reference Cerqueira, Costa, Terroso, Sequeira and Rocha2019). After wet sieving (<0.063 mm), samples were dried at ∼50°C and gently disaggregated before further analysis (Laçin et al., Reference Laçin, Aysal and Öngen2021). The fine fractions (<0.002 mm) were obtained by sedimentation following Stokes’ law. Mineralogical analyses of the <0.063 and <0.002 mm fractions were performed via XRD, using a Philips/PANalytical powder diffractometer (Malvern PANalytical, Malvern, UK), model X’Pert Pro MPD, with a Cu X-ray tube operated at 50 kV and 30 mA, from 2 to 70°2θ with a step size of 0.01° and a counting interval of 0.02 s on randomly orientated powders (bulk sample) and on orientated aggregates (<0.002 mm). The orientated aggregates were subsequently solvated with glycerol and heated to 500°C to assist in clay mineral identification. Mineralogical composition was determined using (hkl) reflections on random powder mounts for non-clay minerals and (00l) reflections on orientated aggregates for clay minerals, following the identification criteria described by Schultz (Reference Schultz1964), Brindley & Brown (Reference Brindley and Brown1980) and the Joint Committee for Powder Diffraction Standards (JCPDS). Semi-quantitative mineralogical estimates were obtained through peak-area integration of diagnostic reflections and were calculated using the reflective-power method (Galhano et al., Reference Galhano, Rocha and Gomes1999; Oliveira et al., Reference Oliveira, Rocha, Rodrigues, Jouanneau, Dias, Weber and Gomes2002). To examine individual particle size and morphology, a portion of each sample was analysed using a Tescan VEGA LMU SEM device. This instrument is capable of operation under both high- and low-vacuum modes and is equipped with secondary and backscattered electron detectors for high-resolution imaging. Semi-quantitative chemical information was obtained through an integrated EDS system. Chemical composition was determined via XRF using a PANalytical Axios PW4400/40 (Malvern PANalytical, Malvern, UK) with a Rh tube. Loss on ignition (LOI) was also determined by heating the samples at 1000°C for 2 h. The CEC was quantified using ammonium acetate (NH4CH3CO2) as the saturation solution, and pH was measured with a HANNA HI 9126 probe (Hanna Instruments®, Inc., Woonsocket, RI, USA). Consistency parameters were determined according to standard procedures: the liquid limit (LL) using the Casagrande apparatus and the plastic limit (PL) by rolling threads on a glass plate. Abrasivity was evaluated via the Einlehner method (Quintela et al., Reference Quintela, Terroso, Ferreira da Silva and Rocha2012) using an Einlehner AT-1000 apparatus, while cooling kinetics were measured with a Lutron TM-9064 thermometer. Density was measured with a pycnometer through the application of Equation 1:
 \begin{equation}{{\unicode{x03C1}}} = \frac{{{m_4}}}{{\left( {{m_1} - {m_0}} \right) - \left( {{m_3} - {m_2}} \right)}}{\text{ }} \times {\text{ }}{{{\unicode{x03C1} }}_{\text{w}}}\end{equation}
where ρ is the density of the sample, m 0 is the pycnometer mass, m 1 is the pycnometer plus water mass, m 2 is the pycnometer plus dry sample mass, m 3 is the pycnometer plus sample plus water mass, m 4 is the initial mass and ρw is the density of water (≈ 1). Viscosity was assessed using a Haake Viscotester iQ device (Thermo Scientific) equipped with a CC25DIN/Ti rotor. All analytical procedures followed the standard protocols and operating norms routinely applied at the Department of Geosciences and the Department of Materials Engineering, University of Aveiro (Hajjaji et al., Reference Hajjaji, Hachani, Moussi, Jeridi, Medhioub and Lopez-Galindo2010; Rebelo et al., Reference Rebelo, Rocha and Silva2010, Reference Rebelo, Viseras, Galindo, Rocha and Silva2011; Quintela et al., Reference Quintela, Terroso, Ferreira da Silva and Rocha2012; Candeias et al., Reference Candeias, Gomes and Rocha2025a).
Data analysis
The Chemical Index of Alteration (CIA; Nesbitt & Young, Reference Nesbitt and Young1982; Le Blond et al., Reference Le Blond, Cuadros, Molla, Berhanu, Umer, Baxter and Davey2015), was calculated from the chemical composition of the volcanic soils as: CIA = Al2O3 × 100/(Al2O3 + CaO* + Na2O + K2O), where CaO* is from silicate minerals only and was applied to samples with a molar ratio of CaO/Na2O ≤ 1 (McLennan, Reference McLennan1993).
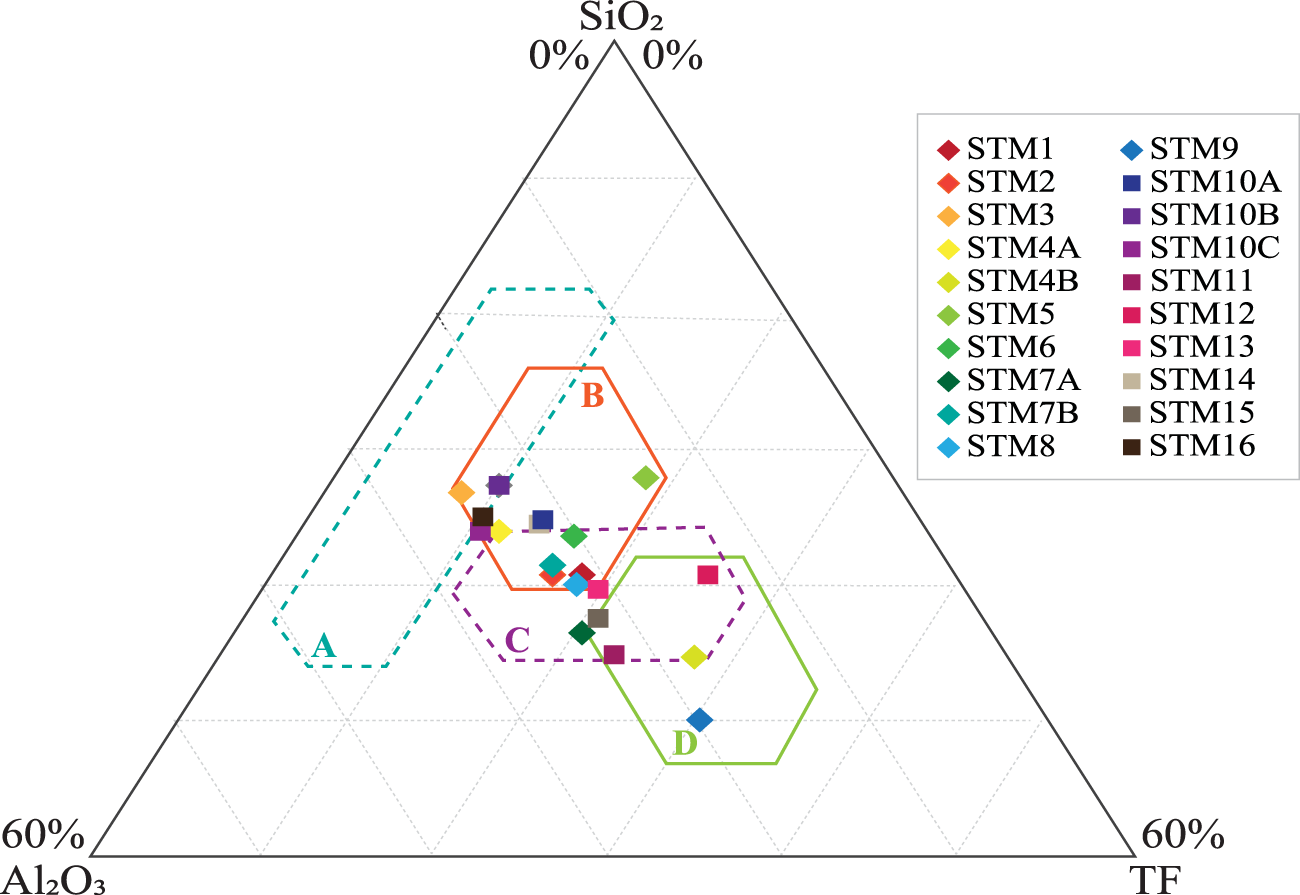
The ternary diagram proposed by Strazzera et al. (Reference Strazzera, Dondi and Marsigli1997), constructed from compositional data reported by Fabbri & Fiori (Reference Fabbri and Fiori1985) and Fiori et al. (Reference Fiori, Fabbri, Donati and Venturi1989), classifies ceramic raw materials based on the relative proportions of SiO2, Al2O3 and total fluxes (TFs; TF = Fe2O3 + CaO + MgO + K2O + Na2O). The diagram has been widely applied to evaluate the expected firing behaviour, vitrification tendency and technological suitability of clayey raw materials in ceramic bodies (Cobo-Ceacero et al., Reference Cobo-Ceacero, Cotes-Palomino, Martínez-García, Moreno-Maroto and Uceda-Rodríguez2019; Maged et al., Reference Maged, Abu El-Magd, Radwan, Kharbish and Zamzam2023; Gu & Ling, Reference Gu and Ling2024; Idoum et al., Reference Idoum, Tiskatine, Mounir, Bammou and Aharoune2024). Four main compositional fields are defined in the diagram: A = white bodies (stoneware tiles) with high SiO2 content; B = red bodies (stoneware tiles), suitable for structural ceramics; C = clays with low carbonate content; and D - highly fluxed materials (high carbonate content) with early sintering tendencies (Strazzera et al., Reference Strazzera, Dondi and Marsigli1997). In the present study, the diagram is employed exclusively for compositional positioning of the samples and not for direct prediction of technological performance.
Results and discussion
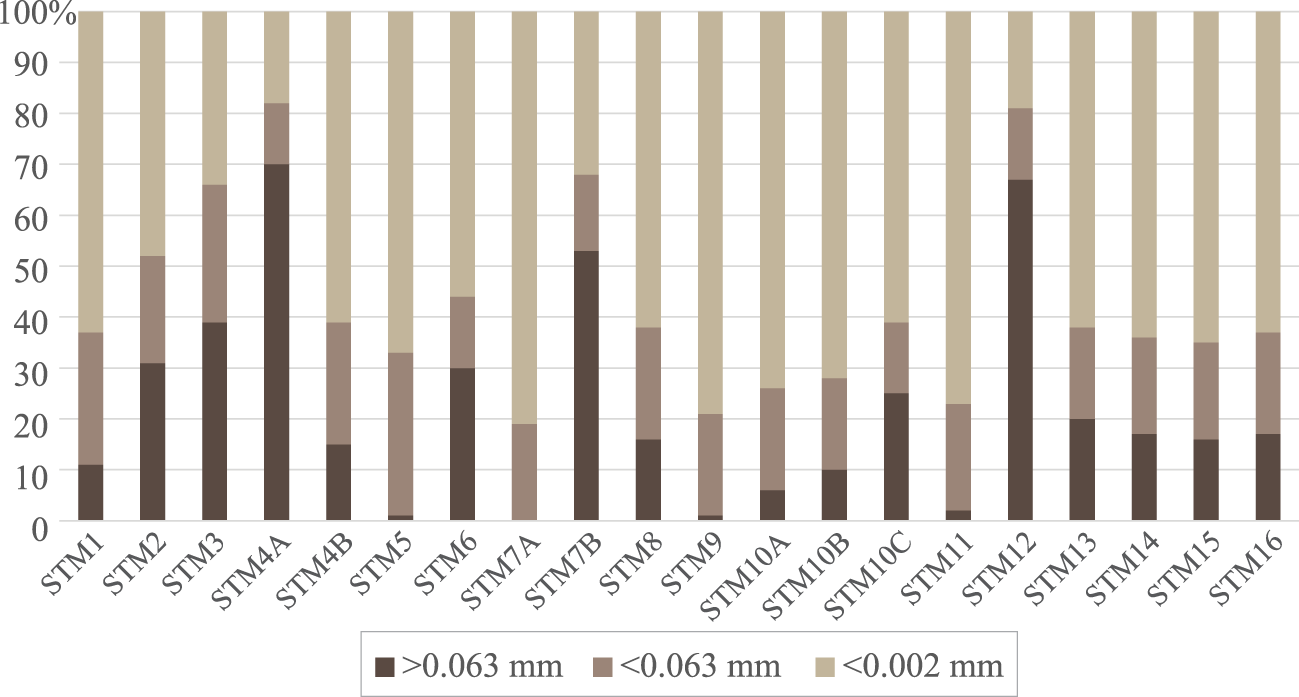
The granulometric distribution of the analysed samples showed a predominance of clay particles (<0.002 mm), with values ranging between 18% and 81%, and fine particles (<0.063 mm; 12–32%), with the sum of these fractions indicating that most materials were fine-grained and potentially suitable for ceramic applications (Fig. 3). The coarse fraction (>0.063 mm) varied substantially among the samples (0–70%), reflecting different degrees of weathering, sedimentary reworking and lithological heterogeneity across Santa Maria. Samples STM1, STM5, STM7A, STM8, STM9, STM10A–C, STM11 and STM13–16 revealed >70% mass contents of the finer fraction (sum of the <0.002 and <0.063 mm fractions), characteristic of residual clays produced by intense weathering of volcanic formations. This high proportion of fines is highly beneficial for moulding and shaping operations, favouring good plasticity and homogeneous particle packing, which are key requirements for ceramic raw materials (Grim, Reference Grim1962; Candeias et al., Reference Candeias, Novo and Rocha2025c). The STM7A sample (0%, >0.063 mm) and STM5, STM9 and STM11 samples (≤2%, >0.063 mm), being very-fine-grained clays, are typical of advanced weathering profiles where primary minerals have been almost completely transformed into clay minerals (e.g. smectite, kaolinite). Such fine fractions are generally associated with higher plasticity, better extrusion behaviour and improved sintering responses (Candeias et al., Reference Candeias, Santos and Rocha2025d). With ≥53% coarser fractions (>0.063 mm), samples STM4A (70%), STM12 (67%) and STM7B (53%) may reflect incomplete weathering of pyroclasts or scoriaceous levels, incorporation of sandy or lapilli-sized volcanic fragments and/or partial sedimentary reworking. In ceramics, such materials usually have lower plasticity and may require milling or blending with finer clays to optimize mass formulation. Similar coarse-rich volcanic materials to be integrated into ceramic pastes needed particle-size homogenization to achieve suitable moulding properties (Vite et al., Reference Vite, Vite, Castillo, Laguna-Camacho, Soto and Susarrey2010; Dehn & McNutt, Reference Dehn, McNutt and Sigurdsson2015; Gómez & Cultrone, Reference Gómez and Cultrone2025a,b). The differences between Feteiras Formation residual clays (samples STM1–4, STM7A, STM7B, STM8 and STM9) and Vindobonian marly-limestone clays (one sample) were consistent with their distinct genetic environments. Indeed, the residual clays derived from volcanic materials tend to have greater fine fractions and a wide variability in grain-size distribution due to the uneven alteration of pyroclastic units, and the Vindobonian sedimentary clay are within a fine-dominated segment (∼94% <0.002 + 0.063 mm), reflecting typical depositional sorting. Such a dual provenance provides opportunities for raw material blending, a practice that adjusts plasticity, drying sensitivity and firing behaviour in structural ceramics (Candeias & Rocha, Reference Candeias and Rocha2025).
Granulometric distribution of the analysed samples.

Figure 3 Long description
A stacked bar graph with sample labels along the horizontal axis: S T M 1, S T M 2, S T M 3, S T M 4 A, S T M 4 B, S T M 5, S T M 6, S T M 7 A, S T M 7 B, S T M 8, S T M 9, S T M 10 A, S T M 10 B, S T M 10 C, S T M 11, S T M 12, S T M 13, S T M 14, S T M 15, S T M 16. The vertical axis is labeled in percent, ranging from 0 to 100 percent. Legend entries: greater than 0.063 millimetre, less than 0.063 millimetre, less than 0.002 millimetre. Each sample is shown as one stacked bar totaling 100 percent. Visible segment values by bar height: S T M 1: greater than 0.063 millimetre about 12 percent; less than 0.063 millimetre about 25 percent; less than 0.002 millimetre about 63 percent. S T M 2: greater than 0.063 millimetre about 32 percent; less than 0.063 millimetre about 20 percent; less than 0.002 millimetre about 48 percent. S T M 3: greater than 0.063 millimetre about 40 percent; less than 0.063 millimetre about 26 percent; less than 0.002 millimetre about 34 percent. S T M 4 A: greater than 0.063 millimetre about 70 percent; less than 0.063 millimetre about 12 percent; less than 0.002 millimetre about 18 percent. S T M 4 B: greater than 0.063 millimetre about 16 percent; less than 0.063 millimetre about 24 percent; less than 0.002 millimetre about 60 percent. S T M 5: greater than 0.063 millimetre about 1 percent; less than 0.063 millimetre about 33 percent; less than 0.002 millimetre about 66 percent. S T M 6: greater than 0.063 millimetre about 30 percent; less than 0.063 millimetre about 15 percent; less than 0.002 millimetre about 55 percent. S T M 7 A: greater than 0.063 millimetre 0 percent; less than 0.063 millimetre about 20 percent; less than 0.002 millimetre about 80 percent. S T M 7 B: greater than 0.063 millimetre about 54 percent; less than 0.063 millimetre about 14 percent; less than 0.002 millimetre about 32 percent. S T M 8: greater than 0.063 millimetre about 17 percent; less than 0.063 millimetre about 22 percent; less than 0.002 millimetre about 61 percent. S T M 9: greater than 0.063 millimetre about 1 percent; less than 0.063 millimetre about 21 percent; less than 0.002 millimetre about 78 percent. S T M 10 A: greater than 0.063 millimetre about 7 percent; less than 0.063 millimetre about 20 percent; less than 0.002 millimetre about 73 percent. S T M 10 B: greater than 0.063 millimetre about 11 percent; less than 0.063 millimetre about 18 percent; less than 0.002 millimetre about 71 percent. S T M 10 C: greater than 0.063 millimetre about 26 percent; less than 0.063 millimetre about 14 percent; less than 0.002 millimetre about 60 percent. S T M 11: greater than 0.063 millimetre about 3 percent; less than 0.063 millimetre about 21 percent; less than 0.002 millimetre about 76 percent. S T M 12: greater than 0.063 millimetre about 67 percent; less than 0.063 millimetre about 14 percent; less than 0.002 millimetre about 19 percent. S T M 13: greater than 0.063 millimetre about 21 percent; less than 0.063 millimetre about 18 percent; less than 0.002 millimetre about 61 percent. S T M 14: greater than 0.063 millimetre about 18 percent; less than 0.063 millimetre about 19 percent; less than 0.002 millimetre about 63 percent. S T M 15: greater than 0.063 millimetre about 17 percent; less than 0.063 millimetre about 19 percent; less than 0.002 millimetre about 64 percent. S T M 16: greater than 0.063 millimetre about 18 percent; less than 0.063 millimetre about 20 percent; less than 0.002 millimetre about 62 percent.
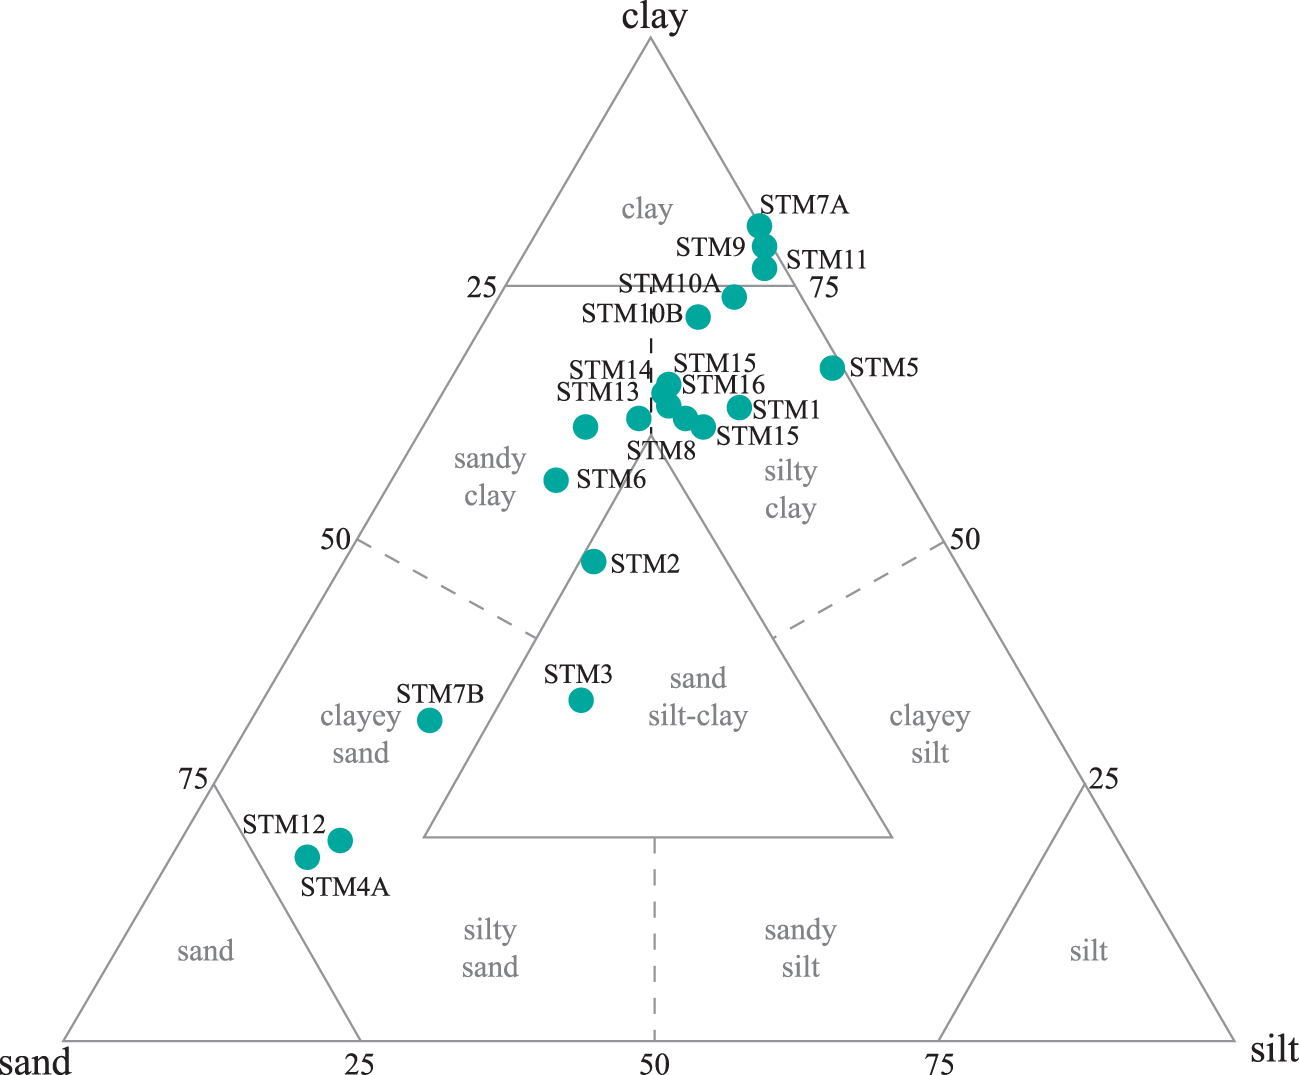
The projection of the samples onto the Shepard sand–silt–clay diagram further refines this interpretation, showing that most Santa Maria materials are projected within the clay, silty clay and clayey silt fields. These textural classes confirmed the dominance of the clay-sized fraction (<0.002 mm), with subordinate smaller contributions from silt and variable sand-sized particles. A smaller number of samples plot towards more sand-enriched fields, reflecting the inheritance of volcaniclastic or residual coarse components; however, even in these cases, the clay-rich matrix dominates (Fig. 4).
Santa Maria samples projected onto the Shepard diagram (in %; Shepard, Reference Shepard1954; Vasić et al., Reference Vasić, Muñoz Velasco, Mijatović, Radormirović and Radojević2024).

Figure 4 Long description
A ternary scatter plot with triangle corner labels: clay at the top corner, sand at the bottom-left corner and silt at the bottom-right corner. The plot contains labeled compositional fields: clay; silty clay; sandy clay; clayey silt; sand silt-clay; clayey sand; silty sand; sandy silt; sand; silt. Numeric tick labels visible on the triangle edges include 25, 50 and 75. Dashed guide lines are shown inside the triangle, including a vertical dashed line rising from the bottom edge near the 50 mark and two diagonal dashed lines. Data are shown as filled circular markers, each labeled with a sample identifier. The visible sample labels are: STM1, STM2, STM3, STM4A, STM5, STM6, STM7A, STM7B, STM8, STM9, STM10A, STM10B, STM11, STM12, STM13, STM14, STM15, STM16. Most markers are grouped in the upper central area within the clay and silty clay fields, including STM1, STM6, STM8, STM9, STM10A, STM10B, STM11, STM13, STM14, STM15, STM16 and STM7A. A single marker labeled STM5 is positioned on the right side of the upper half, near the boundary between the clay and silty clay area. STM2 is located below the main cluster, in the central area above the inner triangle. STM3 is located lower in the plot, within the sand silt-clay field. A small group of markers is located toward the lower-left side in the clayey sand area, including STM7B, STM12 and STM4A.
According to their granulometric distribution, most Santa Maria clays have suitable textural characteristics for ceramic raw-material applications, although the coarser samples may require milling or blending. For structural ceramics, optimal granulometric characteristics typically include 60–90% of <0.063 mm particles and 10–40% of sand-sized components to reduce shrinkage and cracking (EN 771-1:2011, 2011). Most Santa Maria samples fall within or near this range, namely samples STM1–3, STEM4B, STM6, STM8, STM10C and STM13–16, which should display adequate plasticity for shaping, moderate drying shrinkage, efficient sintering due to close particle packing and predictable post-firing mechanical performance. In contrast, very-fine-grained samples (≥95% <0.02 + <0.063 mm) may require tempering (e.g. the introduction of coarser fractions) to reduce sensitivity to drying, an issue that is frequently reported in tropical and volcanic clays rich in smectite and halloysite (Monteiro & Vieira, Reference Monteiro and Vieira2004; Candeias et al., Reference Candeias, Santos and Rocha2025d).
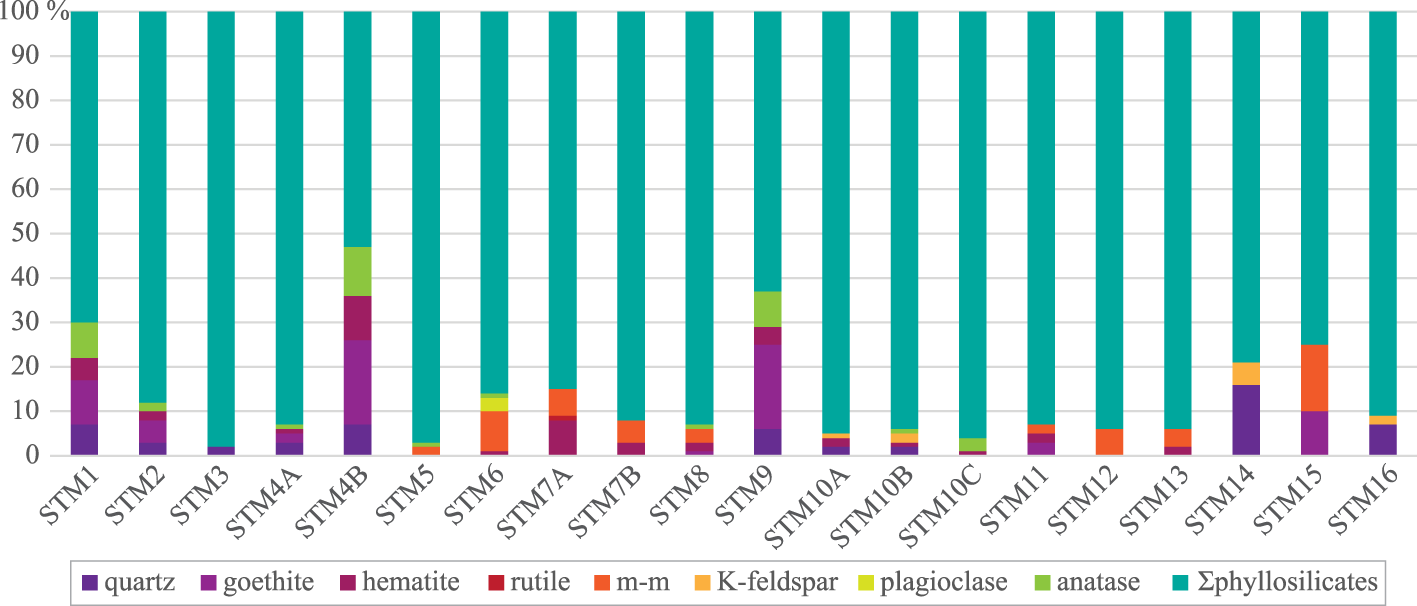
The >0.063 mm fractions are characterized by a predominance of quartz and only small occurrences of feldspars in some samples, confirming that this coarse fraction is mainly composed of mechanically resistant and technologically inert minerals. In contrast, the <0.063 mm fraction of Santa Maria samples is dominated by total phyllosilicates, ranging from 53% to 98% (Figs 5, S1 & S2 & Table S2). The total phyllosilicates is the total combined content of all phyllosilicate minerals present in the clay (e.g. clays, micas), representing the proportion of the material that contributes most strongly to plasticity, water retention and thermal transformations relevant for ceramic processing. Quartz (SiO2, 0–16 wt.%), Fe-oxides/hydroxides (goethite (Fe3+O(OH)), 0–19 wt.%, hematite (Fe2O3), 0–10 wt.% and magnetite–maghemite (Fe2+Fe3+2O4– γ-Fe2O3), 0–15 wt.%) and accessory anatase (TiO2, 0–11 wt.%), together with very minor K-feldspars (0–5 wt.%) and plagioclase (0–3 wt.%), constitute the non-clay fraction. This overall assemblage was consistent with intense weathering of basaltic–andesitic volcanic rocks and associated volcaniclastic deposits under humid conditions, where primary feldspars and mafic phases are progressively transformed into clay minerals and Fe-oxyhydroxides, while leaving a residual quartz framework. Similar clay-dominated assemblages have been described in clays used for ceramics, where smectite–illite–kaolinite associations coexist with minor quartz, feldspars and Fe-oxides (Aras & Kiliç, Reference Aras and Kiliç2017; Kagonbé et al., Reference Kagonbé, Tsozué, Nzeukou and Ngos2021).
Identified mineral phases of the <0.063 mm fractions of the Santa Maria clays. Σphyllosilicates = total phyllosilicates; m-m = magnetite–maghemite.

Figure 5 Long description
A stacked bar graph with sample labels on the horizontal axis: S T M 1, S T M 2, S T M 3, S T M 4 A, S T M 4 B, S T M 5, S T M 6, S T M 7 A, S T M 7 B, S T M 8, S T M 9, S T M 10 A, S T M 10 B, S T M 10 C, S T M 11, S T M 12, S T M 13, S T M 14, S T M 15, S T M 16. The vertical axis is labeled in percent with tick labels 0, 10, 20, 30, 40, 50, 60, 70, 80, 90, 100 percent. A legend lists categories: quartz, goethite, hematite, rutile, m minus m, K minus feldspar, plagioclase, anatase, Sigma phyllosilicates. Each sample is shown as one stacked bar reaching 100 percent. Sigma phyllosilicates occupies the largest portion in every bar. S T M 4 B and S T M 9 show larger combined lower segments than most other samples. S T M 7 A, S T M 7 B and S T M 8 show visible segments for m minus m. S T M 14 and S T M 15 show visible segments for quartz and m minus m. Smaller segments for goethite, hematite, rutile, K minus feldspar, plagioclase and anatase appear in varying amounts across the samples.
The total phyllosilicates contents of samples STM2, STM3, STM4A, STM5–8, STM10A–C, STM11–13 and STM16 exceeded 85 wt.%, being 96–98 wt.% in STM3, STM5 and STM10C, indicating that the clay fraction will strongly control both plasticity and firing behaviour. These clays, being rich in phyllosilicates, would exhibit good workability and strong green bodies, desirable for extrusion and pressing, although the most clay-rich samples may require careful control of drying schedules and, if necessary, tempering to avoid cracking and warping. Quartz content was generally low to moderate, with the highest values (6–16 wt.%) occurring in samples STM1, STM4B, STM9, STM14 and STM16, while samples STM5–8, STM10C–13 and STM15 were quartz-free in their <0.063 mm fractions. Being a non-plastic phase, quartz acts as a skeletal framework that reduces plasticity, limits shrinkage and contributes to mechanical strength after firing, but excessive or very coarse quartz can generate microcracking and increase thermal expansion mismatch (Mustafi et al., Reference Mustafi, Ahsan and Dewan2009; Bó et al., Reference Bó, Gilabert, Boschi, Sánchez, Cantavella and Hotza2023). The low quartz contents observed in most samples suggests that, for structural ceramics fired at moderate temperatures, these clays would benefit from some inherent tempering without compromising plasticity. However, for formulations using the finer, quartz-poor samples, addition of a controlled quartz or silt fraction could be advantageous to improve drying stability (Candeias & Rocha, Reference Candeias and Rocha2025).
Iron oxides and hydroxides occurred as goethite, hematite and magnetite–maghemite, with variable proportions among the samples. Goethite and hematite together reached 29 wt.% in STM4B and 23 wt.% STM10A and were less abundant in STM1 (17 wt.%), STM2 (7 wt.%) and STM15 (10 wt.%). These minerals are key chromophores, controlling the reddish to yellowish colour of the fired ceramics, with their content and crystal size and oxidation state affecting both hue and colour intensity (Bonis et al. Reference Bonis, Cultrone, Grifa, Langella, Leone, Mercurio and Morra2017; Laita et al., Reference Laita, Bauluz, Mayayo and Yuste2021). Goethite commonly dehydrates and transforms into hematite upon firing, generating bright red tones, whereas incomplete oxidation or local reducing conditions may stabilize magnetite–maghemite and, in extreme cases, wüstite (FeO), leading to darker cores or defects (Jiang et al., Reference Jiang, Liu, Roberts, Dekkers, Barrón, Torrent and Li2022; Taşkıran et al., Reference Taşkıran, Kayacı, Sirkeci, Yıldırım and Darcan2025). The presence of magnetite–maghemite in Santa Maria samples STM5–8, STM11–13 and STM15, while finely dispersed, can promote fluxing and contribute to colour development. When coarser or aggregated grains are present, they may produce black specks or black-core-type defects if firing conditions are not adequately controlled, requiring close monitoring to guarantee the aesthetic quality of red ceramics (Hay et al., Reference Hay, Haider, AlTantawi and Celik2024).
Anatase, a common accessory phase in weathered volcanic and sedimentary clays, was ubiquitous but in low amounts (0–11 wt.%), with the highest contents in STM1 (8 wt.%), STM4B (11 wt.%) and STM9 (8 wt.%). Anatase acts as a minor chromophore, particularly when coupled with Fe-oxides, slightly modifying the fired colour from yellowish to brownish, or enhancing red tones (Ghosh & Sen, Reference Ghosh and Sen1961; Zame et al., Reference Zame, Lawou, Assomo, Moutsou, Dzoti and Beyala2024). Anatase may contribute to slight colour variations among the Santa Maria samples and may influence the optical properties of the fired body. The coexistence of goethite/hematite and anatase reflected the mineralogical pattern observed in other ceramic clays where kaolinite–smectite–illite assemblages were associated with quartz and Fe- and Ti-oxides (Zame et al., Reference Zame, Lawou, Assomo, Moutsou, Dzoti and Beyala2024). K-feldspars and plagioclase are scarce or absent in Santa Maria clay samples. In many industrial clays, feldspars and alkali-bearing mica/illite provide the main fluxes that generate liquid phases during firing, promoting vitrification and mullite formation (Monteiro & Vieira, Reference Monteiro and Vieira2004; Halim et al., Reference Halim, Daoudi, Ouahabi, Amakrane and Fagel2018). The near absence of feldspars suggests that fluxing will depend largely on alkalis hosted in illite and other phyllosilicates and on Fe-bearing phases rather than on a separate feldspathic fraction. Hence, firing schedules may need optimization to balance sufficient liquid-phase formation (for strength and densification) against the risk of over-firing in the most Fe-rich, smectitic samples.
From a technological perspective, the mineral assemblages of the Santa Maria clays were favourable for structural ceramics, with the dominance of phyllosilicates supporting good plasticity and green strength, low to moderate quartz contents providing a natural temper that moderates shrinkage, and Fe-oxides and anatase ensuring the development of satisfactory red to reddish-brown colours, typical of redware products. Studies on clays for pottery and bricks showed that a similar mineralogy produced suitable shrinkage, water absorption and bending strength upon firing (Aras & Kiliç, Reference Aras and Kiliç2017; Baghdad et al., Reference Baghdad, Bouazi, Bouftouha, Hatert and Fagel2019).
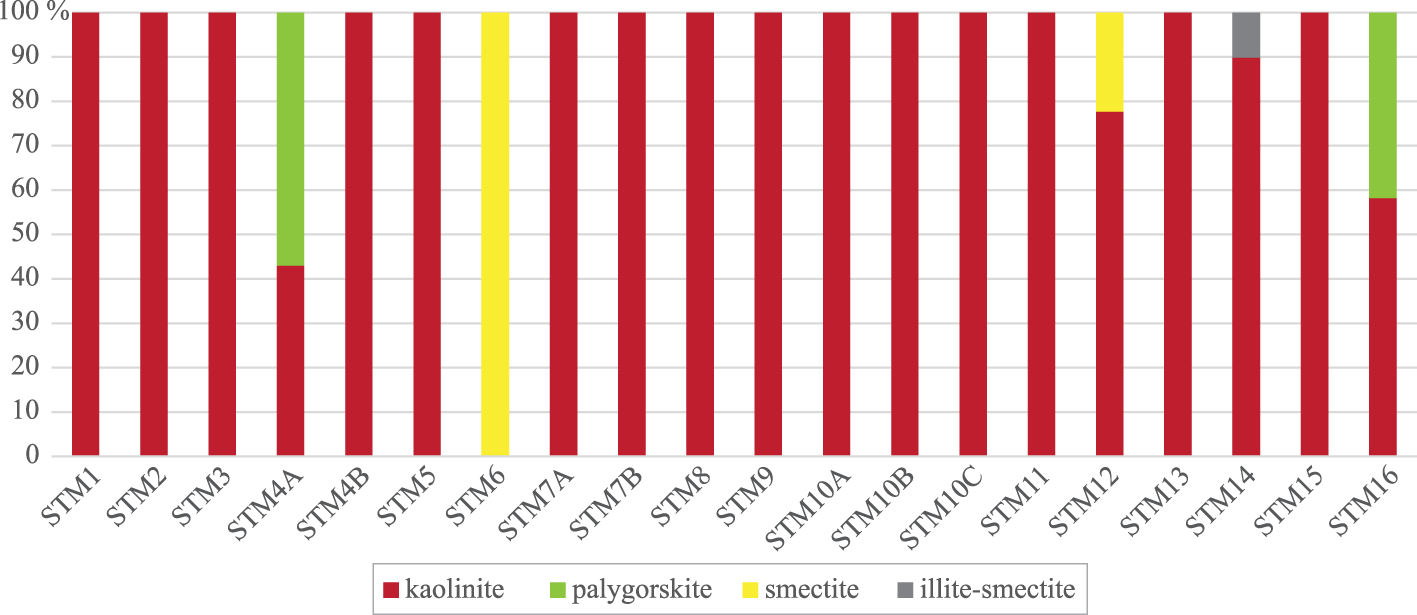
The clay fraction (<0.002 mm) of the Santa Maria samples is dominated by kaolinite, with minor smectite, palygorskite and mixed-layer illite-smectite (Figs 6, S3, S4, & Table S3). Kaolinite was the predominant mineral in most samples, ranging from 40 to 98%, except in STM6, where it was absent. Smectite was only identified in STM6 (86 wt.%) and STM12 (21 wt.%), palygorskite in STM4A (53 wt.%) and STM16 (38 wt.%) and mixed-layer illite-smectite only in STM14 (8 wt.%). This mineralogical distribution reflected intense weathering of basaltic–andesitic volcanic materials under warm, humid conditions, consistent with weathering trends (Hajjaji et al., Reference Hajjaji, Hachani, Moussi, Jeridi, Medhioub and Lopez-Galindo2010). Kaolinite-rich clays are widely recognized for their favourable ceramic behaviour, including moderate plasticity, low drying shrinkage and good thermal stability, with transformation into mullite at temperatures >1000–1050°C. These properties promote predictable firing behaviour and stable fired bodies, aligning with results from similar kaolinitic clays (Hajjaji et al., Reference Hajjaji, Hachani, Moussi, Jeridi, Medhioub and Lopez-Galindo2010; Candeias et al., Reference Candeias, Santos and Rocha2025e). Due to their high kaolinite contents, the Santa Maria samples are expected to show excellent drying performance, low warping risk and good mechanical integrity after firing. However, the relatively low inherent plasticity of kaolinite may require blending with more plastic clays for extrusion-intensive manufacturing processes.
Identified mineral phases of the <0.002 mm fractions of the Santa Maria clays.

Figure 6 Long description
A stacked bar graph with sample labels on the horizontal axis: S T M 1, S T M 2, S T M 3, S T M 4 A, S T M 4 B, S T M 5, S T M 6, S T M 7 A, S T M 7 B, S T M 8, S T M 9, S T M 10 A, S T M 10 B, S T M 10 C, S T M 11, S T M 12, S T M 13, S T M 14, S T M 15, S T M 16. The vertical axis is labeled in percent from 0 percent to 100 percent. Legend labels: kaolinite, palygorskite, smectite, illite minus smectite. Bar values by sample, in percent: S T M 1: kaolinite 100 percent. S T M 2: kaolinite 100 percent. S T M 3: kaolinite 100 percent. S T M 4 A: kaolinite 43 percent, palygorskite 57 percent. S T M 4 B: kaolinite 100 percent. S T M 5: kaolinite 100 percent. S T M 6: smectite 100 percent. S T M 7 A: kaolinite 100 percent. S T M 7 B: kaolinite 100 percent. S T M 8: kaolinite 100 percent. S T M 9: kaolinite 100 percent. S T M 10 A: kaolinite 100 percent. S T M 10 B: kaolinite 100 percent. S T M 10 C: kaolinite 100 percent. S T M 11: kaolinite 100 percent. S T M 12: kaolinite 78 percent, smectite 22 percent. S T M 13: kaolinite 100 percent. S T M 14: kaolinite 90 percent, illite minus smectite 10 percent. S T M 15: kaolinite 100 percent. S T M 16: kaolinite 58 percent, palygorskite 42 percent.
Smectite-rich samples STM6 (86 wt.%) and STM12 (21 wt.%) will probably display a different ceramic behaviour due to their high plasticity and water retention and also significant drying and firing shrinkage. They will show improved shaping and green strength, but also increase risk of drying cracks, lamination and distortion during firing (Hajjaji et al., Reference Hajjaji, Hachani, Moussi, Jeridi, Medhioub and Lopez-Galindo2010; Serry et al., Reference Serry, Hegab and El-Wahed2015; Candeias et al., Reference Candeias, Novo and Rocha2025c). Therefore, smectitic clays often require tempering with coarser or non-plastic fractions (e.g. quartz sand or grog) to mitigate shrinkage and enhance dimensional stability. The Santa Maria smectitic samples would therefore benefit from controlled blending before application, although their high plasticity will probably render them suitable as additives to improve the mouldability of kaolinitic clays. Palygorskite-rich samples (STM4A 53 wt.%, STM16 38 wt.%) would exhibit a performance characteristic of fibrous clays, including moderate plasticity, low shrinkage and good green-body cohesion. Palygorskite undergoes structural breakdown between 400°C and 600°C, potentially increasing porosity in fired ceramics (Galan, Reference Galan1996; Murray, Reference Murray2000); hence, these clays may require flux additions to achieve sufficient densification at common structural-ceramic firing temperatures (900–1050°C). Nevertheless, their dimensional stability and lower plasticity make them suitable tempering agents when blended with more plastic or smectitic clays. Mixed-layer illite–smectite, present only in STM14, can impart intermediate properties with moderate plasticity, and the K-bearing structure will contribute to fluxing behaviour at ≥950°C, enabling the formation of a liquid phase that enhances early sintering (El Ouahabi et al., Reference El Ouahabi, Daoudi, Hatert and Fagel2015; Martínez-Martínez et al., Reference Martínez-Martínez, Pérez-Villarejo, Garzón and Sánchez-Soto2023).
The SEM-EDS analysis of sample STM3 (Fig. 7a) showed particles with Si/Al atomic ratios close to 1 and only minor Fe, Ti and alkali contents, consistent with the presence of kaolinite as the dominant phase. There are probably also kaolinite particles, with minor Fe substituting in the octahedral sheet and/or ultra-fine Fe-oxyhydroxide (e.g. goethite, hematite, magnetite-maghemite) and Ti (e.g. anatase, rutile) on the surfaces/edges, these accessory phases being too scarce to be identified by the XRD analysis. Similar results were obtained for samples STM1, STM2, STM5, STM7–11 and STM13–15. Sample STM4B (Fig. 7b) consists of two main groups of minerals: agglomerates with a composition of Fe-oxyhydroxide/Fe-oxide, possibly magnetite-maghemite, hematite and/or goethite, in agreement with the XRD data (19 wt.% goethite, 10 wt.% hematite and 11 wt.% anatase in the <0.063 mm fraction); and kaolinite agglomerates. Sample STM6 (Fig. 7c) consists of smectite as the dominant phase, with traces of Fe and Ti, suggesting the presence of smectite particles coated or intergrown with finely dispersed Fe- and Ti-oxides. Sample STM4A (Fig. 7d), similarly to STM16, consists of agglomerates made of palygorskite ((Mg,Al)2Si4O10(OH)·4H2O) particles, identified by the Mg content and high Si content with Si/Al ratios >9. The remaining particles showed Si/Al atomic ratios close to 1 and Mg <1%, typical of kaolinite, as well as kaolinite particles coated by Fe- and Ti-bearing phases.
Representative images of the SEM-EDS analysis of samples (a) STM3, (b) STM4B, (c) STM6 and (d) STM4A. Different types of particles are marked with different colours, according to the mineral present: green = kaolinite; blue = kaolinite with minor Fe and Ti; orange = Fe-oxides; purple = smectite; yellow = smectite with minor Fe and Ti; brown = palygorskite.

Figure 7 Long description
The image A showing a grayscale micrograph with several angular and elongated particles on a dark background. Multiple circular marker dots in blue and green are placed on different particles. A small inset plot at the lower right contains the text “kaolinite” and “kaolinite + minor Fe/Ti” with green and blue vertical peaks. A scale bar at the bottom reads “20 µm”. The image B showing a grayscale micrograph densely filled with many small particles and a few larger fragments. Multiple circular marker dots in green and red are distributed across the field. A small inset plot at the lower right contains the text “Fe oxides” with red vertical peaks. A scale bar at the bottom reads “20 µm”. The image C showing a grayscale micrograph with several larger fragments and smaller particles on a dark background. Multiple circular marker dots in yellow and magenta are placed across the particles. Two inset plots at the upper left contain the text “smectite” and “smectite + minor Fe/Ti” with magenta and yellow vertical peaks. A scale bar at the bottom reads “20 µm”. The image D showing a grayscale micrograph centered on one large irregular particle with a textured interior and a darker surrounding background. Multiple circular marker dots in blue, green and brown are placed across the large particle. A small inset plot at the lower left contains the text “palygorskite” with brown vertical peaks. A scale bar at the bottom reads “10 µm”.
The chemical composition reflected the mixed volcanic/residual origin, in accordance with the identified minerals. The major elements were SiO2 (25.32–44.69%), Al2O3 (13.12–32.92%) and Fe2O3 (8.61–31.08%), with minor contributions from K2O, MgO, Na2O and TiO2 (Table 1), a composition typical of advanced weathering of basaltic–andesitic volcanic units, where plagioclase, pyroxene and volcanic glass are transformed into kaolinite, smectite, palygorskite and Fe-oxides. The samples STM3, STM4A, STM10A–C and STM16 have the highest Al2O3 contents with high kaolinite (theoretical composition 39.5 wt.% Al2O3 and 46.5 wt.% SiO2; Bergaya et al., Reference Bergaya, Theng and Lagaly2006) content and Al2O3/SiO2 ratios >0.7 suggesting clay mineral control. The Al2O3 contents favour mullite formation at >1000°C, increasing the mechanical strength and thermal stability of the fired bodies, while the moderate SiO2 contents limit deformation during firing. The Fe2O3 contents were greater in STM4B, STM9 and STM11, in agreement with Fe-oxide minerals contents (known chromophores), exerting a strong influence on fired colour, producing orange to deep red hues depending on firing atmosphere and temperature (Gerhard, Reference Gerhard2022). A high Fe2O3 content is typical of weathered basaltic volcanic soils, tuffaceous clays and lateritic environments (Darunsontaya et al., Reference Darunsontaya, Suddhiprakarn, Kheoruenromne and Gilkes2010; Ngun et al., Reference Ngun, Mohamad, Sulaiman, Okada and Ahmad2011), acting as a fluxing oxide in ceramics, promoting early liquid-phase sintering at 900–1050°C and favouring the development of the characteristic deep red tones of structural ceramics. However, Fe >25 wt.% may increase the risk of black-core formation if firing takes place under reducing or poorly ventilated conditions.
Major elements composition of the <0.063 mm fraction of the Santa Maria clays, LOI, pH and CIA.

Table 1 Long description
The table reports major oxide composition for the fine clay fraction of 16 Santa Maria samples, along with loss on ignition, pH, and a chemical weathering index (CIA). CIA values are consistently high, ranging from about 88 (STM5) to about 98 (STM7B), indicating strongly weathered material overall. Silica varies from about 25 (STM9) to about 45 (STM5), while alumina ranges from about 13 (STM5) to about 33 (STM3). Iron oxide shows large spread, from about 9 (STM3) to about 31 (STM9), with STM4B also high at about 30. Loss on ignition is usually around 8 to 15, but STM8 is much higher at about 31, standing out from the rest. pH is mostly acidic near 4 to 6, with STM6 notably higher at about 8. Calcium oxide is generally very low (often near 0.1), except STM5 at about 1.8; magnesium oxide is also low except STM5 near 5. Chlorine is near zero in most samples, with STM9 and STM16 recorded as not detected.
ND = not detected.
The TiO2 contents (1.29 and 6.04 wt.%) reflect the presence of anatase (TiO2), a common accessory mineral phase in weathered volcanic and tropical clays, contributing to colour stabilization and opacity in fired ceramics, frequently in association with Fe-oxides (Danfá et al., Reference Danfá, Martins, Quina and Gomes2021). The alkali oxides K2O and Na2O occurred in relatively small amounts: from 0.04 to 1.21 wt.% and from 0.03 to 0.66 wt.%, respectively. Although their concentrations are modest, they are sufficient for vitrification at intermediate firing temperatures. Samples STM3, STM4A, STM10A, STMA10B and STM14, with K2O ≥0.8 wt.%, are expected to exhibit some increased fluxing behaviour during firing. Similar alkali contents were reported for clays successfully used for structural ceramics (Candeias et al., Reference Candeias, Santos and Rocha2025d), suggesting that the Santa Maria clays showed adequate alkali contents for red-ceramic formulations. The MgO contents ranged from 0.33 to 4.99 wt.%, with the highest values occurring in STM5 and STM12 (2.09 wt.%), and CaO contents were very low (<0.6 wt.%), except in STM5, consistent with the absence of carbonates. The LOI varied between 8 and 15 wt.%, except for sample STM8, mainly reflecting dehydroxylation of kaolinite, smectite and palygorskite, the transformation of goethite into hematite and the loss of adsorbed water. Greater LOI values correlate with clay-rich, Fe-oxyhydroxide-rich assemblages. Samples STM1, STM2, STM5, STM7A, STM8–11 and STM14–16 showed LOI >13 wt.%, typical of kaolinite–Fe oxide-dominated clays (Candeias et al., Reference Candeias, Santos and Rocha2025e).
The CIA results, calculated using the <0.063 mm fraction results (Nesbitt & Young, Reference Nesbitt and Young1982), ranged from 88.3% to 97.6% (Table 1), showing that all of the Santa Maria samples presented intense to extreme chemical weathering of the original volcanic source rocks. According to Nesbitt & Young (Reference Nesbitt and Young1982), CIA values of 45–55% are typical of unweathered, feldspar-rich igneous rocks, CIA values of 60–80% indicate moderate weathering and CIA values >80% indicate intense chemical weathering due to strong leaching of Ca, Na and K compared to Al. The samples have low CaO and Na2O (mostly <0.4 wt.% for CaO and Na2O, except for samples STM5 and STM12) contents, mostly low K2O contents, relatively high Al2O3 (13.1–32.9 wt.%) and Fe2O3 (8.6–31.1 wt.%) contents and LOI ranging from 8.0 to 31.4 wt.%, typical of strongly leached, clay-rich weathering products derived from mafic to intermediate volcanic rocks, where labile cations were removed and Al and Fe accumulated in secondary phyllosilicates and Fe-oxyhydroxides. Comparable CIA ranges were reported by Le Blond et al. (Reference Le Blond, Cuadros, Molla, Berhanu, Umer, Baxter and Davey2015) and Guo et al. (Reference Guo, Wu, Chen, Xiong, Cui and Ding2022) for deeply weathered basaltic terrains and volcanic soils under humid conditions.
The pH values were consistent with mineralogy, with lower pH values corresponding to kaolinitic samples, while the smectitic STM6 sample has an alkaline pH (Table 1). Sample STM6 (86 wt.% smectite) exhibits a very high CIA value (96.6%), indicating intense chemical weathering. In volcanic environments, smectite commonly forms as an intermediate alteration product derived from the weathering of volcanic glass and feldspars and may subsequently transform into palygorskite under alkaline and Mg-rich conditions (Xie et al., Reference Xie, Chen, Zhou, Xu, Xu and Ji2013), which is consistent with the slightly alkaline pH measured for this sample (pH ≈ 8). With continued weathering and a progressive shift toward lower pH conditions, palygorskite may in turn undergo kaolinization, leading to the formation of kaolinite (Khademi & Arocena, Reference Khademi and Arocena2008). The presence of palygorskite in STM4A and STM16 is significant as this mineral is widely regarded to be an indicator of semi-arid to arid conditions, typically associated with evaporative or alkaline environments. Palygorskite may form either by direct precipitation from Mg- and Si-rich solutions or through the transformation of smectite under such conditions, the latter considered the dominant mechanism for formation of pedogenic palygorskite in red clays (Khademi & Arocena, Reference Khademi and Arocena2008). However, CIA values were high, revealing that even under locally more alkaline or evaporitic microenvironments, the overall system had already undergone strong depletion of Ca–Na–K. These samples may record phases where intense leaching, producing high CIA, was followed by partial concentration of Mg-rich solutions and palygorskite precipitation. Sample STM12, where smectite coexists with kaolinite, also displayed a high CIA, suggesting a transitional stage between smectitic and kaolinitic weathering products. Additionally, samples with the finest textures showed the highest CIA values, revealing the mechanical breakdown and concentration of clay and silt associated with prolonged chemical alteration. However, high CIA values were not restricted to the finest samples, suggesting that CIA was controlled more by the degree of leaching and clay mineralogy than by grain size, even if fine-grained, clay-rich horizons tend to concentrate the weathering products (Mangold et al., Reference Mangold, Dehouck, Fedo, Forni, Achilles and Bristow2019). Nevertheless, the combination of high CIA and high fine fractions in most samples confirms that these clays represent advanced stages of volcanic regolith evolution rather than a weakly altered parent rock.
The CEC of the Santa Maria samples ranged from 2.0 to 61.0 meq 100 g–1 (Table 2), a variability largely controlled by clay mineralogy and, to a lesser degree, by texture. All samples except STM6 and STM4A were dominated by kaolinite in the <0.002 mm fraction, with negligible smectite or palygorskite contents. These kaolinite-rich clays have generally low to moderate CEC values), consistent with the low permanent charge of kaolinite (typically 1–15 meq/100 g), in which ion exchange is mainly pH-dependent rather than being reliant upon interlayer surfaces (Weber & Quicker, Reference Weber and Quicker2018). The measured values showed slightly greater reactivity than that of pure kaolinite, which can be attributed to the fine particle size and minor contributions from accessory phyllosilicates and Fe-oxides commonly observed in natural kaolinitic clays (Ma & Eggleton, Reference Ma and Eggleton1999; Tan et al., Reference Tan, Liu, Hu, Reed, Furukawa and Zhang2017). Smectitic samples STM6 and STM12 (73% kaolinite, 21% smectite) displayed the highest CEC values (61.0 and 35.8 meq 100 g–1, respectively). Smectite-group minerals typically show CEC values in the range of 70–130 meq 100 g–1, which is much higher than that of kaolinite (Martin, Reference Martin1980), and even a moderate smectite proportion in a kaolinite matrix can increase the CEC value, as observed for sample STM12. Sample STM16, with a combination of kaolinite and palygorskite, presented an intermediate CEC (13.8 meq 100 g–1), as palygorskite commonly exhibits moderate CEC values, typically 20–50 meq 100 g–1, depending on the purity and surface (Assis et al., Reference Assis, Cerqueda, Souza, Jesus, Marçano and Simões2019). The Santa Maria sample values were compatible with a mixture of low-CEC kaolinite and moderate-CEC palygorskite, confirming that palygorskite contributes to increasing the CEC relative to pure kaolinite. From the perspective of use in ceramics, these CEC values indicated that most Santa Maria clays had moderate CEC, similar to many kaolinitic raw materials already used in red ceramics (Candeias et al., Reference Candeias, Novo and Rocha2025c). The smectitic STM6 and mixed-layer STM12, with higher CEC values, can be expected to show greater water uptake, higher plasticity and potentially greater drying sensitivity, which should be considered when designing ceramic bodies or blends.
Technological properties of the Santa Maria clay samples.

Table 2 Long description
The table lists technological properties for 16 Santa Maria clay samples, giving cation exchange capacity (CEC), abrasivity index (AI), and density for each sample. AI shows the largest spread, from 11.5 in STM12 up to 499.0 in STM5, with another very high value in STM6 at 434.4. Several samples have midrange AI values around 240 to 260, including STM13 at 242.3, STM15 at 243.9, and STM14 at 257.7. CEC ranges from a low of 2.0 in STM4B to a high of 61.0 in STM6, with STM12 also high at 35.8 and STM15 at 30.2. Density is mostly between 2.2 and 2.9, but STM16 is notably higher at 4.1 and STM15 and STM10C are notably lower at 1.7 and 1.8. High CEC does not consistently align with high AI, as STM12 has high CEC but the lowest AI, while STM5 has the highest AI with a moderate CEC. Values are reported per sample and should be compared cautiously because the table does not provide measurement uncertainty or replicate results.
CEC measured in meq 100 g–1.
ρ = density (g cm–3); AI = abrasivity index (g m–2)
The abrasivity index (AI) varied substantially, ranging from 15.1 to 499 g m–2, with very high AI values in STM5 (499.0 g m–2) and STM6 (434.4 g m–2), and low to moderate values in STM1, STM2, STM4A, STM9, STM10C, STM12 and STM16 (<40 g m–2). Abrasivity is mainly controlled by the presence of hard minerals (especially quartz), grain size, angularity and degree of cementation (Hamzaban & Rishsefid Mohammadi, Reference Hamzaban and Rishsefid Mohammadi2022). Samples with intermediate AI (50–258 g m–2) generally combined SiO2 >30 wt.%, greater fine-fraction content and abundant kaolinite, sometimes with minor smectite or mixed-layer illite–smectite. For fine-grained materials with a similar mineralogy, the particle-size distribution, degree of aggregation and water content strongly influence abrasivity (Hamzaban et al., Reference Hamzaban, Mohammadi and Jakobsen2020; Tang et al., Reference Tang, Zhang, Liu, Xie, Wang, Li and Zhang2022), with the Santa Maria clays being in agreement with these conclusions, as the AI results do not depend only on the coarse fraction and quartz content but on a combination of texture and microstructure. In ceramics, clays STM5 and STM6 are expected to cause stronger wear to cutting tools and extruder dies, while low-AI samples are expected to be less problematic in terms of mechanical wear, even if they require blending with more plastic or reactive materials to achieve adequate forming behaviour. Density (ρ) ranged from 1.8 to 4.1 mg m–3, with most samples being between 2.3 and 2.9 g cm–3, consistent with the specific gravities of common clay minerals and associated silicates: kaolinite 2.6 g cm–3, smectite 2.3–2.4 g cm–3, illite 2.6–2.9 g cm–3 and palygorskite 2.3–2.6 g cm–3 (Totten et al., Reference Totten, Hanan, Knight and Borges2002; Aksu et al., Reference Aksu, Bazilevskaya and Karpyn2015). No relationship was observed between density and CEC, which was expected because CEC was controlled mainly by the layer charge and accessible surface area rather than by mineral density (Murray, Reference Murray1999)
The liquid limit (LL) of Santa Maria samples ranges between 33.5% and 58.1% and the plasticity index (PI) ranges between 9.3% and 40.1%, typical of natural clays used for structural ceramics (Candeias et al., Reference Candeias, Novo and Rocha2025c). Casagrande (Reference Casagrande1932) defined a diagram to identify the plastic properties of materials, and Gippini (Reference Gippini1969) identified the four main such classes of clay materials (Bain & Highley, Reference Bain, Highley, Mortland and Farmer1978): no plasticity (0% < LL< 20%), low plasticity (20% < LL < 35%), medium plasticity (35% < LL < 50%) and high plasticity (LL > 50%). Most of the Santa Maria clays were classified in the medium-plasticity group (LL = 37.6–49.8%), with STM4, STM12 and STM16 falling within the high-plasticity field (LL > 50%) and STM5 at the upper boundary of the low-plasticity group (LL = 33.5%). PI values >15% were observed for almost all of the samples (except STM7A and STM7B, at 9.3% and 13.1%, respectively), suggesting moderate to high plasticity, making these clays suitable for the extrusion of bricks or tiles from a stiff (plastic clay mixture with low water content). The Casagrande plasticity chart (Fig. 8) showed that all samples plot above the A-line, except STM7B, which was slightly below, classifying almost all clays as inorganic clays of low to high plasticity, whereas STM7B was in the silty–clayey transition domain (Tangwa et al., Reference Tangwa, Anoh and Njamnsi2022). The reinterpretation of plasticity fields by Moreno-Maroto & Alonso-Azcárate (Reference Moreno-Maroto and Alonso-Azcárate2018) suggested that a fine-grained soil behaves as a clay when PI ≥ LL/2 and as a moderately/slightly clayey material when LL/3 < PI < LL/2. Samples STM1–6, STM9–14 and STM16 have PI values ≥ LL/2, therefore being classified as true clays in terms of consistency. Samples STM7A, STM7B and STM15 have LL/3 < PI < LL/2, thus being classified as moderately clayey but still clearly cohesive materials, while STM7B showed a PI value < LL/3, near the lower plasticity limit of clayey materials, consistent with greater proportions of non-plastic silt and fine sand. All of the samples were projected below the U-line (Fig. 8), with no high plasticity observed, consistent with the identified mineral phases. The positive statistical correlation between LL and PI described for smectitic and kaolinitic clays (Spagnoli et al., Reference Spagnoli, Sridharan, Oreste, Bellato and Matteo2018) was also observed in the Santa Maria clays, where a greater LL was associated with greater PI, reflecting consistent mineralogical control.
Santa Maria clay samples projected onto the Casagrande diagram (Casagrande, Reference Casagrande1932).

Figure 8 Long description
A scatter plot with the horizontal axis labeled Liquid limit (LL) and tick labels 30, 40, 50, 60, 70. The vertical axis is labeled Plasticity index (PI) and tick labels 0, 10, 20, 30, 40, 50. Two diagonal dashed reference lines are labeled U-line and A-line. A legend lists STM1, STM2, STM3, STM4A, STM4B, STM5, STM6, STM7A, STM7B, STM8, STM9, STM10A, STM10B, STM10C, STM11, STM12, STM13, STM14, STM15, STM16, each shown with a distinct marker. Plotted points form an upward pattern from lower liquid limit and lower plasticity index toward higher liquid limit and higher plasticity index. A dense cluster of points appears around liquid limit values in the high 30s to mid 40s and plasticity index values around 10 to 30. Several points appear at higher liquid limit values around 50 to 60 with plasticity index values around 30 to 40.
Plasticity controls workability, extrusion pressure, drying sensitivity and defect formation in red-ceramic bodies (Modesto & Bernardin, Reference Modesto and Bernardin2008), whereby a PI of 15–35% and a LL of 35–55% can deliver a good balance between moldability and dimensional stability for bricks, roofing tiles and porous ceramics (Rat et al., Reference Rat, Martínez-Martínez, Sánchez-Garrido, Pérez-Villarejo, Garzón and Sánchez-Soto2023). Within this classification, most of the Santa Maria clays are projected within the good-plasticity window, suggesting good intrinsic workability for extrusion and press-moulding without requiring large additions of plasticizers or non-plastic temper. The PI/LL ratio was proposed as an indicator of hardening behaviour, with higher PI/LL ratio values associated with greater stiffness gain upon drying and firing (Nicolás et al., Reference Nicolás, Chávez, Vlasova and Puig2024). The PI/LL ratios of the Santa Maria clays ranged between 0.24 (STM7B) and 0.76 (STM2), consistent with the values reported for successful low-temperature brick bodies and porous ceramic formulations (Rat et al., Reference Rat, Martínez-Martínez, Sánchez-Garrido, Pérez-Villarejo, Garzón and Sánchez-Soto2023), suggesting that these clays will develop adequate green strength and fired cohesion for structural products.
Most of the Santa Maria clays were plotted within fields B and C in the SiO2–Al2O3–TF ternary diagram (Fig. 9; Strazzera et al., Reference Strazzera, Dondi and Marsigli1997), with several points extending towards field D. This reflects moderate to high flux contents (i.e. Fe2O3 often >15 wt.%), very low CaO–MgO–K2O–Na2O contents and variable SiO2/Al2O3 ratios (Table 1). Such a composition is consistent with low to moderate firing temperatures, early onset of vitrification and good suitability for structural ceramics, including bricks, blocks and roofing tiles. Samples plotted closest to the high-flux field D showed a consistent behaviour with their relatively elevated Fe2O3 content (up to 31.08 wt.%). Iron oxides, although classified as fluxing agents in the SiO2–Al2O3–TF ternary diagram, also act as strong chromophores; therefore, these samples may produce more intensely red to reddish-brown fired colours (Murad & Wagner, Reference Murad and Wagner1998). The chemical compositions suggested enhanced vitrification at lower temperatures, although also a higher risk of drying shrinkage and deformation if not blended with more refractory materials (Lima Santana et al., Reference Lima Santana, Silva, Gonçalves, Cartaxo, Lira, Santos and Menezes2012). By contrast, samples positioned in fields B and C, such as STM1, STM2, STM8 and STM10A, showed high SiO2 and Al2O3 contents, indicative of a more refractory behaviour. These samples are kaolinite-dominated clays, with a later vitrification onset, higher firing temperatures and weaker flux-driven sintering typical of kaolinitic clays derived from volcanic rocks (Garcia-Valles et al., Reference Garcia-Valles, Cuevas, Alfonso and Martínez2022). Such compositions are used industrially to control shape retention and reduce deformation in ceramic mixtures (Rat et al., Reference Rat, Martínez-Martínez, Sánchez-Garrido, Pérez-Villarejo, Garzón and Sánchez-Soto2023). The SiO2–Al2O3–TF ternary diagram was supported by the weathering pathways inferred from CIA and mineralogical data, with the dominance of samples within fields B and C reflecting strong depletion of Ca–Na–K and enrichment in Al and Fe, characteristic of advanced chemical alteration of basaltic and trachytic parent materials, which yields kaolinite, smectite and Fe-oxyhydroxides (Nesbitt & Young, Reference Nesbitt and Young1982; Khademi & Arocena, Reference Khademi and Arocena2008). Samples STM4A and STM16, containing palygorskite, were plotted towards a higher SiO2/Al2O3 ratio and lower TF content, consistent with pedogenic formation in Mg-rich, semi-arid or evaporitic microenvironments (Khademi & Arocena, Reference Khademi and Arocena2008), confirming that palygorskite-bearing clays behave as moderately refractory materials, requiring higher firing temperatures and participating less intensely in vitrification (Assis et al., Reference Assis, Cerqueda, Souza, Jesus, Marçano and Simões2019; Idoum et al., Reference Idoum, Tiskatine, Mounir, Bammou and Aharoune2024). The smectitic sample STM6, despite its high CIA, was plotted closer to flux-rich compositions due to its Fe2O3 content, explaining the higher plasticity, greater shrinkage and tendency for early vitrification. The compositional variability of the Santa Maria clays allows the formulation of blended bodies, in which more plastic, flux-rich materials (e.g. STM6, STM12, STM15) are combined with more refractory, low-plasticity clays (STM1–STM4) to optimize technological performance (Rat et al., Reference Rat, Martínez-Martínez, Sánchez-Garrido, Pérez-Villarejo, Garzón and Sánchez-Soto2023). Thus, samples fall within compositional ranges typically associated with red ceramic bodies, without exhibiting either excessively refractory or fusible characteristics.
Santa Maria clays projected onto the SiO2–Al2O3–TF ternary diagram, representing potential ceramic behaviour: A = white bodies (stoneware tiles) with high SiO2 contents; B = red bodies (stoneware tiles), suitable for structural ceramics; C = clays with low carbonate contents; D = highly fluxed materials (high carbonate contents) with early sintering tendencies (adapted from Strazzera et al., Reference Strazzera, Dondi and Marsigli1997).

Figure 9 Long description
A ternary scatter plot on a triangular grid. The three axes are labeled SiO subscript 2, Al subscript 2 O subscript 3 and TF, with percentage markings shown on the triangle. The bottom left corner shows 60 percent next to Al subscript 2 O subscript 3. The bottom right corner shows 60 percent next to TF. Two 0 percent labels appear near the SiO subscript 2 corner. Four outlined fields are labeled A, B, C and D. Field A is a dashed outline on the left side of the triangle. Field B is an outline around the central cluster. Field C is a dashed outline below the central cluster. Field D is an outline to the right of the central cluster. Multiple STM sample points are plotted as square markers. The highest density of points is within and around fields B and C. Several points extend from the central cluster toward field D, including one point positioned deeper inside field D than the others. Fewer points appear toward the left side near field A. A legend lists STM1 through STM16, including STM4A, STM4B, STM7A, STM7B, STM10A, STM10B and STM10C. Each STM label is paired with a distinct marker appearance used to distinguish individual samples.
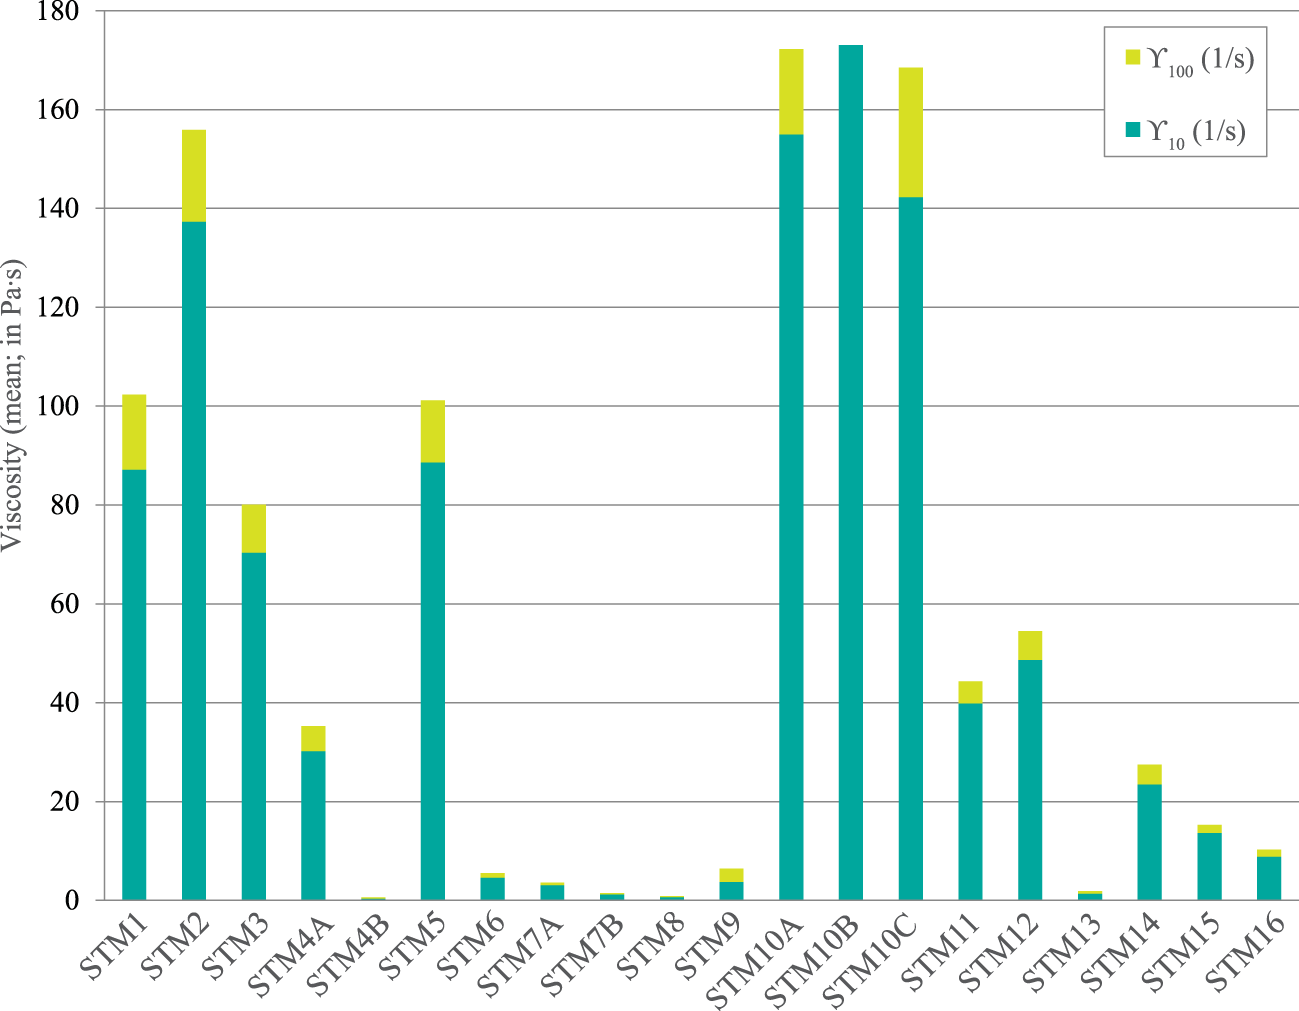
Viscosity tests were performed by recording the steady-state viscosity (η) as a function of shear rates (ϒ) of 10 and 100 s–1. Significant differences were observed (Fig. 10), reflecting textural, mineralogical and chemical variations, which are relevant for predicting the behaviour of these materials during ceramic processing, particularly in shaping techniques such as extrusion, stiff-mud forming and slip casting. Most samples exhibited a substantial decrease in viscosity with increasing shear rate, suggesting a typical shear-thinning (pseudoplastic) behaviour. Shear-thinning behaviour dominates in clay–water systems and is attributed to the progressive alignment of plate-like particles, the breakdown of edge–face associations and the release of interparticle water under shear (Mewis & Wagner, Reference Mewis and Wagner2012). Sample viscosity at 10 s–1 ranged from <5.0 Pa (STM4B, STM6–9 and STM13) to >70 Pa (STM1–3, STM5, STM10A–C), while viscosity at 100 s–1 dropped abruptly in all samples, confirming the breakdown of interparticle networks under stress. Clay suspensions with finer particles and higher specific surface area typically exhibit greater viscosities due to increased van der Waals forces and double-layer repulsion (Adeyinka et al., Reference Adeyinka, Samiei, Xu and Masliyah2009). Surface charge, reflected by the pH and chemical composition, also influences rheology, with Santa Maria clays displaying moderately acidic to neutral pH, which favours edge–face flocculation, especially in Fe-rich systems, once Fe-oxides and Fe-oxyhydroxides increase interparticle bridging, thereby increasing viscosity (Niu et al., Reference Niu, Li, Liu, Wang and Wang2025). High-viscosity samples may require greater water contents or dispersants during extrusion and wet milling, displaying a strong shear-thinning behaviour that is advantageous in forming processes, where high viscosity at rest stabilizes the shape, while low viscosity under shear facilitates flow (Funk & Dinger, Reference Funk and Dinger1994). Low-viscosity samples are easier to process but may show poor structural stability during shaping, and they will often need to be blended with more plastic or smectitic materials to achieve adequate workability, while the medium-viscosity samples present rheological properties of structural ceramics compatible with stiff-mud extrusion, tile pressing and slip preparation (Vitali & Giorgini, Reference Vitali and Giorgini2019). The rheological test showed that the Santa Maria clays constitute a heterogeneous system, from nearly Newtonian kaolinitic slurries (Baird & Walz, Reference Baird and Walz2007) to highly pseudoplastic smectitic gels (Morariu et al., Reference Morariu, Lămătic and Bercea2009), suggesting that blending strategies may be required to optimize rheology for extrusion, tile bodies or slip casting.
Santa Maria clay mean viscosity values.

Figure 10 Long description
The bar graph has a legend with two entries: Y subscript 100 left parenthesis 1 slash s right parenthesis and Y subscript 10 left parenthesis 1 slash s right parenthesis. The vertical axis label reads: Viscosity left parenthesis mean right parenthesis comma in P a times s. The vertical axis ranges from 0 to 180. The horizontal axis lists sample labels: S T M 1, S T M 2, S T M 3, S T M 4 A, S T M 4 B, S T M 5, S T M 6, S T M 7 A, S T M 7 B, S T M 8, S T M 9, S T M 10 A, S T M 10 B, S T M 10 C, S T M 11, S T M 12, S T M 13, S T M 14, S T M 15, S T M 16. Each sample has a stacked vertical bar with two segments corresponding to the legend entries. S T M 1: total bar height about 102. S T M 2: total bar height about 156. S T M 3: total bar height about 80. S T M 4 A: total bar height about 35. S T M 4 B: total bar height about 1. S T M 5: total bar height about 101. S T M 6: total bar height about 5. S T M 7 A: total bar height about 3. S T M 7 B: total bar height about 1. S T M 8: total bar height about 1. S T M 9: total bar height about 6. S T M 10 A: total bar height about 172. S T M 10 B: total bar height about 173. S T M 10 C: total bar height about 169. S T M 11: total bar height about 44. S T M 12: total bar height about 54. S T M 13: total bar height about 2. S T M 14: total bar height about 27. S T M 15: total bar height about 15. S T M 16: total bar height about 10.
Summary and conclusions
The clayey materials of Santa Maria Island (Azores, Portugal) formed by intense chemical weathering of basaltic–andesitic volcanic soils and associated deposits, as is indicated by their high CIA values and low CaO–Na2O contents. This weathering produced thick residual regoliths dominated by secondary phyllosilicates and Fe-oxides, locally complemented by fine-grained marine clays, generating a diversified but coherent set of clayey raw materials. Texturally, most samples were fine-grained, with high proportions of the <0.063 mm fraction, suitable for moulding, particle packing and sintering in structural ceramics. The coexistence of very-fine-grained, clay-rich materials and coarser, quartz-bearing horizons gives a natural basis for blending plastic and non-plastic fractions, although the finest samples may require tempering and the coarsest samples may need milling to optimize ceramic formulations. The total phyllosilicates, mainly kaolinite, with local smectite, palygorskite and minor mixed-layer illite–smectite, dominated the clays, and they were complemented with minor quartz, Fe-oxides, Ti-oxides and scarce feldspars, which contribute to their good plasticity, green strength and development of red to reddish-brown colours, with Al2O3 supporting mullite formation and Fe2O3 and alkalis providing fluxes for sintering. Samples with smectite and palygorskite showed higher CEC, plasticity and abrasivity, suggesting their use as plastic or reactive components in blends rather than as standalone bodies. Consistency and rheological results showed that most of Santa Maria clays fall within suitable plasticity ranges for stiff-mud extrusion and press-moulding and exhibit predominantly shear-thinning behaviour, from nearly Newtonian kaolinitic slurries to highly pseudoplastic smectitic gels. In the SiO2–Al2O3–TF ternary diagram, the clays plot mainly within fields B and C, and locally within field D, suggesting their suitability for structural red ceramics at low to intermediate firing temperatures. Further technological evaluation, including formulation trials and firing tests, is currently underway to validate these mineralogical, chemical and rheological indications and to optimize the performance of Santa Maria Island clays for industrial ceramic applications.
Supplementary materials
The supplementary material for this article can be found at https://doi.org/10.1180/clm.2026.10028.
Author contributions
Methodology: FR and CC; validation: FR and CC; formal analysis: CCC and CS; investigation: FR and CC; writing – original draft preparation: FR and CC; writing – review and editing: FR and CC; supervision: FR and CC; funding: FR. All authors have read and agreed to the published version of the manuscript.
Financial support
This work was partially supported by the GeoBioTec (UIDB/04035/2025; https://doi.org/10.54499/UID/04035/2025) Research Centre, funded by FEDER funds through the Operational Program Competitiveness Factors COMPETE and by national funds through FCT.
Competing interests
The authors declare none.
Data availability
The raw data supporting the conclusions of this article will be made available by the authors on request.