Over the past 50 years, twin and adoption research has revealed much about the origins of individual differences in behavior. We know that genetic factors influence individual differences in a wide range of psychological outcomes, in part because genetic factors appear to contribute substantially to both the stability of behavior and behavioral change. We also know that the genetic and environmental factors that influence a specific behavioral outcome are not necessarily statistically independent, yet we do not expect them to be additive in their effect. The emergence of the concept of gene–environment correlation (not to be confused with Gene × Environment [G × E] interaction) in the psychological literature arose out of a need to account for what might seem a paradoxical result, at least initially: genetic factors appear to contribute to differences in a wide array of environmental measures, including peer-group characteristics, features of the parent–child relationship, exposure to psychological stress, and marriage and divorce (Kendler & Baker, Reference Kendler and Baker2007). The paradox is resolved by recognizing that environments are not distributed randomly: Individuals can have a major impact in shaping their experiences both directly, through the choices they make, and indirectly, through the reactions their behaviors elicit from others (Jaffee & Price, Reference Jaffee and Price2007; Scarr & McCartney, Reference Scarr and McCartney1983). The concept that genetic and environmental factors interact in their effects has been enthusiastically embraced by psychologists; G × E interaction research is one of the most rapidly expanding research paradigms within psychology (Dick, Reference Dick2011).
Today, the field of behavioral genetics is at a crossroads. The twin and adoption studies that helped establish that important psychological outcomes are influenced by genetic factors in the aggregate are increasingly giving way to molecular genetic investigations aimed at characterizing the nature of the contribution of specific genetic variants. This transition has not been entirely smooth. Reports of associations between specific genetic variants and behavior have been notoriously difficult to replicate, and the validity of research investigating the interaction between specific functional genetic variants and the environment has recently been called into question (Duncan & Keller, Reference Duncan and Keller2011; Risch et al., Reference Risch, Herrell, Lehner, Liang, Eaves and Hoh2009). How we think about the genetics of behavior is likely to be further challenged by recent developments in genomic science, which allow psychological researchers today to efficiently and economically interrogate vast numbers of genetic variants and will allow us in the not too distant future to sequence the entire genomes of our research participants. Genetically minded researchers will soon be awash with genetic data. Now is the time to consider the implications of this new type of genetic data and especially how it can be integrated with our knowledge of the nature of environmental influence to bring about a better understanding of individual differences in, and developmental etiology of, behavior and mental illness.
This paper is concerned with the impact of recent developments in genomics on the study of human behavior. It begins by describing those developments. Because genomics has been applied primarily to nonbehavioral phenotypes, a discussion of the challenges uniquely associated with behavioral phenotypes follows. This includes a discussion of what we have learned from twin and adoption research about how best to assess the phenotype and conceptualize the nature of environmental influence and, most critically, about how genes, environment, and development can be integrated to move psychology forward. Finally, we describe ongoing developments in genomics that are likely to soon have an impact on behavioral research and speculate about what the nature of what that impact is likely to be. Unfortunately, most of current genomics research on human behavior is not developmentally informed; we emphasize the importance of a developmental perspective throughout.
Genome-Wide Association Study (GWAS): Genomics in a Postgenomic World
The heritability estimates derived from twin and adoption studies imply that aggregate differences in the DNA sequences we inherit contribute in some way to differences in our behavior. The conclusion of the Human Genome Project (for a discussion, see Lander, Reference Lander2011) has ushered in an era of precisely measured genomic variation. At the time of this writing, it is possible to obtain your entire sequence of DNA, approximately 3.5 billion base pairs, for a couple thousand dollars. The genetic information currently used in candidate gene studies by social and behavioral scientists is a mere fraction of the total variation, and it represents only the tip of the genomic iceberg. This section lays the foundation for our discussion of how to incorporate a developmental perspective into modern behavioral genetic studies by briefly cataloging common forms of genetic variation, describing how behavioral scientists have typically investigated this variation, and discussing how these behavioral investigations are likely to change due to recent technological developments within genomics.
Human DNA structure and variability
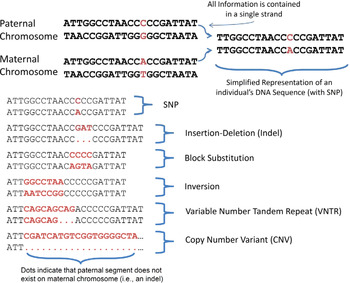
Normal human DNA is contained in 23 chromosomes: 22 autosomes and 1 sex chromosome. Humans also have small segments of DNA residing in cell mitochondria. We focus here on chromosomal DNA. Each autosome has two copies: one copy from the mother and one from the father. Each copy is composed of base pairs of nucleotides, which are adenine (A), thymine (T), cytosine (C), and guanine (G). The nucleotides are always found in pairs, and the same nucleotides always pair with each other. An example autosomal segment along with major types of DNA variation can be found in Figure 1.
Common forms of DNA variation. Humans have two chromosomes, one inherited from their father (paternal) and one from their mother (maternal). Because the same bases always pair together in a single chromosomal strand (A with T; C with G), giving both pairs for each strand is redundant, and DNA sequences are therefore represented by two rows of bases (“Simplified Representation” in the figure). The CA single nucleotide polymorphism (SNP) represents the only difference between the maternal and paternal autosomal segments. Cataloged in this figure is the SNP as well as several common types of structural variation, including insertion/deletions, block substitutions, inversions, variable number tandem repeats, and copy number variants. Note that these particular variants are illustrative and that variation is not necessarily within person. For example, this individual is heterozygous for the SNP, but other individuals may be homozygous CC or homozygous AA. The same is true for structural variants. In the indel example, this individual has a GAT insertion on the paternal chromosome and no such insertion on the maternal chromosome. Another individual may have GAT insertions on both chromosomes; yet another individual may lack the GAT insertion altogether. [A color version of this figure can be viewed online at http://journals.cambridge.org/dpp]

Single nucleotide polymorphisms (SNPs) represent one major source of genetic variation, with over 15 million SNPs identified in humans as of this writing (Altshuler et al., Reference Altshuler, Durbin, Abecasis, Bentley, Chakravarti and Clark2010). An example SNP is given in Figure 1, where a single base pair differs between the maternal and paternal autosomal segment. Of the 15 million cataloged SNPs, only about 10 million are considered common in that they have a minor allele frequency greater than 0.05 in one or more populations (the frequency in the population of the less frequently occurring, or minor, allele). Note that the rarity and the definition of the minor allele is population specific. A particular allele might be common in one population (e.g., individuals of Han Chinese descent) and rare or even nonexistent in another (e.g., individuals of Yoruban descent; see The International HapMap Consortium, 2003). Whatever racial population is under study, it is the common SNPs, not the rare SNPs, that have been the focus of most genetics research. This is because, all else being equal, the larger the minor allele frequency, the greater the power to detect an effect (Bansal, Libiger, Torkamani, & Schork, Reference Bansal, Libiger, Torkamani and Schork2010). Simply put, the typical sample will not contain many individuals carrying rare SNP alleles, so a focus on common SNPs is driven in large part by pragmatics. There are many examples of studies of SNPs within psychology. Perhaps most familiar among these is the Val158Met (rs4680) polymorphism in catechol-O-methyltransferase (COMT), which involves a single base pair substitution that changes the coding sequence of the gene (Meyer-Lindenberg et al., Reference Meyer-Lindenberg, Nichols, Callicott, Ding, Kolachana and Buckholtz2006).
SNPs have been the primary focus of behavioral genetics research because they can be efficiently genotyped and have consequently been extensively mapped, but it is important to recognize that other types of genetic variants are likely also to be relevant to understanding behavior. Insertions/deletions (indels) are variants where a small number of DNA bases (usually < 100 bases) is either inserted into or deleted from the DNA sequence. The most prominent indel in psychology involves a 44-base deletion in the promoter region of the gene that codes for the serotonin transporter (5-HTT; Heils et al., Reference Heils, Teufel, Petri, Stober, Riederer and Bengel1996). Variable numbers of tandem repeats (VNTRs) represent another form of genetic variation. VNTRs involve a short segment of DNA that is repeated in tandem, but where the number of repeats varies from person to person. The most widely studied VNTR in psychology involve a 48-base sequence in the coding sequence of the dopamine receptor D4 gene that is repeated from 2 to 10 times (Lichter et al., Reference Lichter, Barr, Kennedy, Vantol, Kidd and Livak1993). Finally, copy number variants (CNVs) are relatively long sequences of DNA (100,000 bases or more) where individuals can carry other than the typical two copies. Although CNVs are generally rare, they have been implicated in multiple diseases, including autism and schizophrenia (Stankiewicz & Lupski, Reference Stankiewicz and Lupski2010).
Although it might seem that comprehensive assessment of common SNP variations would require genotyping research participants on each of the 10 million common SNPs, a small fraction of this number would suffice. This is because SNPs that are located near one another on the same chromosome tend to be correlated with one another, a phenomenon known as linkage disequilibrium (LD). Chromosomes are not transmitted across generations unaltered. Rather, during meiosis, when homologous chromosomes pair up, there is an opportunity for an exchange, or recombination, of genetic material between the maternally inherited and the paternally inherited chromosomes. The greater the distance between two markers, the more likely it is that the markers will recombine. Rather than occur randomly, however, recombination takes place most frequently at recombination hotspots along the chromosome. SNPs that are located within the same resulting chromosomal block will consequently tend to be passed along together to the next generation, and knowing one SNP in the block allows one to infer the others with a high degree of certainty. The upshot is that a minority of well-chosen SNPs (e.g., 1 million) contain information about nearly all the common SNPs in the genome: the well-chosen SNPs serve as proxies for neighboring SNPs in high LD (Hirschhorn & Daly, Reference Hirschhorn and Daly2005).
Until a few years ago, the existence of LD did little more than allow geneticists to speculate about the possible impact of comprehensively surveying common variation throughout the entire genome (Risch & Merikangas, Reference Risch and Merikangas1996). The advent of high-throughput SNP genotyping, however, allowed speculation to become a reality. The first GWAS was a proof of principle sponsored by the Wellcome Trust and involved genotyping nearly 500,000 SNPs in 14,000 cases, representing seven different inherited disorders and a common control sample of 3,000 (Burton et al., Reference Burton, Clayton, Cardon, Craddock, Deloukas and Duncanson2007). This initial GWAS tentatively identified 24 SNPs as being associated with one of the seven disorders and spurred hundreds of subsequent GWAS that have resulted in the identification of several thousand SNP associations (Visscher, Brown, McCarthy, & Yang, Reference Visscher, Brown, McCarthy and Yang2012). Although this GWAS posed several methodological challenges, such as how to deal with the multiple-testing burden (Hirschhorn & Daly, Reference Hirschhorn and Daly2005) or how to control for subtle population differences (such as ethnicity) between cases and controls (Kang et al., Reference Kang, Sul, Service, Zaitlen, Kong and Freimer2010; Price et al., Reference Price, Patterson, Plenge, Weinblatt, Shadick and Reich2006), for the most part these issues have been addressed and a GWAS analysis today involves little more than a simple exercise of fitting an additive regression model, albeit repeated hundreds of thousands and even millions of times.
GWAS of anthropometric measures, medical diseases, and behavioral traits
Although the statistical exercise is simple, reliable identification of significant GWAS associations has been challenged by two factors. First, addressing the multiple-testing burden requires use of a statistical significance threshold of p < 5 × 10⁻⁸ (Hirschhorn & Daly, Reference Hirschhorn and Daly2005). Second, the effect associated with any specific SNP is very small, typically accounting for less than 0.5% of the variance in the trait.
Addressing these challenges requires sample sizes that are typically beyond the capabilities of any single investigator. For example, to have 80% power to detect an effect accounting for 0.1% of variance using the GWAS p value threshold would require a sample of nearly 40,000 individuals. Detection of these small effects has motivated the establishment of large consortia, combining GWAS findings using meta-analytic methods. A consortium on height used data from over 180,000 individuals to identify 180 SNP variants that collectively accounted for approximately 10% of the variance in height (Allen et al., Reference Allen, Estrada, Lettre, Berndt, Weedon and Rivadeneira2010). Consortia for body mass index (BMI; nearly 250,000 individuals, 18 variants identified, and 1.5% of variance accounted for; Speliotes et al., Reference Speliotes, Willer, Berndt, Monda, Thorleifsson and Jackson2010) and blood lipids (more than 100,000 individuals, 95 identified variants, 10%–12% of variance accounted for; Teslovich et al., Reference Teslovich, Musunuru, Smith, Edmondson, Stylianou and Koseki2010) have produced similar results. Because the percentage of phenotypic variance accounted for by known SNPs is far less than heritability estimates from twin and family studies, researchers have concluded that much of trait heritability remains “missing” (Manolio et al., Reference Manolio, Collins, Cox, Goldstein, Hindorff and Hunter2009).
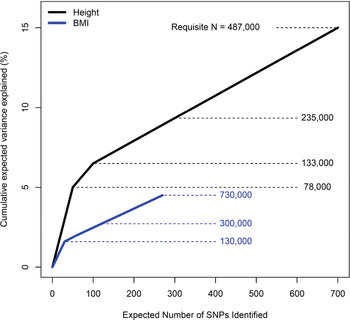
The challenge associated with finding the missing heritability is heightened in recognizing that the SNPs identified thus far are likely the low-lying fruit, those with the largest effect sizes. Accounting for greater percentages of variance will require ever-larger samples to identify even smaller SNP effects. Figure 2 illustrates the projected sample sizes needed for height and BMI to increase the variance being accounted for by identified SNPs. For height, to increase from the current 10% to 15% will require a combined sample of 487,000 individuals. For BMI, going from the 1.5% that is accounted for now to a mere 5% will require a projected sample size of 730,000.
Sample sizes and number of single nucleotide polymorphisms (SNPs) required to explain significant proportions of variance in anthropometric traits. These data are based on visual inspection of graphs provided in Allen et al. (Reference Allen, Estrada, Lettre, Berndt, Weedon and Rivadeneira2010) and Speliotes et al. (Reference Speliotes, Willer, Berndt, Monda, Thorleifsson and Jackson2010); see the original sources for full details. Note the wide difference in trend for height (estimates based on sample of ~185,000 subjects) and for body mass index (BMI; estimates based on sample of ~235,000 subjects). Height is much more promising, in that it will take ~500,000 samples to obtain enough genome-wide significant SNPs to account for 15% of the variance in height. In contrast, for BMI it is projected that ~700,000 samples are required to account for only 5% of the variance in height. The cause of the discrepancy in genetic architecture of these traits is unknown. These values differ slightly from what is described in the text because extrapolating beyond currently available sample sizes required sample splitting and replication procedures in the original studies for an unbiased estimate of effect sizes. [A color version of this figure can be viewed online at http://journals.cambridge.org/dpp]

As with anthropometric traits, large samples have been needed to reliably identify SNP effects in GWAS of behavioral and psychiatric traits. A meta-analysis (de Moor et al., Reference de Moor, Boomsma, de Geus, Willemsen, Hottenga and Distel2009) of 17,375 individuals assessed for Big 5 personality traits returned one genome-wide significant SNP for openness, and one for conscientiousness, neither of which were subsequently replicated in a small sample (N = 3,294). A genome-wide meta-analysis of alcohol consumption (Schumann et al., Reference Schumann, Coin, Lourdusamy, Charoen, Berger and Stacey2011) returned one SNP identified in a discovery sample of 26,316 individuals and replicated in a sample of 21,185, and a recent GWAS investigation of more than 12,000 individuals with bipolar disorder and 50,000 controls reported 18 replicated SNP effects (Sklar et al., Reference Sklar, Ripke, Scott, Andreassen, Cichon and Craddock2011). Unfortunately, most of the heritable variance for behavioral phenotypes remains missing. For example, a GWAS analysis of more than 3,000 individuals with schizophrenia and more than 3,000 controls was able to account for approximately 3% of the variance in schizophrenia liability (Purcell et al., Reference Purcell, Wray, Stone, Visscher, O'Donovan and Sullivan2009), far less than the estimated 80% liability heritability for schizophrenia.
However, accounting for missing heritability may not be a simple matter of achieving ever-larger pooled sample sizes if the relevant genetic variation is not being captured by the GWAS platforms being used. Genome-wide complex trait analysis (GCTA; Yang, Lee, Goddard, & Visscher, Reference Yang, Lee, Goddard and Visscher2011; Yang, Manolio, et al., Reference Yang, Manolio, Pasquale, Boerwinkle, Caporaso and Cunningham2011), is a statistical method that uses the genetic relatedness among individuals, as measured by the genotyped SNPs, to estimate the variance in the phenotype accounted for by the aggregate of all those SNPs. The method can be likened to a twin study, except that instead of using twin zygosity to estimate genetic relatedness, GCTA uses the aggregate genetic similarity, as estimated by the genotyped SNPs, among each pair of research participants in a sample. Consequently, although GCTA does not tell us which of the million or so genotyped SNPs contribute to phenotypic variance, it does tell us how much variance the relevant SNPs would account for if we could sift them out. In a sample of only about 4,000 individuals, Yang et al. (Reference Yang, Benyamin, McEvoy, Gordon, Henders and Nyholt2010) found that the genotyped common SNPs accounted for 45% of the variance in height, a great deal more than the 10.5% of variance found by the Allen et al. (Reference Allen, Estrada, Lettre, Berndt, Weedon and Rivadeneira2010) meta-analysis of approximately 185,000 individuals, but still a far cry from the 80% heritability routinely identified in twin studies. GCTA has been similarly used in large samples to estimate the variance accounted for by genotyped common SNPs to be 23% for schizophrenia (Lee et al., Reference Lee, Decandia, Ripke, Yang, Sullivan and Goddard2012) and 40%–50% for general cognitive ability (Davies et al., Reference Davies, Tenesa, Payton, Yang, Harris and Liewald2011), values both well below heritability estimates for these phenotypes derived from twin and family data. Consequently, although much of the heritability of complex phenotypes could, in principle, be accounted for by the SNPs genotyped in GWAS, clearly a large portion of the heritability would remain missing even if we could achieve pooled samples in the multiple millions. In all likelihood there are sources of genetic variance in addition to common SNPs, and the additive regression model that has been the basis of GWAS analysis may need to be extended to consider nonadditive effects.
Although GWAS has been successful in identifying a large number of SNP variants for a large number of important traits, some researchers have expressed disappointment that SNP effects have been uniformly small and that the vast majority of heritable variance remains missing (Gershon, Alliey-Rodriguez, & Liu, Reference Gershon, Alliey-Rodriguez and Liu2011). Nonetheless, GWAS has moved the field beyond a research agenda being driven by a few false-positive genetic findings (Ioannidis, Castaldi, & Evangelou, Reference Ioannidis, Castaldi and Evangelou2010). We believe the question now is not so much whether GWAS has worked as it is how we can use what we have learned about the genetic architecture of complex phenotypes to better understand the origins of individual differences in behavior. We are optimistic about the future of genetically informed behavioral research, especially if that research builds on what we have learned about the nature of heritable variation for behavioral traits, involves a consideration of environmental and developmental context, and expands to consider sources of genetic variance other than the common SNPs that have been the focus of GWAS.
The Nature of the Behavioral Phenotype
Phenotypic definition and measurement
Despite a long history in psychology of measurement and assessment, much work on the genetics of psychiatric disease has focused on diagnostic status or symptomatology of mental disorder categories defined by the Diagnostic and Statistical Manual of Mental Disorders (DSM; American Psychiatric Association, 2000). In part, this is a practical issue: DSM diagnoses and symptoms are often gathered as part of standard assessment protocol. This makes DSM-related measurements useful because they can easily be combined across studies in meta-analytic style, which has become standard practice in genetics.
Although a categorical measurement of disease status may effectively facilitate the pooling of resources, it may not be an optimal way to measure disease and/or a trait. It is well known that binary diagnoses throw away an immense amount of information, and have lower statistical power compared even to rough quasicontinuous measures of the same constructs, like symptom counts (Markon, Chmielewski, & Miller, Reference Markon, Chmielewski and Miller2011). It is rarely true in psychology that a binary classification is better for statistical analysis than a quasicontinuous one (Grove, Reference Grove1991), but arguments favoring the use of quantitative indicators is not based on statistical power alone. Some of the phenotypic measurements of interest to psychopathologists appear to be better represented by continuous dimensions of variation rather than as discrete entities (Krueger, Markon, Patrick, & Iacono, Reference Krueger, Markon, Patrick and Iacono2005; Vrieze, Perlman, Krueger, & Iacono, Reference Vrieze, Perlman, Krueger and Iacono2011; although see Grove & Vrieze, Reference Grove, Vrieze, Millon, Kruger and Simonsen2010; and Vrieze, Reference Vrieze2012), a conclusion that has moreover been consistently supported in behavioral genetic research.
Used well, measurement models inform the nature and etiological structure of a phenotype for behavioral genetic investigations. For example, alcohol, nicotine, and cannabis dependence have long been considered as technically separate conditions in the DSM, but work during the last decade indicates that a significant proportion of etiology among them is shared and is largely genetic in origin (Kendler, Jacobson, Prescott, & Neale, Reference Kendler, Jacobson, Prescott and Neale2003). Factor analytic approaches give single-factor solutions, suggesting similar shared causal mechanisms among nicotine, alcohol, marijuana, and illicit drugs (Hicks, Schalet, Malone, Iacono, & McGue, Reference Hicks, Schalet, Malone, Iacono and McGue2011; Krueger et al., Reference Krueger, Hicks, Patrick, Carlson, Iacono and McGue2002), which begs the question of what these shared causes might be. One popular answer involves the gateway hypothesis (Kandel & Jessor, Reference Kandel, Jessor and Kandel2002), where it is proposed that the use of one drug causes use of another. Perhaps individuals use multiple drugs in their search for bigger and better highs, resulting in the strong correlations that are observed among substance dependence symptoms. Another hypothesis is that more impulsive, sensation-seeking individuals are more likely to experiment indiscriminately with drugs, and will use and become addicted to multiple drugs simultaneously, which would also result in observed correlations among different drugs. This has been termed the disinhibitory hypothesis, holding that the more disinhibited one is, the more likely one is to experiment and use indiscriminately (Iacono, Malone, & McGue, Reference Iacono, Malone and McGue2008).
Like many etiological theories, the gateway and disinhibitory hypotheses are developmental, in that they hypothesize the existence of etiological processes that progress, over time, to pathological behaviors such as drug abuse or addiction. Rigorous testing of these hypotheses requires developmentally informed sampling and measurement, likely not new ideas to readers of this journal. More novel, perhaps, is the utility of genetically informative designs, even in cases where one is not explicitly interested in the role of genetic factors. For example, Irons, McGue, Iacono, & Oetting, (Reference Irons, McGue, Iacono and Oetting2007) used a genetic design called Mendelian randomization (MR; Smith, 2011) to test key predictions of the gateway model. Nearly 50% of individuals of East Asian ancestry inherit a variant in the aldehyde dehydrogenase 2 (ALDH2) gene that diminishes their ability to metabolize alcohol (Luczak, Glatt, & Wall, Reference Luczak, Glatt and Wall2006). Those who inherit the gene variant are likely to experience various signs of dysphoria following ingestion of even a small amount of alcohol and consequently curb their drinking. Inheriting the ALDH2 variant is essentially random, at least among East Asians, and thus provides a natural analog to experimental randomization. The question of relevance here is whether individuals who inherit the ALDH2 variant show, in addition to reduced drinking, diminished rates of the behaviors the gateway model posits to be a consequence of use of gateway substances such as alcohol. Irons et al. (Reference Irons, McGue, Iacono and Oetting2007) found no evidence in support of the gateway model in that rates of nonalcohol substance use and disinhibited behavior did not vary as a function of ALDH2 status among individuals of East Asian ancestry. Nonetheless, one limitation of the (Irons et al., Reference Irons, McGue, Iacono and Oetting2007) study is especially relevant in the current context: Participants were still in late adolescence (average age of 18.3 years), and gateway effects may not emerge until later in development. That is, there may be a Gene × Development (G × D) interaction between ALDH2 and nonalcohol substance use. Continued follow-up of the sample is warranted.
Other research using a variety of designs, summarized by Iacono et al. (Reference Iacono, Malone and McGue2008), has taken a more explicitly developmental perspective to establish that a broad risk for abusing multiple drugs is disinhibitory, at least in adolescence. Relative to adults, adolescents are more disinhibited (Steinberg, Reference Steinberg2007), and one expects correlations among alcohol, nicotine, and marijuana dependence to be highest at younger ages, when individuals’ behavior is more driven by impulsivity and sensation seeking, and then decline over time as the youths age and become more responsible. Vrieze, Hicks, McGue, and Iacono (in press) used a large prospective longitudinal study of twins with measures of substance dependence taken at ages 11, 14, 17, 20, 24, and 29. Although overall rates increased until ages 20–24 and declined thereafter, the correlations among alcohol, nicotine, and marijuana dependence strictly declined from adolescence into young adulthood. In addition, by using the twins we noted G × D interaction. At younger ages, the correlations among nicotine, alcohol, and marijuana were due largely to genetic influences. At older ages, the correlations were more strongly due to nonshared environment. That is, as the individuals aged, their individual life experiences increasingly influenced their propensity to use multiple drugs simultaneously.
Clearly, the same measure of a phenotype, such as symptom counts of alcohol dependence, can be the product of drastically different etiology depending on developmental stage and environmental considerations that exist when the measurement is taken. This can pose serious problems for genetic studies in samples where the genetic etiology of a phenotype is heterogeneous. An excellent example comes from recent research on obesity in which Lasky-Su et al. (Reference Lasky-Su, Lyon, Emilsson, Heid, Molony and Raby2008) found a SNP in the roundabout homolog 1 gene was significantly associated with obesity in pediatric samples but only marginally significant in adult samples, a G × D interaction. In work on skin cancer, Duffy et al. (Reference Duffy, Iles, Glass, Zhu, Barrett and Hoiom2010) identified a SNP in the interferon regulatory factor 4 gene where the T allele was associated with high freckling in adolescents and adults but was only associated with high nevus counts in adolescents. (High nevus counts increase risk of melanoma.) The authors suggest this is likely a G × E interaction: adolescents in this cross-sectional sample sunbathed more frequently and for longer periods than the adults had. The adults and the adolescents had the risk gene, but sun exposure is required to potentiate its effects.
Obvious analogues exist for substance use phenotypes. There are a host of genes that theoretically impact upon propensity for addiction but are irrelevant unless one is exposed to the substance. This appears to be true for the nicotinic receptor, neuronal acetylcholine receptor subunit α-3 (CHRNA3), which was very strongly associated with number of cigarettes smoked per day in a sample of 74,000 current smokers (p < 2.8 × 10−73) but was not associated with smoking initiation in a combined sample of approximately 74,000 smokers and approximately 70,000 nonsmokers (Furberg et al., Reference Furberg, Kim, Dackor, Boerwinkle, Franceschini and Ardissino2010). The effect of CHRNA3 is lost on those who have never smoked. Alcohol metabolism and ALDH2, the gene discussed above responsible for flushing in many individuals of East Asian descent, also is likely not protective for alcoholism until someone starts drinking and thereby feels the effect of that genotype.
The hypothesized existence of heterogeneity in genetic etiology, that different genes are relevant under different environmental or developmental circumstances, is in tension with the most popular current approach to evaluating common variants: combining as many samples as possible through meta-analysis. In the presence of between-sample heterogeneity of genetic associations, meta-analysis can fail (DerSimonian & Kacker, Reference DerSimonian and Kacker2007; Han & Eskin, Reference Han and Eskin2012; Tang, Reference Tang2006), at least for those SNPs that are sample specific (e.g., due to developmental differences between some of the samples in the study). Although this certainly is a problem, it is currently prohibitively difficult to amass phenotypically, developmentally, and environmentally homogenous samples powerful enough to identify common SNP interaction effects. Meta-analysis is not perfect, but if used well it can identify at least those SNPs that transcend whatever heterogeneity exists. New methods are being developed that determine which individual studies in the meta-analysis contain the SNP effect, which likely do not, and which studies are ambiguous (Han & Eskin, Reference Han and Eskin2012). Such tests can provide insight into the source of genetic heterogeneity to guide future efforts. The existence of etiological heterogeneity between diverse samples is important to consider but should not impede efforts at consortia building and GWAS meta-analysis.
Other genotypes, such as those associated with behavioral disinhibition or impulsivity, are theoretically relevant for both initiation and maintenance of use (Zucker, Heitzeg, & Nigg, Reference Zucker, Heitzeg and Nigg2011). Measurements of these traits may show heterotypic continuity (Costello, Mustillo, Erkanli, Keeler, & Angold, Reference Costello, Mustillo, Erkanli, Keeler and Angold2003), in that the same etiological process manifests differently at different stages of development and/or in different environments. For example, problem behavior before age 15, such as tobacco use, alcohol use, trouble with police, and early sexual intercourse, are predictive of psychiatric disorders at age 20, such as nicotine dependence, alcohol dependence, drug dependence, and antisocial personality disorder (McGue & Iacono, Reference McGue and Iacono2005). Studies of familial transmission also suggest a role of heterotypic continuity. Parental substance use or antisocial diagnosis is associated with increased risk for child conduct disorder, attention-deficit/hyperactivity disorder, and oppositional defiant disorder (Bornovalova, Hicks, Iacono, & McGue, Reference Bornovalova, Hicks, Iacono and McGue2010). These studies suggest that part of the genetic predisposition to early childhood problem behavior and disorder is also relevant for adult disorders, even though the phenotypic measures can be quite different.
One can begin to see the importance of phenotypic measurement and developmental etiological theory in understanding a phenotype. Some aspects of the etiology and measurement structure of substance use phenotypes change from adolescence to young adulthood (Vrieze et al., in press) and other aspects appear reliable over time (Bornovalova et al., Reference Bornovalova, Hicks, Iacono and McGue2010; McGue & Iacono, Reference McGue and Iacono2005). Genes found to be associated with substance use, at whatever age, will require developmental elaboration of this kind in order to inform etiology, intervention, and measurement. The overriding goal of behavioral genetics is not to engage in statistical self-indulgence to explain variance in our pet phenotypes but rather to test etiological developmental theories of behavior. With the ever-increasing availability of measured human genomes, we expect an exciting scientific future: genetic findings will force us to discard, amend, and refine theories, leading to improved empirical measures of phenotypes and environments designed to test the refined theory, resulting in ever more genetic, biological, and environmental findings.
We expect a product of this cycle to be a pursuit of phenotypic and endophenotypic refinement. A problem facing those exploring the genetic underpinnings of DSM categories, or most other standard clinical or questionnaire measures, is that whatever utility they have in guiding research and treatment, they are not grounded in biology. This leaves open the question of how useful they can be as target phenotypes in genetic association studies. As discussed, one explanation for the problems encountered identifying replicable genetic associations with psychiatric disorders lies in the possibility that the disorders are too etiologically heterogeneous and complex to facilitate gene finding. An additional complication is that these behavioral phenotypes are far removed from the action of genes at the level of the brain. These brain processes interact with the environmental context to influence various observed pathological behaviors, some constellation of which defines a DSM disorder or trait measurement thereof. An endophenotype approach that targets more directly the genetic architecture of the underlying brain processes may provide a useful complement to investigations focused on DSM categories, symptom counts, and related trait dimensions.
An endophenotype is a heritable, biologically based, objectively quantifiable measure that is associated with a psychiatric phenotype because both share a common genetic influence. Endophenotypes hold promise for gene finding because they are believed to (a) be more proximal to the effects of genes; (b) tap one of many facets of a disorder and thus be more etiologically homogeneous than the associated disorder; (c) be more highly heritable than the disorder, thus likely to produce larger effect sizes and boost GWAS power; or, (d) because the endophenotype deals with an etiologically homogenous facet of the disorder, be associated with fewer genes each of which may be expected to have larger individual effect sizes. To the extent that an endophenotype taps a biological mechanism associated with the development of a disorder, identifying its genetic underpinnings could provide clues regarding how the relevant gene or genes affect brain processes that underpin a disorder. It is unlikely that there are many DSM disorders with a specific neurological etiology and likely that there are different disorders that share underlying neural processes. To the extent that a brain process (e.g., dysfunctional presynaptic prefrontal cortex) heightens risk for the development of more than one disorder (e.g., substance dependence and mood disorders; Goto, Yang, & Otani, Reference Goto, Yang and Otani2010), an endophenotype has the potential to provide leads to genes that affect disparate disorders as well as genes that help explain why certain disorder comorbidity combinations occur. Animal models derived from endophenotypes may be potentially useful for identifying genes, their role in neurodevelopment, and their effects on brain circuitry (Kaffman & Krystal, Reference Kaffman and Krystal2012). Many papers have been written regarding the ideal properties of an endophenotype, with a recent review paper by Iacono and Malone (Reference Iacono and Malone2011) detailing these characteristics from a developmentally informed perspective.
Endophenotypes are by their nature developmental. Their utility for gene finding derives in part from their ability to identify genetic risk in the absence of manifest psychopathology, and a valid endophenotype should predict the subsequent development of a disorder in individuals and their first-degree relatives. The ideal endophenotype would change little with development after a certain age or change in a predictable manner. In addition, it should be relatively stable over time and affected little by changes in state, including changes associated with acute illness and remission of disorder. In their review, Iacono and Malone (Reference Iacono and Malone2011) showed how reduced amplitude of the P300 event-related potential obtained from an oddball task (e.g., Begleiter, Porjesz, Bihari, & Kissin, Reference Begleiter, Porjesz, Bihari and Kissin1984) shows promise as a developmental endophenotype indexing genetic risk for substance abuse and related disorders. This endophenotype is present in the preadolescent offspring of alcoholic fathers, is evident early in life for those who go on to develop substance use disorders, changes with development in predictable fashion (with the developmental trajectory of change itself being genetically influenced), is stable over several year intervals, and is associated with substance use disorders because of likely shared genetic influences. Molecular genetic investigations of P300 amplitude, including GWAS, are now under way.
Despite the promise of endophenotypes, skepticism has surfaced regarding the possibly idealized assumptions on which they are based and the likelihood that they will facilitate gene finding (Flint & Munafo, Reference Flint and Munafo2007). However, it seems clear that the endophenotype strategy has yet to be fully exploited. Multivariate methods targeting the molecular genetic basis of the covariance between the endophenotype and its associated disorder have yet to be fully tested, and using endophenotypes in combination may prove fruitful. Iacono, Carlson, and Malone (Reference Iacono, Carlson and Malone2000) showed that using two endophenotypes in combination was associated with greatly increased risk for developing substance use disorders when compared to either endophenotype alone; that is, the endophenotypes each added incrementally to the prediction of who would develop a substance use disorder. Greenwood, Light, Swerdlow, Radant, and Braff (Reference Greenwood, Light, Swerdlow, Radant and Braff2012), obtained promising multivariate results using a novel bootstrapping approach designed to counter problems associated with multiple testing. In Greenwood et al. (Reference Greenwood, Lazzeroni, Murray, Cadenhead, Calkins and Dobie2011), they simultaneously examined the association among 12 heritable schizophrenia endophenotypes and 1,536 SNPs, covering 94 biologically relevant genes. They found evidence supporting the involvement of 46 genes, including those involved in neurodevelopment, and reported that 8 genes affected 4 or more endophenotypes, suggesting pleiotropy. These studies and others (Iacono, McGue, & Krueger, Reference Iacono, McGue and Krueger2006; Luck et al., Reference Luck, Mathalon, O'Donnell, Hamalainen, Spencer and Javitt2011) demonstrate that it is currently feasible to obtain endophenotype measures on samples numbering in the thousands. Although these Ns are not large by current GWAS standards, with improved statistical methods, pooling across sites, and reliance on putative endophenotypes that show strong construct validity, there is ample reason to be optimistic about the payoff from an optimally applied endophenotype study. Finally, even if endophenotypes do not help in gene identification, once disorder/trait-relevant genes are found, the association of these genes with endophenotypes may help identify relevant brain mechanisms (de Geus, Reference de Geus2010). This, in turn, would not only assist our understanding of the neurobiological effects of specific genetic polymorphisms but also enrich our theoretical understanding of the etiological mechanisms contributing to the development of psychopathology.
Measuring, selecting, and aggregating environments
To disentangle genetic and environmental influences on behavior and disease, behavioral geneticists have traditionally used twins or adoptees and their families, which are well suited to this task. In one test of the disinhibitory hypothesis of substance dependence, Keyes, Legrand, Iacono, and McGue (Reference Keyes, Legrand, Iacono and McGue2008) used an adoption design to evaluate the environmental impact of parental smoking on child tobacco, alcohol, and drug use. In biological children, parental smoking was associated with increased risk for use of all drugs. In adoptive children, it was only associated with a mild increase in smoking and had no association with alcohol or other drug use. A typical family study (of biological parents and children) would have concluded that parental smoking is a risk factor for drug use, without elaboration. Having a genetically informative design, however, elucidated the etiology. That is, parental smoking conveys risk both through an environmentally mediated pathway that appears to be specific to offspring smoking and through a genetically mediated pathway that is general to offspring substance use.
Measuring and defining environments has received much less attention in clinical psychology and psychiatry than phenotypic measurement. This trend is changing, and current efforts such as the PhenX Toolkit (Hamilton et al., Reference Hamilton, Strader, Pratt, Maiese, Hendershot and Kwok2011) devote entire measurement domains to psychosocial history and social environment, providing a total of 30 assessment protocols, ranging from child maltreatment to job strain. The toolkit is a multidisciplinary effort to standardize assessment for the genetic study of complex disease.
Studies of G × E interaction often select candidate environments on the basis of a priori hypotheses. This is more than reasonable when there exists strong a priori evidence that some environment is likely to affect the phenotype differently depending on genotype. However, measures of the environment often correlate, sometimes strongly. A standard measurement approach would model those correlations under the usual assumption that different environmental measures are imperfect measures of the same construct (Cronbach & Meehl, Reference Cronbach and Meehl1955), but this is infrequently explicitly done. For example, in the evaluation of G × E effects of externalizing behaviors, Hicks, South, DiRago, Iacono, and McGue (Reference Hicks, South, DiRago, Iacono and McGue2009) report an average correlation of .31 among adolescent environmental adversity measures, indicating etiological overlap and the potential utility of combining environments through a factor analytic measurement model.
Evaluating defensible aggregate measures of environmental risk might be a preferable starting point for G × E studies. Although such a procedure ignores the possibility of interactions at finer levels of environmental detail, the multiple-testing burden of possible environmental measures times possible SNPs becomes too high too quickly for available sample sizes. Perhaps more to the point, this approach to measuring the environment directly acknowledges that environmental risk exposures seldom occur in isolation. For example, adolescents who use substances tend to have problematic relationships with their parents, to have difficulty performing at school, and to socialize with deviant peers. Rather than focusing on specific environmental risk factors, aggregating environmental measures emphasizes the accumulation of risk across domains in the etiology of problem behavior. Work from our group has demonstrated that individual risk factors can be profitably combined into broader omnibus indicators, providing valuable summaries of environmental risk (Johnson, McGue, & Iacono, Reference Johnson, McGue and Iacono2006; Keyes, Iacono, & McGue, Reference Keyes, Iacono and McGue2007; Legrand, McGue, & Iacono, Reference Legrand, McGue and Iacono1999).
Gene–environment correlational processes, whereby measures of environmental risk come to be heritable, complicate interpretations of associations of the environment with outcome (Scarr & McCartney, Reference Scarr and McCartney1983). For example, peer-group characteristics are substantially correlated with adolescent substance use (Hicks et al., Reference Hicks, South, DiRago, Iacono and McGue2009). Rather than being simply causal, these associations may reflect that the underlying genetic liability for disinhibition can manifest in both choice of peers and decision to experiment with substances (Harden, Hill, Turkheimer, & Emery, Reference Harden, Hill, Turkheimer and Emery2008). A recent meta-analysis documented that gene–environment correlation is pervasive, with the average heritability of measures of psychosocial risk being 27% (Kendler & Baker, Reference Kendler and Baker2007). Nonetheless, it is important to recognize that genetically influenced factors can still exert environmentally mediated effects on outcome (O'Connor, Deater-Deckard, Fulker, Rutter, & Plomin, Reference O'Connor, Deater-Deckard, Fulker, Rutter and Plomin1998; Rutter, Pickles, Murray, & Eaves, Reference Rutter, Pickles, Murray and Eaves2001). That is, exposure to deviant peers may be a manifestation of a heritable disposition and result in increased substance misuse through the mechanisms of peer facilitation and encouragement.
A second process that is also fundamental to understanding the joint influence of genetic and environmental factors is gene–environment interaction (Thapar, Harold, Rice, Langley, & O'Donovan, Reference Thapar, Harold, Rice, Langley and O'Donovan2007). Rather than being uniform across individuals, genetic influences are in many cases likely to depend on environmental context. For example, there is a growing research literature indicating that genetic influences on cognitive ability are diminished in environments that do not provide adequate opportunity for intellectual stimulation (Taylor, Roehrig, Hensler, Connor, & Schatschneider, Reference Taylor, Roehrig, Hensler, Connor and Schatschneider2010; Turkheimer, Haley, Waldron, D'Onofrio, & Gottesman, Reference Turkheimer, Haley, Waldron, D'Onofrio and Gottesman2003). Other research has shown that genetic influences on adolescent misbehavior are amplified in the presence of peer deviance, substance availability, and adverse family environments (Agrawal et al., Reference Agrawal, Balasubramanian, Smith, Madden, Bucholz and Heath2010; Button, Lau, Maughan, & Eley, Reference Button, Lau, Maughan and Eley2008; Feinberg, Button, Neiderhiser, Reiss, & Hetherington, Reference Feinberg, Button, Neiderhiser, Reiss and Hetherington2007; O'Connor, Caspi, Defries, & Plomin, Reference O'Connor, Caspi, Defries and Plomin2003) and diminished in positive contexts, such as being academically or prosocially engaged (Hicks et al., Reference Hicks, South, DiRago, Iacono and McGue2009; Johnson et al., Reference Johnson, Kyvik, Mortensen, Skytthe, Batty and Deary2010).
Characterizing the nature of environmental influence
The goal of G × E research is, of course, to determine whether and how environmental factors modulate genetic influences. However, the existence of G–E correlation raises the possibility that what may look like G × E may actually be G × G (Jaffee & Price, Reference Jaffee and Price2007). Advancing G × E research will require not only better phenotypic or endophenotypic measurement and identification of the relevant genetic variants but also proper characterization of environmental effects. Behavioral genetic methodology has a major role to play in this effort (Rutter, Reference Rutter2007). We have already provided two examples where behavior genetic methodology was instrumental in resolving an ambiguous association between a putative environmental risk factor and a behavioral outcome. In the first, the MR method was used to determine that adolescent alcohol use may not be a gateway to other substance abuse in adolescence (Irons et al., Reference Irons, McGue, Iacono and Oetting2007). However, MR depends on the existence of well-characterized causal genetic variants that mimic environmental exposure (Smith & Ebrahim, Reference Smith and Ebrahim2003). Given the yield to date from large-scale GWAS, it is reasonable to expect that MR will see limited application in psychology, at least in the near term. Nonetheless, it could be used more than it is now. For example, there are enough obesity-related genetic variants identified for MR to be used to effectively explore the psychological consequences of obesity (Timpson et al., Reference Timpson, Harbord, Smith, Zacho, Tybjaerg-Hansen and Nordestgaard2009).
Our second example involved the use of an adoptive-family design to determine that the environmental consequences of parental smoking were specific to adolescent smoking. Adoption studies are one of the most powerful methods for identifying familial environmental influences, although they have been rarely utilized within developmental psychology. This is perhaps, in part, a consequence of the logistical challenges associated with undertaking an adoption study. It is also likely a result of the belief that fundamental differences between adoptive and nonadoptive families severely limit the generalizability of adoption research (Rutter et al., Reference Rutter, Pickles, Murray and Eaves2001). Although there are certainly differences between adoptive and nonadoptive families, in general these differences are small (Rueter, Keyes, Iacono, & McGue, Reference Rueter, Keyes, Iacono and McGue2009) and when they are not can be accounted for by proper research design (McGue et al., Reference McGue, Keyes, Sharma, Elkins, Legrand and Johnson2007). Adoption studies, as well as variants based on assisted reproductive technologies, are underutilized within psychology.
A co-twin control study represents a third behavioral genetic design for characterizing the nature of environmental influence. Unlike the previous two, the co-twin control design is widely used, at least by behavioral geneticists. The logic of the design derives from the counterfactual model of causality (McGue, Osler, & Christensen, Reference McGue, Osler and Christensen2010). Briefly, monozygotic (MZ) twins who are discordant on exposure to some putative environmental agent represent an approximation to the ideal counterfactual design that is arguably second only to that of a randomized experiment. This is because MZ twins share a genotype and a rearing environment. Thus, for example, if early age of alcohol initiation is a risk factor for alcoholism in adulthood, then within MZ twin pairs discordant for early alcohol use, we should observe greater alcoholism risk among the twins who are early users than those who are not (McGue, Iacono, Legrand, & Elkins, Reference McGue, Iacono, Legrand and Elkins2001; Prescott & Kendler, Reference Prescott and Kendler1999).
An early application of the co-twin control design involved female twins discordant for childhood sexual abuse. Within discordant pairs, the abused twin was significantly more likely to develop an alcohol use disorder than the nonabused twin (Kendler et al., Reference Kendler, Bulik, Silberg, Hettema, Myers and Prescott2000), indicating that the association between childhood sexual abuse and adult alcohol use disorder could not be attributed to confounding with family environment or genetic factors. Subsequently, the co-twin control design has been used to explore a broad range of putative environmental agents, including, for example, the impact of early cannabis abuse on drug use escalation (Grant et al., Reference Grant, Lynskey, Scherrer, Agrawal, Heath and Bucholz2010; Lynskey et al., Reference Lynskey, Heath, Bucholz, Slutske, Madden and Nelson2003), the impact of college attendance on drinking (Slutske et al., Reference Slutske, Hunt-Carter, Nabors-Oberg, Sher, Bucholz and Madden2004), and early adolescent sexual behavior on risky adult sexual behavior (Huibregtse, Bornovalova, Hicks, McGue, & Iacono, Reference Huibregtse, Bornovalova, Hicks, McGue and Iacono2011).
Testing for Genetic Interactions at the Level of the Genome
G × E interactions in association studies have been even more difficult to identify than main effects, despite early promising leads (Duncan & Keller, Reference Duncan and Keller2011). The classic example of G × E in psychology involves the serotonin transporter linked polymorphic region (5-HTTLPR) in the promoter region of the serotonin transporter gene SLC6A4. 5-HTTLPR was found in a seminal G × E study to interact with a measure of stressful life events to predict adult depression (Caspi et al., Reference Caspi, Sugden, Moffitt, Taylor, Craig and Harrington2003). This result is perhaps the most well-studied and well-characterized interaction in psychiatric genetics. Yet, a decade since the 2003 study, the existence and extent of the interaction remains unclear, with disagreement among experts as well as dueling meta-analyses provided in support of very different conclusions (Caspi, Hariri, Holmes, Uher, & Moffitt, Reference Caspi, Hariri, Holmes, Uher and Moffitt2010; Karg, Burmeister, Shedden, & Sen, Reference Karg, Burmeister, Shedden and Sen2011; Risch et al., Reference Risch, Herrell, Lehner, Liang, Eaves and Hoh2009). Regardless of whether this interaction is real, the limitations of existing G × E research to clearly resolve the issue should motivate psychologists to critically evaluate existing G × E methodology.
The Caspi et al. (Reference Caspi, Sugden, Moffitt, Taylor, Craig and Harrington2003) G × E model has provided a popular blueprint followed by investigators worldwide in testing for G × E effects. The approach is to select environments and candidate genes, which are usually measured by a handful of common SNPs, based on a priori hypotheses about functional importance. It has been called for this reason a candidate G × E (cG × E) approach. Although theory-guided approaches are undoubtedly reasonable in some cases, they have yet to deliver in behavior genetics research. Much has been learned about genomic function since the Caspi study was published, including our knowledge (from GWAS) of the vanishingly small main effects for individual SNPs. It takes considerably more power to detect interaction effects compared to main effects (e.g., a common rule of thumb is four times as many subjects; Thomas, Reference Thomas2010a), owing in large part to the multiplicity of alternative hypotheses tested. Most candidate gene studies, including the original Caspi study, are undertaken on very small samples (the majority with N < 500), such that the power to detect an effect is miniscule and Type I errors are common (Duncan & Keller, Reference Duncan and Keller2011). To place this in context, the average SNP known to be associated with height accounts for 0.06% of the variance. Under reasonable assumptions, to have 80% power to detect a G × E interaction of similar magnitude at an alpha of 0.05 would require more than 10,000 unrelated participants.
From a genome-wide perspective, 80% power to detect the same effect at p < 5 × 10⁻⁸ would require a sample size of approximately 53,000 participants. Clearly, G × E-wide interaction studies (GEWIS) can be even more problematic than cG × E (Thomas, Reference Thomas2010a, Reference Thomas2010b; Thomas, Lewinger, Murcray, & Gauderman, Reference Thomas, Lewinger, Murcray and Gauderman2011) because the many tests required in a GEWIS severely compounds the already low statistical power to detect an effect. Given the infrequency with which phenotypes and environments are consistently collected across studies, it appears infeasible to amass the sample sizes necessary to detect a G × E effect at genome-wide significant levels.
GEWIS is not feasible and, for whatever reason, the a priori selection of candidate genes based on findings in model organisms (Caspi et al., Reference Caspi, Hariri, Holmes, Uher and Moffitt2010), for example, is not currently working. We argue that there are several ways forward.
1. Current atheoretical GWAS approaches can be tweaked to optimize analysis for identifying G × E interactions. These methods include (a) filtering the set of common SNPs to retain only those that have promise for interaction, which we explore in the next section, and (b) combining SNPs into polygenetic scores, and testing the score for interaction with the environment.
2. GWAS, G × E, and psychological theory will benefit from a developmental perspective.
3. The standard candidate gene approach has been far from optimal, but it is due to make a new and improved reappearance. Improved phenotypic and environmental measures, along with vastly improved genomic knowledge, can revive candidate gene approaches.
Emerging Approaches to Genetic Interactions
Filtering variants to enrich for interaction
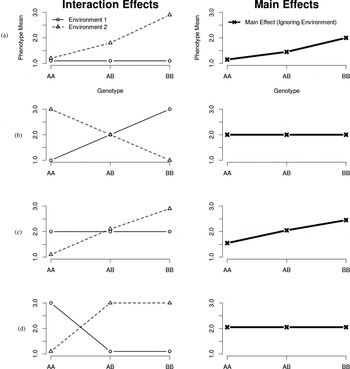
The genomically atheoretical approach of GWAS will not work for G × E because the testing burden is simply too heavy. However, we can use our general knowledge about statistical interactions to devise procedures to filter the vast number of common SNPs, resulting in a much smaller subset probabilistically enriched to show interactions (Thomas, Reference Thomas2010a). We briefly discuss three ways to do this. First, filter out any SNP that does not show a main effect for the phenotype. SNPs in the subset of variants with main effects are known to affect the phenotype in the first place and are more likely to be differentially relevant depending on the environment. We can see this in Figure 3. The figure portrays a series of possible interactions among genotype, environment, and phenotype. The genotype is a single SNP with alleles A and B. On the left-hand side of the figure is a sampling of the many possible interaction effects. For each interaction we also give the corresponding main effect that would arise under that interaction. The main effects are given on the right-hand side of the figure. Notice that some interactions imply a main effect (Figure 3a and c), although some do not (Figure 3b and d). Because we generally have more power to detect main effects than interaction effects of similar size, we can use the relationship between main effects and interactions to our advantage. If we restrict tests of interaction only for those SNPs with demonstrated main effect, for example, we can greatly reduce the genome-wide testing burden by rightfully ignoring the massive number of SNPs that lack a main effect. In addition, we expect the subset of SNPs with a main effect to be enriched for G × E interactions (Marchini, Donnelly, & Cardon, Reference Marchini, Donnelly and Cardon2005; Thomas, Reference Thomas2010a).
Association between Gene × Environment interaction (G × E) effects and gene main effects. Graphs are organized into rows. The left-hand graph in each row is an example G × E interaction; on the right, is the corresponding main effect (assuming the environmental exposure was 50:50 in this sample). (a) The G × E effect, similar to that found in Caspi et al. (Reference Caspi, Sugden, Moffitt, Taylor, Craig and Harrington2003) also shows a main effect when environment is ignored. The effect would also show unequal variances across genotypes due to the increasing mean separation between environments as we move from the AA genotype to the BB genotype. (b) The effect shows an interaction but no main effect, and unequal variances across genotypes are shown. (c) Although similar to (b), an interaction, a main effect, and unequal variances are shown. (d) This is unique in that the effect shows an interaction but demonstrates neither a main effect nor unequal variances.

There are many ways to filter the vast number of SNPs by main effect. Perhaps the best method is to use variants identified in the literature, preferably in large meta-samples. However, using only those variants identified as genome-wide significant (p < 5 × 10⁻⁸) may be too restrictive. A more exploratory G × E test might consider, perhaps, the top 100 or 1,000 SNPs with the largest estimated main effects, regardless of whether they are significant at p < 5 × 10⁻⁸. The multiple-testing burden for 100 SNPs is p < .0005, or 5 × 10⁻⁴, far better than the 5 × 10⁻⁸ incurred for testing all common SNPs. The actual number of candidate SNPs to include in such an exploratory study could easily be informed by power calculations.
Notice that filtering by main effect only works for a subset of possible interactions, as can also be seen in Figure 3. Only Figure 3a and c show a main effect in addition to interactions. Filtering SNPs by main effect will also remove all SNPs that demonstrate interactions in the absence of main effect (Figure 3b and d). There are other ways to filter SNPs to enrich for interactions in the absence of main effects. For example, one might do a test of equality of variances across genotypes (Pare, Cook, Ridker, & Chasman, Reference Pare, Cook, Ridker and Chasman2010). As can be seen in Figure 3b, for example, one would expect the variances to differ as a function of genotype. Collapsing across environment, the variance of the AA allele would be larger than the BB allele, because of the mean differences due to environment for the AA and BB genotypes that is not present for the AB genotype. Every example in Figure 3 would fail a test of equality of variance (assuming sufficient statistical power) except for Figure 3d, which is a theoretically possible interaction that shows neither a main effect nor inequality of variance across alleles. Genotypes that fail a test of equality of variances would be statistically enriched for interactions and prioritized in subsequent direct tests of G × E interaction. Note, however, that even Figure 3b and d (i.e., “cross-over” interactions) would demonstrate main effects if genotypes and environments are unequally balanced.
Combining SNPs into polygenetic SNP scores
Although the individual effect of a SNP is expected to be small, rendering the expected environmental interaction effect small, the aggregate effects of SNPs can be quite large. In the meta-analytic literature on genetic main effects, it has become common to sum SNPs by their univariate regression weight, resulting in a single polygenetic score for each individual (e.g., see Purcell et al., Reference Purcell, Wray, Stone, Visscher, O'Donovan and Sullivan2009; Vrieze, McGue, et al., Reference Vrieze, McGue, Miller, Legrand, Schork and Iacono2011). The resulting score can have a measureable effect on the phenotype, even in samples sizes in the thousands, allowing individual investigators to independently test interactions without the need for combining studies meta-analytically.
Polygenetic scores are not as biologically informative as individual SNP (or gene) effects, but they can help inform the genetic and environmental architecture of diseases and traits. For example, our group has recently conducted work on a polygenetic G × D test for cigarettes smoked per day (Vrieze, McGue, & Iacono, Reference Vrieze, McGue and Iacono2012). The score consisted of a sum of the top 91 SNPs reported in a recent GWAS meta-analysis of cigarettes smoked per day in approximately 75,000 smokers (Furberg et al., Reference Furberg, Kim, Dackor, Boerwinkle, Franceschini and Ardissino2010). In a sample of approximately 3,000 twins, we found that the SNP score was irrelevant at ages 14 and 17, but it was significantly associated with number of cigarettes smoked per day at ages 20 and 24, indicating a G × D interaction. We speculate that development here is a proxy for the environmental changes that occur between ages 17 and 20, and serve to activate genetic influences on smoking. Most individuals at ages 14 and 17 have difficulty finding the opportunity to smoke more than a handful of cigarettes per day, if they smoke at all. Smoking is illegal in the United States at these ages, and the vast majority of youths are under teacher and/or parent supervision for most of their waking hours, limiting but by no means eliminating their opportunity to smoke. This environmental restriction on smoking is expected to temper the effect of a risky genotype. At ages 20 and 24, however, smoking is legal, and young adults often live and work independently, removing the environmental restriction on their genotypic propensity to smoke more.
Unfortunately, a meta-analytic GWAS of 100,000 individuals from which to select SNPs with demonstrated main effects does not exist for every phenotype. Even so, several options remain. One brute force method is to obtain polygenetic scores without meta-analytic guidance, often by summing across tens of thousands of SNPs (Simonson, Wills, Keller, & McQueen, Reference Simonson, Wills, Keller and McQueen2011). The method often involves obtaining the univariate effect of each SNP, culling SNPs in high LD with more significant SNPs, and then adding the remaining SNPs according to their univariate regression weight. Removing weaker SNPs in high LD with stronger SNPs removes likely LD-induced artifacts. Depending on the LD threshold, this method results in thousands to hundreds of thousands of SNPs comprising the resulting score. The method has proven useful with the usual anthropometric traits like height (Allen et al., Reference Allen, Estrada, Lettre, Berndt, Weedon and Rivadeneira2010) and BMI (Speliotes et al., Reference Speliotes, Willer, Berndt, Monda, Thorleifsson and Jackson2010) and in schizophrenia and bipolar disorder (Purcell et al., Reference Purcell, Wray, Stone, Visscher, O'Donovan and Sullivan2009). The score can then be incorporated in tests of environmental and developmental moderation.
Another viable method to evaluate aggregated SNP interactions is GCTA (Yang, Lee, et al., Reference Yang, Lee, Goddard and Visscher2011, described in the GWAS of Anthropometric Measures, Medical Diseases, and Behavioral Traits Section). GCTA is a method by which one can estimate the variance in the phenotype accounted for by measured SNPs. The method uses the estimated genetic relatedness between individuals in the sample and models all SNPs as a random effect in a mixed effects model. Mixed effects models can include interaction terms between random and fixed effects (Pinheiro & Bates, Reference Pinheiro and Bates2000), and GCTA has a built-in facility for evaluating G × E interaction, where the G is the random effect of all measured SNPs and E is the fixed environmental measurement. At present, the software is restricted to discretely measured environments (e.g., was exposed to disease pathogen, yes/no), but quantitative measures of the environment are planned for future updates to the algorithm (Jian Yang, personal communication, February 13, 2012). It stands to reason that longitudinal repeated measures could also be implemented in a GCTA framework, allowing tests of aggregate SNP effects on developmental trajectories. There is great promise to extending GCTA to environmental and developmental interaction, as any study with genome-wide SNP data becomes immediately genetically informative, much like a twin study. Twin studies are difficult or impossible to ascertain for rare phenotype/environment combinations, and GCTA could provide a workaround in evaluating the environmental moderation of genetic effects in these situations. In the context of a rare natural event (often called a “natural experiment”; Rutter, Reference Rutter2007), such as a war or a natural disaster, one could imagine genotyping survivors and comparing them to matched controls, conducting a test of G × E using GCTA to determine G × E interaction for phenotypes such as posttraumatic stress disorder. However, this sort of research without using GCTA has been done with hurricane victims and 5-HTTLPR (Kilpatrick et al., Reference Kilpatrick, Koenen, Ruggiero, Acierno, Galea and Resnick2007).
Genome-wide polygenetic scores and GCTA have provided insight about the genetic architecture of disease, but they otherwise lack direct biological interpretability because GCTA considers the genome-wide aggregate effect of hundreds of thousands of SNPs simultaneously. Such scores need not be genome-wide, however, and application of a scoring approach to a genomic region can provide improved biological relevance. Using GCTA in a sample of 12,000, Yang, Manolio, et al. (Reference Yang, Manolio, Pasquale, Boerwinkle, Caporaso and Cunningham2011) found that SNPs in genes explained 38% of the variance in height, whereas SNPs in intergenic regions explained only 8%, even though the intergenic regions made up roughly half of the genome. Taking this approach one step further, Lee et al. (Reference Lee, Decandia, Ripke, Yang, Sullivan and Goddard2012) found that genes involved in central nervous system function accounted for approximately 30% of the diagnostic variance in schizophrenia, whereas they physically comprise only 20% of the genome. Other genes also accounted for approximately 30% of the variance but physically comprise about 40% of the genome. As sample sizes grow, more refined subsets of genes can be evaluated. For example, for alcoholism one might investigate the proportion of variance accounted for by SNPs in genes known to be involved in alcohol metabolism or candidate neurotransmitter systems such as GABA, dopamine, or serotonin.
Role of G × D in evaluating G × E
G × E studies to date largely have not considered the role of development. Development can inform genetic studies in at least two ways. First, it can serve to modify the G × E interaction, resulting in a G × E × D interaction. Second, it can serve as a proxy for the environment in G × E. That is, changes in the environment can correlate strongly with changes in age or developmental stage, as illustrated in our work on cigarette smoking where the protective (or, at least, interfering) childhood environment becomes less influential as adolescents age. On a much more basic level, genomic regions have been linked to embryonic development (Woolfe et al., Reference Woolfe, Goodson, Goode, Snell, McEwen and Vavouri2005). These regions are often involved in regulating protein transcription from genes involved in development and cell integrity, are critical in organisms from humans to dogs to fish, and have been highly conserved across animal species (Lindblad-Toh et al., Reference Lindblad-Toh, Wade, Mikkelsen, Karlsson, Jaffe and Kamal2005; Pennacchio et al., Reference Pennacchio, Ahituv, Moses, Prabhakar, Nobrega and Shoukry2006).
Like cG × E studies, candidate G × D (cG × D) studies involve the selection of a promising genomic region, such as a gene, and observation of how variants in that region are associated with a phenotype at different ages or developmental stages. An excellent example of a cG × D study involves a SNP in the fat mass and obesity-associated alpha-ketoglutarate dependent dioxygenase (FTO) gene known to affect BMI in adults (Speliotes et al., Reference Speliotes, Willer, Berndt, Monda, Thorleifsson and Jackson2010) by affecting one's perception of satiation after eating. In a longitudinal meta-analysis of eight studies, Sovio et al. (Reference Sovio, Mook-Kanamori, Warrington, Lawrence, Briollais and Palmer2011) demonstrated divergent developmental trajectories for different alleles of SNP rs9939609. They found that carriers of the at-risk minor allele of rs9939609 in FTO was significantly associated with a lower BMI in toddlerhood, an earlier adiposity rebound around age 5, and higher BMI in early adolescence. The study demonstrates well the potential complex interplay between genes and development that can be assessed with relatively small sample sizes; the Sovio et al. (Reference Sovio, Mook-Kanamori, Warrington, Lawrence, Briollais and Palmer2011) study had on average approximately 9,500 participants at any given age of assessment. By the same token, it stresses the need for individual investigators to share existing data and collaborate on meta-analytic endeavors.
Our group at the University of Minnesota took the cG × D paradigm in a slightly different direction (Vrieze, McGue et al., Reference Vrieze, McGue, Miller, Legrand, Schork and Iacono2011). Our goal was to understand how the Allen et al. (Reference Allen, Estrada, Lettre, Berndt, Weedon and Rivadeneira2010) meta-analytic SNP findings for height play out developmentally during the pubertal growth spurt. We tested for association of 176 of those SNPs with both prepubertal height and the pubertal growth spurt in a sample of 3,187 twins of Caucasian ancestry from the Minnesota Center for Twin and Family Research (for a description of the study, see Miller et al., Reference Miller, Basu, Cunningham, Oetting, Schork and Iacono2012). No individual SNP was associated with prepubertal height, or the pubertal growth spurt, at genome-wide significance. Aggregating the SNPs into a polygenetic score (summing them together by their meta-analytic weights to form a single SNP score) resulted in a much stronger association with prepubertal height (p = 1 × 10⁻¹³, r 2 = .045) than with the pubertal growth spurt (p = .004). The results indicated that the SNPs identified by the meta-analysis were more relevant for growth in stature between conception and 10 years of age,and largely did not explain variation in the rate at which individuals grew after the onset of puberty.
cG × D approaches based on a priori hypotheses about gene function have also proven useful in some instances. The Irons et al. (Reference Irons, McGue, Iacono and Oetting2007) study, involving the gene ALDH2 and described in detail earlier, was expanded in Irons, Iacono, Oetting, and McGue (2012), where the authors tested the extent to which the protective effect of ALDH2 changed during adolescence. Recall that nearly 50% of individuals of East Asian ancestry inherit a variant in the ALDH2 gene that diminishes their ability to metabolize alcohol and that those who inherit the deficient gene variant are likely to experience various signs of dysphoria following ingestion of even a small amount of alcohol. The deficient variant of ALDH2 was found to be protective against drinking during early adolescence (14–17) and grew increasingly protective as the individuals aged. The general results are consistent with the Vrieze et al. (Reference Vrieze, McGue and Iacono2012) findings for cigarette smoking. That is, in adolescence the genotype effect existed but was muted, likely mitigated by protective childhood environmental circumstances. As the individuals aged, their genotype increasingly exerted influence on their behavior.
The Irons et al. (2012) finding is an excellent example of G × D effects for a psychiatric condition and demonstrates how a genotype expresses differentially depending on developmental stage or, perhaps just as likely, environmental context. As the youths develop, their environment systematically changes, often in ways that can inform knowledge of the interface between genes and environment.
Complementing GWAS: Rare and structural variants
Common SNPs used in GWAS represent a small fraction of the entirety of genetic individual differences. GWAS disregard entirely rare SNPs and structural variation. Recall the GCTA findings described above. At best, common SNPs account for less than half of the total additive genetic variance to be explained. For the only psychiatric disease to be rigorously evaluated thus far (schizophrenia), they account for a quarter. Although nothing to sneeze at, this leaves a large proportion of the heritability of schizophrenia unexplained by common SNPs. There are many explanations for the missing heritability (Eichler et al., Reference Eichler, Flint, Gibson, Kong, Leal and Moore2010; Zuk, Hechter, Sunyaev, & Lander, Reference Zuk, Hechter, Sunyaev and Lander2012), including the existence of G × E interactions (Manolio et al., Reference Manolio, Collins, Cox, Goldstein, Hindorff and Hunter2009; Thomas, Reference Thomas2010a), but we focus on one: the fact that genetic variants in humans are not limited to common SNPs. Other types of variants are displayed in Figure 1, where we notice insertions, deletions, substitutions, inversions, variable tandem number repeats, and CNVs. Forms of genetic variation other than common SNPs are no doubt relevant for disease, and they are just as likely to be environmentally and developmentally moderated as common SNPs.
Rare and structural variation is obtained by sequencing, which has not until recently become technologically or financially feasible. In current genome sequencing (called “shotgun sequencing”), the approach is to obtain several reads (or measurements) of each base pair. Because each read is relatively error prone, it is desirable to obtain many reads (e.g., >30) for each base pair to correctly identify the actual nucleotide. The average number of reads for each base pair is termed the “depth” of sequencing; the deeper the coverage, the higher the average number of reads and the more precise the genotype calls. Ideally, many individuals would be sequenced at high depth, which would provide accurate genotyping as well as large sample sizes (and power) for tests of phenotype–genotype associations. However, each read costs money, and there is thus a trade-off between the number of individuals sequenced and the depth of sequencing. An optimal trade-off can be selected, but it depends on the research question (Li, Sidore, Kang, Boehnke, & Abecasis, Reference Li, Sidore, Kang, Boehnke and Abecasis2011).
We first provide some context and motivation for whole genome sequences. The immediate goal of GWAS was to identify SNP associations with the phenotype. Because significant SNPs in a GWAS are unlikely themselves to be functional (i.e., causal) but rather more likely to be in LD with functional variants, the region around a significant SNP would be subjected to further genotyping and/or sequencing to determine how that region, which the SNP has “tagged,” is causally related to the phenotype. The common SNPs thus would provide a foothold into biological investigations of etiology. There have been dramatic examples of this logical progression from GWAS hits to regional targeted sequencing and ultimate elucidation of functional variants. We discuss these to shift our attention from SNPs, which represent very minor perturbations of the genome, to genes, which are massive genomic regions integral to human biology and existence.
In a meta-analysis of GWAS on lipids, Teslovich et al. (Reference Teslovich, Musunuru, Smith, Edmondson, Stylianou and Koseki2010) found 95 SNPs genome-wide significant for lipid traits, such as plasma concentrations of cholesterol measures. As usual, each SNP in the GWAS had only a very small effect. However, the investigators then developed mouse models to validate three genes that contained SNPs identified in the meta-analysis. In the mouse models the investigators did not simply perturb the GWAS-significant SNPs; rather, they knocked out or overexpressed the entire gene, with dramatic results. The experimental mice showed marked differences in HDL cholesterol compared to controls. The results highlight the fact that SNPs identified by GWAS are tag SNPs, unlikely to be functional themselves, but which can point to a gene or larger genomic region that turns out to be phenotypically critical after further study.
A developmentally relevant example is in human growth. Widen et al. (Reference Widen, Ripatti, Cousminer, Surakka, Lappalainen and Jarvelin2010) conducted a GWAS on growth in height during puberty. One SNP, located in lin-28 homolog B, was genome-wide significant for pubertal growth and had previously been associated with timing of puberty (Ong et al., Reference Ong, Elks, Li, Zhao, Luan and Andersen2009) and later further validated by Vrieze, McGue et al. (Reference Vrieze, McGue, Miller, Legrand, Schork and Iacono2011). Similar to the work on lipids, researchers developed a mouse model where the mouse gene analog, lin-28 homolog A, was overexpressed. The transgenic mice showed dramatic change in rate of growth during puberty, change in pubertal initiation, and vastly different adult height and size (Zhu et al., Reference Zhu, Shah, Shyh-Chang, Shinoda, Einhorn and Viswanathan2010). Again, GWAS SNPs may only weakly point to a gene, even though the gene as a whole is crucial to phenotypic development.
Genes are the part of the genome that actually encode amino acids and proteins, and are made up of promoters, enhancers, exons, introns, and other gene units. Promoters and enhancers determine the rate of transcription of a gene: strong promoters tend to result in higher rates of transcription, and thus more of the protein(s) encoded by the gene. Weak promoters result in less gene production. The exonic regions of a gene are those regions that actually encode amino acids and proteins. Even a single mistake in the exon can completely change the protein encoded by the gene. In some cases a nonfunctional protein is produced; in others a chemically different but functional protein is produced. For example, a nonsense mutation can break a gene entirely, resulting in a complete loss of function, similar to that discussed above for the mouse models. A good example of exomic mutations with phenotypic impact is in cystic fibrosis, where 1,404 different exomic mutations have been catalogued for the cystic fibrosis transmembrane conductance regulator gene (http://www.genet.sickkids.on.ca/cftr/Home.html). Because only a single functional copy of the cystic fibrosis transmembrane conductance regulator gene is required for normal function, a child inherits cystic fibrosis if both the maternal and the paternal genes carry at least one nonfunctional mutation. In another, more sensational example, researchers used exome sequencing to make a novel diagnosis of congenital chloride diarrhea for a patient who was referred for genetic testing for diagnostic clarification (Choi et al., Reference Choi, Scholl, Ji, Liu, Tikhonova and Zumbo2009). The study demonstrated the potential clinical utility of genome sequences for phenotypically extreme cases that are not easily diagnostically classified.
Our knowledge of gene structure and function can be leveraged in analysis of genotype–phenotype associations. Major efforts have been undertaken to characterize variation within the exome, a term used to describe the collection of all exonic coding regions contained within the genome. The 1000 Genomes Consortium sequenced the exomes of 697 individuals at an average depth of 56× (very deep), identifying 12,758 SNPs with minor allele frequency greater than 0.1% (Altshuler et al., Reference Altshuler, Durbin, Abecasis, Bentley, Chakravarti and Clark2010). Thanks to these efforts, all the functionally important exomic SNPs can now be genotyped with a relatively inexpensive exome SNP chip now commercially available.
One problem with exomic association tests is that loss of function mutations are likely to be very rare, owing to strong evolutionary selection against these variants. Because power is extremely low for rare variants (de Bakker et al., Reference de Bakker, Yelensky, Pe'er, Gabriel, Daly and Altshuler2005), different analytic strategies are devised and used to handle them (Bansal et al., Reference Bansal, Libiger, Torkamani and Schork2010). One attractive method is to determine the functionality of each SNP within some region, such as a gene, and then predict the extent to which that region is impaired (Cooper & Shendure, Reference Cooper and Shendure2011; Torkamani, Scott-Van Zeeland, Topol, & Schork, Reference Torkamani, Scott–Van Zeeland, Topol and Schork2011). For example, if an individual carries even one nonsense exonic mutation within a gene, then the gene for that person would be predicted to be nonfunctional. This is precisely the etiology of cystic fibrosis, where there are many potential nonsense exonic mutations (among other types of mutations), all of which lead to the same phenotype. Regardless of the phenotype, one can test, for example, whether cases versus controls are more likely to have nonfunctional genes. Regression analysis can be used for quantitative traits, regressing the phenotype onto predicted functionality for each gene. ENCODE and other extensive databases are continuously updated with reams of genomic information. For instance, dbSNP catalogues all identified SNPs in any organism and their population characteristics (e.g., minor allele frequency, chromosomal position); OMIM catalogues known disease-causing mutations; and the ENCODE consortium is an attempt to discover, define, and list the functional elements of the human genome (Myers et al., Reference Myers, Stamatoyannopoulos, Snyder, Dunham, Hardison and Bernstein2011). Software has been developed to automatically leverage the immensity of information in these databases and apply it to individual genotypes in our studies. A list of such software is given in Cooper and Shendure (Reference Cooper and Shendure2011).
Although not yet widely applied to psychiatric phenotypes, exome sequencing has shown promise in identifying genes relevant to phenotypes ranging from autism (O'Roak et al., Reference O'Roak, Deriziotis, Lee, Vives, Schwartz and Girirajan2011) and schizophrenia (Xu et al., Reference Xu, Roos, Dexheimer, Boone, Plummer and Levy2011) to mental retardation (Vissers et al., Reference Vissers, de Ligt, Gilissen, Janssen, Steehouwer and de Vries2010). As exome sequencing becomes more affordable and the exome SNP chip more commonly used, we expect exomic studies of psychiatric disease and psychological traits to become increasingly common.
Structural variation is a substantial source of genetic differences between individuals. Structural variants include CNVs, indels, substitutions, and inversions, all of which are displayed in Figure 1. The extent of this variation is immense and has only recently been well characterized, thanks to the 1000 Genomes Consortium and related projects. Altshuler et al. (Reference Altshuler, Durbin, Abecasis, Bentley, Chakravarti and Clark2010) identified that individuals on average have 361,669 indels, 96 of which occur in exonic regions. (Recall that one deleterious variant within an exon can disrupt a gene entirely, so it is not trivial that individuals on average have 96 exonic insertions or deletions.) The same study found that individuals on average have 10,000–11,000 nonsynonymous SNPs and around 570 in-frame structural variants (not counting CNVs) that likely have greater functional impact than single SNPs. “Nonsynonomous” means the SNP disrupts the protein-coding sequence, whereas an “in-frame” variant simply means that the variant significantly overlaps with the parts of the gene that code a protein. Of these, approximately 370 of the variants are likely to result in loss of function in the gene, rather than gain of function. In total these loss of function variants affect approximately 275 genes per individual in the study. In a follow-up study of CNVs, Mills et al. (Reference Mills, Walter, Stewart, Handsaker, Chen and Alkan2011) identified 28,025 CNVs, 10,995 of which overlap with genes, in many cases including the exon (1,119). Structural variants represent a significant source of genetic variation, much of which theoretically has substantial import for the genetic etiology of disease (Stankiewicz & Lupski, Reference Stankiewicz and Lupski2010).
Psychiatric genetics and behavior genetics have begun to evaluate CNVs in disease, with some notable results for schizophrenia (Levinson et al., Reference Levinson, Duan, Oh, Wang, Sanders and Shi2011), bipolar disorder (Priebe et al., Reference Priebe, Degenhardt, Herms, Haenisch, Mattheisen and Nieratschker2011), and autism (Cook & Scherer, Reference Cook and Scherer2008). Promising results have also been found for neurodevelopmental conditions such as attention-deficit/hyperactivity disorder (Elia et al., Reference Elia, Gai, Xie, Perin, Geiger and Glessner2010, Reference Elia, Glessner, Wang, Takahashi, Shtir and Hadley2012). Other forms of structural variation, including shorter CNVs, can now feasibly be measured with sequencing pipelines and reference genotypes provided by the 1000 Genomes Consortium (Mills et al., Reference Mills, Walter, Stewart, Handsaker, Chen and Alkan2011). As more main effects of structural variants are discovered, they must be leveraged along with rare and common SNPs to assist in elucidation of genetic, environmental, and developmental etiology of disease. All of the techniques discussed above for SNPs (except perhaps GCTA) are applicable to structural variation, and we expect research in this area to begin blossoming in the near future as sequencing becomes routine.
The return of the Candidate Gene Study
In the world after the Human Genome Project, psychiatric and behavior genetics has swung from a field dominated by the candidate gene approach, and its a priori hypotheses, to one relying on the brute force of atheoretical GWAS. With the advent of affordable whole genome sequencing and functional annotation, we expect the pendulum to begin swinging back. Science has and will benefit from data-driven approaches like GWAS, but scientific psychology requires theory to integrate findings and focus our experimental tests (Caspi et al., Reference Caspi, Hariri, Holmes, Uher and Moffitt2010). A major stumbling block of the candidate gene and cG × E approach has been the lack of theory and understanding about genomics and genetic etiology; unknown at the time, the candidates were not so good and expected effect sizes were highly optimistic. GWAS, although not curing diseases, has been an exciting learning exercise. To exaggerate for effect, we now know that testing some genetic theory of behavior using small samples, genetically uninformed phenotypes, poorly measured environments, no consideration of developmental circumstance, and a handful of SNPs in a single gene will not do the trick. GWAS undoubtedly will continue to provide leads (Visscher et al., Reference Visscher, Brown, McCarthy and Yang2012) and point the way to relevant genes. Encouraged by past success, ever more investigators are sharing data to arrive at the required massive sample sizes. Consortia are even popping up with developmental and environmental questions: our group is contributing to a consortium evaluating adolescent cigarette smoking, for example. Identified SNPs will point to genomic regions that will be subjected to further study. Transgenic mice will be created. Identified genes will be sequenced, variants annotated and grouped, and tested in new samples.
GWAS will only get us so far. Etiological psychological theories must be proposed, tested, and amended. Although biological reductionism is perhaps not always preferable or possible (Miller, Reference Miller2010), theories would do well to propose, derive, and test increasingly refined endophenotypes. Multidisciplinary biological, neuroscientific, and psychological research will point to chemical and structural systems relevant to psychological endophenotypes, such as neurochemical systems. Gene(s) known to be involved in those systems, if not the whole genome, will be cheaply sequenced. Leveraging knowledge of gene function, the entirety of genetic variation within the gene(s) can be tested for association with the endophenotype. At the same time, psychological research on environmental etiology and measurement will continue, identifying environments likely to have causal phenotypic effects. Tests of G × E and G × D can commence once plausible candidate genes have been identified.
This brief outline of candidate gene research is not prescriptive; the steps by no means must proceed in that order. Rather, it is an attempt to describe what we see as important waypoints in the path to understanding genetic and environmental etiology of behavior. In some fields many of the steps have already been taken. There is a wealth of neuroscience and biological findings for alcoholism, for example, with excellent animal models providing a wealth of biological knowledge (Spear, Reference Spear2000), including metabolic and neurotransmitter systems implicated in alcohol use and abuse (Hodgkinson et al., Reference Hodgkinson, Yuan, Xu, Shen, Heinz and Lobos2008); plausible etiological theories in psychology (Iacono et al., Reference Iacono, Malone and McGue2008); and well-validated endophenotypes (Iacono & Malone, Reference Iacono and Malone2011). The environmental etiology is continuously elucidated (Irons et al., Reference Irons, McGue, Iacono and Oetting2007; Keyes et al., Reference Keyes, Legrand, Iacono and McGue2008), and several studies are already obtaining whole genome sequences on human samples informative for alcohol and drug use, abuse, and addiction.
Summary
Simply getting off the ground and identifying robust and replicable genetic effects has been difficult. Nonetheless, the field as a whole has learned a lot about genes, environments, and behaviors in the process. Twin, adoption, and family studies formed the foundation and continue to be indispensible in forming and refining psychological theory. With measured genetic variation, this research can be taken to a more biologically and environmentally informative level, as behaviorally relevant genetic variants are discovered and their effects characterized. Although common SNPs may account for a significant proportion of heritability, there remains a very substantial source of genetic structural variation that is only beginning to be tapped. Environmental and phenotypic definitions and measurements are likely far from optimal. Better measurements, including endophenotypes, help everyone, psychologist and geneticist alike, and will only improve the science and simultaneously increase the power for genetic associations. Current directions in quantitative psychiatric disease definition in DSM-V (Krueger et al., Reference Krueger, Eaton, Clark, Watson, Markon and Derringer2011), efforts at standardized environmental measures like the PhenX Toolkit, ever-cheaper sequencing, and improved knowledge of genomic structure and function will provide investigators with powerful tools to disentangle genomic, environmental, and developmental etiology in psychological behavior and disease. The coming decade will be an exciting one for psychologists interested in understanding the causes of human behavior.