I. INTRODUCTION
Cellulose is both the world's most abundant natural material and the world's oldest known biomaterial (Griffith, Reference Griffith, Wilcox, Powers, Nelson and Baxter2008). The commercial applications of celluloses are numerous: as an energy source, a source for clothing and fabrics, an additive in pharmaceuticals, building insulation, and a prime ingredient in adhesives and thickening agents. While the formulae of cellulosics are often simple, the chemistry and structure of these materials display an amazing diversity in crystallinity, polymorphic form and morphology. As the world's most abundant biomaterial, cellulose has been studied by scientists for centuries; however, unraveling the secrets of its structural chemistry continues today in many laboratories around the globe. In the past decade, some of the world's most sophisticated analytical tools have been used to elucidate the structural details of cellulosics. These tools include synchrotron X-ray studies of both diffraction and scattering (Kaduk and Langan, Reference Kaduk and Langan2002; Elazzouzi-Hafraoui et al., Reference Elazzouzi-Hafraoui, Nishiyama, Putaux, Heux, Dubreuil and Rochas2008), advanced microscopy and imaging techniques (Baker et al., Reference Baker, Helbert, Sugiyama and Miles2000), solid-state nuclear magnetic resonance (NMR), neutron diffraction (Nishiyama et al., Reference Nishiyama, Chanzy, Wada, Sugiyama, Mazeau, Forsyth, Riekel, Mueller, Rasmussen and Langan2002, Reference Nishiyama, Sugiyama, Chanzy and Langan2003; Wada et al., Reference Wada, Yoshiharu, Chanzy, Forsyth and Langan2008), and small-angle scattering (Nishiyama, Reference Nishiyama2009). From these studies more details are emerging of the atomic structure of these materials. In the field of X-ray diffraction (XRD), the combined analytical data are providing insight into the often complex diffraction characteristics, both coherent and incoherent scattering, seen in these materials.
In light of these new discoveries, where we can build on the enormous prior work of global scientists, the International Centre for Diffraction Data has used a team of member scientists to develop new reference materials that can be used for the study of polymorphism and crystallinity in cellulose. This publication details the initial results of a multiyear effort to build a new set of cellulose references and specifically describes work performed on 13 new reference materials published over the last 6 years.
II. EXPERIMENTAL
A wide variety of cellulosic materials has been collected over a period of many years by the authors. Several of the authors obtained or generated the samples in their own laboratories. The International Centre for Diffraction Data has acted as a coordinating body, to analyze and edit the data and archive and publish the resulting diffraction data, relevant experimental methods, specimen preparation, and associated crystallography and physical properties.
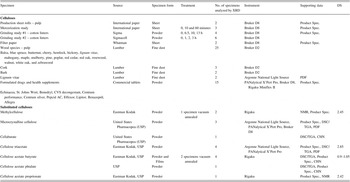
In total, XRD data from 80 separate samples were obtained, including a series of paper pulps used in wood processing, cellulosics used in the pharmaceutical industry, wood dust from 18 species of wood, mercerized sheets and cotton linters and woods used as reference standards developed by chemical companies and the United States Pharmacopeia (USP). Commercial samples were purchased by the ICDD and then distributed to some of the authors for data collection. A summary of these 80 samples are shown in Table I. The series of woods, health supplements, and formulated drugs were used to test the reference materials in the intended application of identification and characterization.
The samples and specimens analyzed. Specimen refers to the form presented to the instrument. DS refers to a degree of substitution as measured by NMR and PDF refers to a pair distribution function analysis. A total of 80 specimens were analyzed.

Specimens of each sample were typically made from ground fibers. Commercial samples, except where noted in Table I, were finely chopped fibers. In commercial processes, the finely chopped fibers are typically produced by production cutters working on sheet rolls of wood pulp or cotton linters. Commercial samples were purchased in the finely chopped state, lightly ground in a mortar and pestle, and then mounted in either a capillary or cavity mount. Health supplements and formulated drug tablets were ground in a mortar and pestle and mounted in a cavity mount. Being soft materials they are readily crushed by hand. Wood samples were prepared by taking fine wood filings by hand, of each of the selected wood species. Cavity mounts were used for the wood dust filings. The specimens were prepared in each of the six laboratories of the authors. The authors are very experienced in cellulose preparations. Four of the authors have spent appreciable time supporting commercial cellulosic production during their careers at The Dow Chemical Company, Eastman Kodak Company, and the International Paper Company.
Care must be taken during the specimen preparation to reduce the orientation of the fibers and fibrils. The authors used cavity mounts with zero background holders (off-cut silicon or quartz crystals) and were meticulous in only applying enough pressure to lightly compact the sample. Rotating sample holders were utilized.
As shown in Table I, a few select specimens were analyzed in the as-received state. This included the production sheet rolls and commercial filter paper. These products are mechanically pressed into desired thicknesses and would be expected to yield oriented samples as analyzed by XRD. The resulting data confirm this and closely resemble the diffraction patterns observed in oriented films of native cellulose samples (Elazzouzi-Hafraoui et al., Reference Elazzouzi-Hafraoui, Nishiyama, Putaux, Heux, Dubreuil and Rochas2008). In general, the authors avoided preparation methods that would yield oriented specimens, such as the one described by Driemeier and Calligaris (Reference Driemeier and Galligari2011), where filter paper was cut into strips and then put in the constrained geometry of a capillary tube and the data were subsequently corrected for orientation. The use of two-dimensional detectors substantially aided Driemeier and Calligaris in performing orientation measurements and corrections. The data sets in this study were collected on one-dimensional detectors, hence more care was taken in specimen preparation to avoid orientation.
The presence or absence of orientation was determined qualitatively by comparison of the relative peak height to other samples, both in this study, the Powder Diffraction File (PDF), and data shown in the references. This comparison was significantly aided by the use of graphics programs contained in several commercial pattern analysis products used in this study. For cellulose Iα, Iβ, cellulose II and cellulose triacetate form II orientation could be examined quantitatively by comparison with patterns calculated from crystalline and molecular structures (Roche et al., Reference Roche, Chanzy, Boudeulle, Marchessault and Sundarajan1978; Kaduk and Langan, Reference Kaduk and Langan2002). In the case of substituted celluloses, the authors relied on their experience and the full experimental pattern reference data published by Turley (Reference Turley1965). The data in this latter compilation have been scanned and digitized by the editorial staff of the ICDD to facilitate graphic comparisons. This compilation includes data on six commercial substituted celluloses from Dow, Dupont, Celanese and Eastman Chemical companies taken in the 1960s, including five that are shown in Table I. The close fit between experimental data and data calculated from atomic molecular structures and the close fits between experimental data sets taken more than 50 years apart convinced the authors that orientation effects were minimal in all data sets from powders or filed wood shavings. Molecular orientation was observed in sheets, films, and papers, as expected.
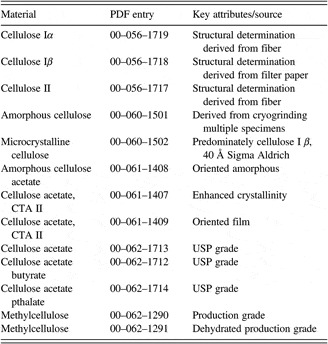
Specific conditions for each specimen were recorded in keeping with ICDD's guidelines for reference measurements (Wolkov, Reference Wolkov, Calvert, Flippen-Anderson, Hubbard, Johnson, Lenhert, Nichols, Parrish, Smith, Smith, Snyder and Young2012). XRD data were collected using CuKα radiation. Simulated patterns shown in this presentation were calculated using CuKα radiation for comparison. The specimen data that became reference materials in the PDF were assigned PDF entry numbers, and the experimental and instrumental details are recorded with the PDF publication. A table of these materials is shown in Table II.
PDF cellulosic reference materials.

Many specimens and the resulting data files were not intended for use as reference materials. They were used to evaluate the applicability of selected reference materials for elucidating the performance of these materials in the target material analysis. The target material analyses included basic phase identification and the identification of polymorphic forms. For example, mercerized sheets were analyzed so that we could see whether the reference standards of cellulose I, cellulose II, and amorphous cellulose could be used to monitor crystallinity and polymorphism in grinding studies and chemical treatments. Numerous cellulose-containing natural products and pharmaceutical tablets were analyzed to see whether polymorphism and crystallinity could be determined in commercial pharmaceutical tablets.
Pair distribution function analyses experiments were carried out both on laboratory equipment and at synchrotron sources. Synchrotron high-energy XRD was carried out at the beam line 11IDC at the Advanced Photon Source at the Argonne National Laboratory using X-rays of energy 115 keV (λ = 0.1078 Å). Samples were sealed in glass capillaries and data were collected with an image plate detector (mar345). The diffraction data were reduced to the so-called structure factors, S(q), and then Fourier transformed to the corresponding atomic PDFs G(r). Laboratory data were collected using MoKα radiation also in thin walled glass capillaries. The samples used for pair distribution analyses were all obtained from the USP and consisted of finely chopped fibers. Details of the data processing steps for cellulose and other low-Z materials are described by Petkov et al. (Reference Petkov, Ren, Kabekkodu and Murphy2012).
Powders and wood filings analyzed in this study were in a dry state and loosely compacted.
For all powders and filings, data were taken at room temperature and atmosphere, with the exception of one specimen of methylcellulose, PDF 00-062-1291. No special precautions were taken to control humidity, temperature, or the environment. Films were thermally processed under conditions noted in the reference patterns. Cellulosic fibers can significantly change with exposure to water and processing, which has been extensively studied for the paper recycling industry (Hubbe et al., Reference Hubbe, Venditti and Rojas2007). Four specimens (Table I), all commercial powders, were analyzed by combined Thermal Gravimetric Analysis/Differential Scanning Calorimetry (TGA/DSC). All four specimens were heated from room temperature through thermal decomposition and ashed at 800 °C. The measured weight loss for absorbed water ranged from 4.6 to 5.7 weight percent in two samples of cellulose and from 2.4 to 3.2% in two samples of substituted cellulose. This is consistent with the observed loss in water retention with processed fibers attributed to partial irreversible closure of small pores during drying, as described by Hubbe et al. (Reference Hubbe, Venditti and Rojas2007). The absorbed water content was estimated from the gradual weight loss below 200 °C associated with a very broad endotherm centered around 100 °C. The aforementioned methylcellulose was heated for 3 h in vacuum at 100 °C. The pattern does exhibit a sharpening in all scatter maxima relative to other methylcellulose patterns and a pattern of the same material before processing (PDF 00-062-1290).
III. CRYSTALLITE SIZE CORRECTIONS AND SIMULATIONS
Several important studies by research teams at the Kyoto University Wood Research Institute, Los Alamos National Laboratory, and the Centre de Reserces sur les Macromlecules Vegetales (CERMAV) have traced the development of macro-, micro-, and nanomorphologies in natural products by examining cellulosic fibers, fibrils, and microfibrils (Baker et al., Reference Baker, Helbert, Sugiyama and Miles2000; Nishiyama et al., Reference Nishiyama, Sugiyama, Chanzy and Langan2003). This work has established the relationship between biological synthesis and the nanostructural characteristics of cellulosics as observed in X-ray powder diffraction studies and has been summarized in a review article (Nishiyama, Reference Nishiyama2009)
In summary, cellular processes create fibers at the macro level which are composed of parallel fibrils aligned predominately along the fiber length. These fibrils in turn are composed of microfibrils containing nanosized crystalline domains. These domains are very acicular being 10–200 Å in width and lengths often measured in microns (Elazzouzi-Hafraoui et al., Reference Elazzouzi-Hafraoui, Nishiyama, Putaux, Heux, Dubreuil and Rochas2008; Nishiyama, Reference Nishiyama2009). There are several models proposed; in one, the nanocrystalline domains are strung together by the cellulose chains and the surfaces of the nanocrystalline domains and chains connecting the domains are typically amorphous in nature. In another, the native cellulose microfibrils are composed of a long continuous crystallite with cellulose Iβ as a core, cellulose Iα on the outside and amorphous cellulose on the surface. Nishiyama suggests that both models may be possible depending upon the cellulose species being studied. Scientists have isolated the fibers, fibrils, and microfibrils and analytically characterized the structure/morphology relationships.
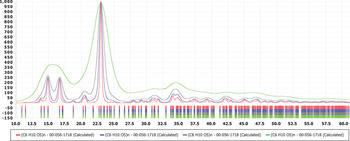
This structure/biosynthesis relationship explains the observed line broadening in X-ray, neutron, and electron diffraction patterns as being caused predominately by crystallite size broadening. It also explains the dual crystalline and amorphous contributions seen in the vast majority of cellulose samples. Indeed it is rare to see either a pure crystalline material or one of large crystallite size which are common in most non-biological materials. The measurement of the experimental crystallite size thus becomes an important factor in any cellulose experiment. Alternatively, the development of a crystallite size simulation becomes an important factor in the practical usage of cellulosic reference diffraction data. This relationship is shown schematically in Figure 1. The powder patterns produced purely from atomic parameters from crystal structure experiments with large crystallite domains are never observed in natural products or manufacturing processes that use native cellulose. As such they would not be a practical reference material until adjusted for the known crystallite sizes of the natural materials. Digitally recording experimental fiber patterns would be beneficial as the fiber pattern would include the crystallite size information; however, the ICDD database did not capture this information until recently due to the storage space requirements of multidimensional data sets.
Calculated XRD patterns of various crystallite-sized cellulose Iβ. In the simulations, crystallites of 20, 50, 100, and 200 Å were used. These data can be compared with experimental data shown in other figures.

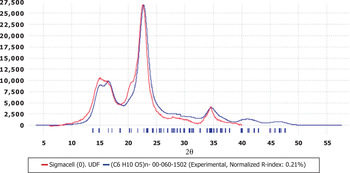
To simulate crystallite size broadening in patterns calculated from crystal structures, ICDD integrated the crystallite size program of Scardi et al. (Reference Scardi, Leoni and Faber2006) into the PDF databases. As described by the authors, this program is intended for rapid simulations where the size effect is greatly prevalent over other line-broadening sources, as is frequently the case for nanocrystalline materials. This program allows the user to input any crystallite size into the reference pattern as well as compare it with an experimental pattern. An example is shown in Figure 2, where a simulation of 50 Å cellulose Iβ is compared with a high purity cellulose fiber obtained from Sigma–Aldrich. This process easily identified the cotton linters as being predominately composed of cellulose Iβ. An advantage of having the crystallite size simulator integrated into the PDF database is that large numbers of reference data sets can be converted to the same crystallite size and compared with the pattern of an unknown. For example, any cellulose pattern from a wood, cotton or other natural product source can be compared with a user-defined database containing a user-defined crystallite size. Analytically, the identification process can be aided by using similarity indices, such as those found in the commercial programs PolySNAP by Bruker-AXS, Cluster Analysis by PANalytical and Materials Data Inc., or the normalized R-Index developed by the ICDD. This latter index was used to match the patterns shown in Figure 2. Similarity indices can compare reference and experimental patterns on a point-by-point basis so they are very sensitive to line broadening effects.
XRD pattern of Sigmacell cotton linters compared with a database comprising 50 Å cellulose reference materials. The data matched a 50 Å microcrystalline cellulose Iβ reference using a similarity index pattern matching algorithm. The simulation and experimental data are both shown in the diffraction pattern.

The general issues and difficulties of accurately determining the amorphous profile and methods for separating this profile from the background in order to quantify the amorphous content have recently been described in a systematic study (Madsen et al., Reference Madsen, Scarlett and Kern2011) that explored several common full pattern fitting methodologies.
With nine authors working in six laboratories there were hundreds of analyses performed on the 80 data sets. Commercial programs were used for all analyses and anyone seeking more details of the programs or how they function can contact the specific software vendor. A general problem with all analysis programs was the number of variables that could be applied relative to the number of observations in the data, which is a complex way of saying that the programs were much more complex than the data. The use of full digital patterns in the analyses helps in the refinements as it maximizes the experimental data points. As shown in the various figures in this publication the diffraction patterns consist of very broad peaks (small crystallite size) with a few sharp features. In addition the body of the historic literature would suggest that most data sets should be expected to have contributions from one or more nanocrystalline polymorphs and one or more amorphous components. Every point in the measurement range would be expected to have multiple contributors to its intensity, making pattern deconvolution and refinement difficult. In general, separating out background from amorphous content is a significant challenge in many X-ray powder diffraction experiments where one desires to quantify amorphous and crystalline contributions (Madsen et al., Reference Madsen, Scarlett and Kern2011).
Short program descriptions of the programs used are given below.
A. Pattern fitting
Pattern fitting algorithms are embedded in the software suites of PDF-4+ and HighScore Plus, developed by ICDD and PANalytical, respectively. The algorithms use the experimental data to appropriately auto scale the identified contributing patterns, but in both cases the scaling can be overridden by the user. In both cases the user needs to apply a background removal procedure, typically using the Sonneveld–Visser algorithm (Sonneveld and Visser, Reference Sonneveld and Visser1975), to the experimental and component data. The user identifies the components, often through the use of a search/match identification program, but this is not a requirement. Both HighScore Plus and PDF-4+ contain embedded search/match programs. Both programs can utilize digital patterns from experiments or reference sources such as the PDF-4+ database. Reference patterns offer the advantage that a crystallite size can be calculated, as described above, and then the appropriate size material can be used in the fitting process. Both software packages allow for patterns to be shifted and both packages allow for components to be composite summed. The software can auto scale patterns but it does not refine, so users must use an iterative trial and error graphics approach to find the best solution.
B. RIETVELD refinements
Two programs were used: HighScore Plus and GSAS. In all cases, atomic coordinates were obtained from the PDF-4+ database, which, in turn, were obtained from ab initio structure calculations (Kaduk and Langan, Reference Kaduk and Langan2002). In HighScore Plus, default parameters were used throughout the process. The use of default parameters results in a refinement of the scaling factors, unit cell parameters, crystallite size, and background function. The user can follow the refinement cycles graphically as various parameters are block refined. In the case of cellulose materials, the refinement proceeds poorly until the crystallite size is modified due to the large peak widths. The interaction between the unit cell parameters and crystallite size at small sizes can lead to convergence with highly distorted unit cells. In these cases, it is preferred to refine the crystallite size and scaling prior to the unit cell refinement. GSAS was also used and a block refinement approach was taken so that small crystallite sizes were applied without distorting the unit cell. The unit cell and finally atomic coordinates were refined in the latter cycles of the refinement. Similar to HighScore Plus a graphical interface was used to monitor the influence of various variables on the refinement. One of the authors, James Kaduk, has significantly more experience in Rietveld refinement and he also added a diffuse scattering function to approximate the amorphous content in the data sets. Different authors of this paper noted the close correlation parameters between small crystallite size cellulose II and amorphous cellulose. The degree of correlation was quantified by the cluster analyses/similarity indices described below.
C. Cluster analyses/similarity indexes
Three programs were used to look at similarity and clusters among the 80 data sets. These programs were HighScore Plus cluster analysis, PolySNAP, and two similarity indices embedded into PDF-4+. The programs in HighScore Plus and PolySNAP are based on the pioneering work of Chris Gilmore and co-workers (Barr et al., Reference Barr, Dong and Gilmore2004a, Reference Barr, Dong, Gilmore and Faber2004b; Gilmore et al., Reference Gilmore, Barr and Paisley2004) in applying cluster analyses to X-ray powder diffraction data. The programs embedded into PDF-4+ are based on modifications of the work of Hoffman and Kuleshova (Hofmann and Kuleshova, Reference Hofmann and Kuleshova2005; Faber and Blanton, Reference Faber and Blanton2008). All the three commercial programs had significant modification made by the software development groups of the software developers, as described in the program help files. In general, these modifications were customized for powder diffraction applications (data processing) and improvement in user friendliness, such as extensive graphic interfaces.
The cluster analyses utilize digital data sets. The data sets can be either experimental powder data or digital pattern simulations based on experimental parameters from single crystal and powder diffraction experiments. The ICDD PDF-4+ database uses three separate algorithms to calculate digital patterns. The algorithm used depends on the amount and type of data available from the reference data. If the reference originated from powder diffraction data, an instrumental function is applied to the d, I listings to produce a digital pattern. If structures factor and unit cell are available a pattern is calculated from the structure factors. If atomic parameters are included then a pattern is calculated from these parameters. Every reference in every ICDD database (>8 00 000 references in total) can be calculated as a digital pattern using one of these three algorithms. The patterns can then be modified for various types of instrumental parameters (wavelength, optical geometry), as well as crystallite sizes, angular range, and step size. In this way, all references can be standardized to a particular instrument and specimen configuration and then compared with experimental data taken under similar conditions (Faber et al., Reference Faber, Weth and Bridge2004; Faber and Blanton, Reference Faber and Blanton2008; Fawcett et al., Reference Fawcett, Faber, Kabekkodu, McClune and Rafaja2005). The reference data can be exported in a variety of common formats to be used as input files to the three commercial programs mentioned above.
The authors performed numerous cluster analyses using PolySNAP, HighScore Plus, and the ICDD similarity index programs as well as pattern fitting through Rietveld refinements. In addition, PolySNAP contains a pattern fitting module where designated references can be used to fit experimental patterns. These programs were very useful for clustering experimental data by polymorph content and crystallite size and elucidating trends in both.
D. Crystallinity
The programs described above all have embedded algorithms that integrate the area of the measured component phases which is why, in general, they are called whole pattern fitting methods. Percent crystallinities are calculated by taking the integrated area of the crystalline component and dividing by the integrated areas of the crystalline and amorphous components. This percent crystallinity is a relative determination which can be used to track trends among different celluloses or trends in processing treatments. Quantitative measurements require scaling to account for the scattering intensity of each contributed phase. This can be based on an experimental I/Ic, a calculated I/Ic, or a scale factor based on the atomic and molecular scattering factors as calculated in a Rietveld refinement. In related experiments, not part of this study, one of the authors has used a combination of experimentally determined I/Ic for amorphous cellulose and calculated I/Ic's from the crystal structures to determine crystallinities, another author has used Rietveld refinements with a polynomial function for the amorphous contribution. In all crystallinity measurements, a careful analysis and subtraction of the background are required.
IV. RESULTS AND DISCUSSION
A. Cellulose
The crystal and molecular structures of the cellulose Iα, Iβ, and II (Kaduk and Langan, Reference Kaduk and Langan2002) were used to produce three reference patterns. These three patterns were then compared with experimental pulp and paper samples collected by the authors. To facilitate a comparison between patterns calculated from the crystal and molecular structures and experimental patterns, the calculated patterns must be adjusted for the approximate crystallite size of the experimental data. The authors used the crystallite size simulation algorithm in PDF-4+. It should be noted that one of the practical consequences of crystallite size broadening is that peaks begin to overlap each other, especially at nano sizes. In addition, there is a rise in the diffraction pattern background, especially prominent in celluloses between 18 and 22°2θ, as shown in Figure 1. This increase in background intensity has frequently been attributed (incorrectly) to amorphous content. Many historic XRD measurements of crystallinity in celluloses may have been systematically low if the crystallite size effects were not handled properly.
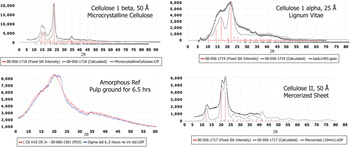
The correlations between the resolved crystal structures, crystallite size adjusted powder patterns and experimental specimens for the three different polymorphs are shown in Figure 3.
Polymorphism in cellulose as demonstrated by panels comparing polymorphic simulated XRD patterns of various crystallite sizes with experimental data. The peak positions corresponding to indexed crystal structures are shown as stick figures. The bottom left panel contains all experimental data demonstrating the amorphous state vs. a specimen with a small amount of crystallinity.

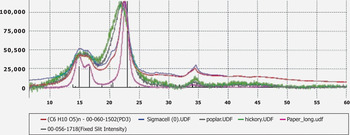
As we had a large collection of native wood specimens it was quickly observed that the cellulose Iβ polymorph could be readily identified in the vast majority of wood and cotton linter specimens, see Figure 4. The cellulose II polymorph was readily identified in three mercerized specimens. Both of these observations are consistent with the known cellulose chemistry. However, this work provided a straightforward linkage between the structure and observed experimental powder patterns through the use of crystallite size simulations. Different crystallite sizes were used to obtain the best match with the observed data.
XRD patterns demonstrating variations in cellulose patterns from cotton linters and wood specimens exhibiting a range of crystallite sizes. The largest crystallite size in this series corresponds to a processed paper (80 Å) and the smallest to hickory wood (30 Å). The predominant polymorphic form is cellulose Iβ, as displayed in the stick pattern of PDF 00-056-1718.

We did not have many specimens of cellulose Iα. In fact we were very surprised to find that one of the wood specimens, Lignum Vitae, appears to match a cellulose Iα of small crystallite size. The authors tried to validate the model prediction by a measurement of the domain size of this specimen through a pair distribution function analysis. The pair distribution analysis confirmed that the crystallite size was very small, ~15 Å as compared with the 25 Å in the simulation. The pair distribution function analysis also indicated that the unit cell and bond distances were distorted. According to some authors, with very small crystallites, there should be a very high percentage of Iα chains on the microfibril surface. For Lignum Vitae, Rietveld refinements were inconclusive relative to identification of polymorphic form since both a cellulose Iα and cellulose Iβ structures led to a successful refinement, even though the latter resulted in a heavily distorted unit cell.
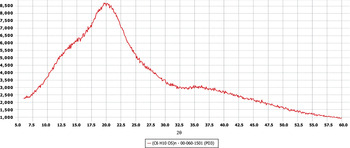
To be able to calculate a cellulose percent crystallinity, it was desirable to have an amorphous reference. Previous authors have tried to simulate an amorphous pattern (Bates et al., Reference Bates, Zografi, Engers, Morris, Crowley and Newman2006; Elazzouzi-Hafraoui et al., Reference Elazzouzi-Hafraoui, Nishiyama, Putaux, Heux, Dubreuil and Rochas2008), or have tried to account for the amorphous content by using an internal standard to calibrate the crystalline component, calculate total specimen absorption and then derive the amorphous content by assuming that crystalline and amorphous equals 100%. One of the authors of this publication made an amorphous reference through cryogrinding crystalline materials, taking periodic samplings and checking for crystallinity. This process was carried out with three different cellulose sources, all of which resulted in the same final pattern shown in Figure 5. This is the pattern for PDF 00-060-1501. These two basic methods are often referred to as indirect and direct methods of amorphous determination (Madsen et al., Reference Madsen, Scarlett and Kern2011), where having an amorphous reference is a key component of the direct method.
XRD pattern of amorphous cellulose. A specimen of high crystallinity cellulose Iβ was systematically cryoground until a reproducible pattern was achieved. The cryogrinding experiment was reproduced with another cellulose Iβ source specimen and a third specimen containing a mixture of cellulose Iβ and cellulose II. The end patterns of all three experiments from the three sources were superimposable.

For those that have studied cellulose diffraction measurements for several years, this pattern has several unusual characteristics. First, the pattern has several broad maxima centered at approximately 13, 20, 26, and 36°(CuKα radiation), and clearly more than three which are typically used to describe orthogonal incoherent scattering vectors in an amorphous material (Bates et al., 2006). Second, the total scattering envelope covers the entire two theta measurement range which is a much broader range than those used in aforementioned modeling simulations. The multiple scattering maxima are attributed to additional local order in the cellulose chains, which are enhanced by intramolecular hydrogen bonding, and have been observed in other organic systems with intramolecular hydrogen bonds (Bates, Reference Bates2010). The broad scattering envelope means that it is very difficult to establish a baseline useful in separating the amorphous scattering from other background scattering effects. Even with highly automated methods this means that every point in the measurement range is likely to have crystalline contributions, amorphous contributions, and background instrumental contributions, increasing the difficulty of applying deconvolution methods (Madsen et al., Reference Madsen, Scarlett and Kern2011). In this work, the authors used several methods to determine crystallinity including pattern fitting, Rietveld, and several cluster analysis algorithms. The separation of background and amorphous contributions from crystalline contributions remains the largest source of measurement error and variance in the measurement results. This results in crystallinity measurement procedures that can be of high precision but moderate accuracy. In addition, historical methods tended to use a simple scattering profile over a narrow angular range, which would tend to underestimate the amorphous content in percent crystallinity measurements. While not the subject of this paper, the ICDD has been collecting patterns of amorphous materials for the past several years and for many materials the scattering profiles cover a broad two theta range and exhibit multiple maxima. We believe that the general issues of trying to resolve the background from amorphous contributions is a common problem in trying to determine the amorphous content of many materials.
The amorphous cellulose experimental reference (PDF 00-060-1502) provides appreciable insight into crystallinity measurement but also has limitations. The reference was produced under specific specimen preparation (cavity mount) and instrumental conditions (Bragg–Brentano) and the scattering profile may not be appropriate for specimen conditions or instrumental optics that are significantly different. In the development of this reference we used the most common specimen preparation method and optical system in practice today.
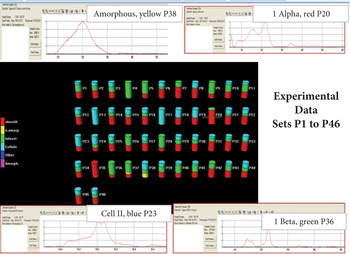
With the establishment of these cellulose references we now have a set of reference materials that can be used to study polymorphism and crystallinity in native celluloses. In Figure 6, we have used these four references and the program PolySNAP 2.0 to calculate crystallinity and polymorphism in a series of 46 wood and pulp specimens. For these measurements, all reference materials were calculated at 50 Å mean crystallite size. When analyzed individually, either by automated Rietveld refinement or by interactive pattern fitting, the crystallite sizes of these specimens ranged from 15 to 200 Å. The 50 Å calculation represented a compromise that allows for rapid automated analysis and reasonable pattern matches for the majority of these specimens. The use of 30 and 100 Å reference materials resulted in poor polymorph separation in the case of the former and poor data fits for many materials in the latter case. It should be noted that iterative analyses showed that the 50 Å reference set was the preferred reference set for analysis of this particular set of wood and pulp specimens, and analysis of other specimens would require another iterative analysis.
Selected output concerning the cluster analysis of 46 pulp and paper samples using the Program PolySNAP 2.0. In this experiment, four reference diffraction patterns were used as calibration references, three polymorphs of cellulose and amorphous cellulose. The columns in the center show the composition of each pulp or paper based on the four references. The patterns on the four corners show experimental XRD data scans that were assigned predominately to one reference.

In the PolySNAP overview selected cells were chosen, namely cells 20, 23, 36, and 38 that had contributions from the four reference patterns used in the analysis, which are also shown in Figure 3. The dendrogram and PCA diagram associated with these data sets also grouped them by polymorph and crystallite size.
Rietveld analysis offers the advantage that the crystallite size can be refined, not simulated, during the refinement of the atomic structure and unit cell parameters. Excellent fits (routinely below Rw of 5.0%) were achieved for nearly all cases. However, some caution needs to be exercised. For the case of several wood pulps, the use of the structure for cellulose Iα or cellulose Iβ both resulted in acceptable refinements. The Rietveld refinement process would both shift the unit cell and change the crystallite size to account for the broad maxima in the experimental patterns. “Chemical sense” needs to be applied; with severely shifted unit cells the bond angles and distances within the structure can become unrealistic. In a select few of the samples, a second experiment was run with the aim of having a pair distribution function analysis. This provides an independent confirmation of the coherence length within the microcrystalline domain (Petkov et al., Reference Petkov, Ren, Kabekkodu and Murphy2012). In the case of USP microcrystalline cellulose, the pair distribution analysis confirmed a microcrystalline domain of approximately 40 Å and provides a consistent interpretation that the material is predominately cellulose Iβ with a 40 Å crystallite size. Several additional specimens are currently being tested.
Some authors (Nishiyama et al., Reference Nishiyama, Chanzy, Wada, Sugiyama, Mazeau, Forsyth, Riekel, Mueller, Rasmussen and Langan2002; Baker et al., Reference Baker, Helbert, Sugiyama and Miles2000) have shown electron diffraction evidence that cellulose Iα and cellulose Iβ polymorphs can co-exist in the same microfibril and have further stated that cellulose Iα appears to be predominately on the surface. They hypothesize that all native cellulose specimens are mixtures, even though the Iα/Iβ ratio is widely variable and source dependent. While this hypothesis is consistent with our data on wood pulps we cannot conclusively confirm or deny this interpretation. Another interesting aspect of this hypothesis is that it would mean that most natural celluloses should be a three-component system of cellulose Iα, cellulose Iβ, and amorphous cellulose.
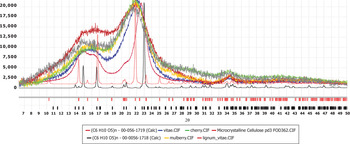
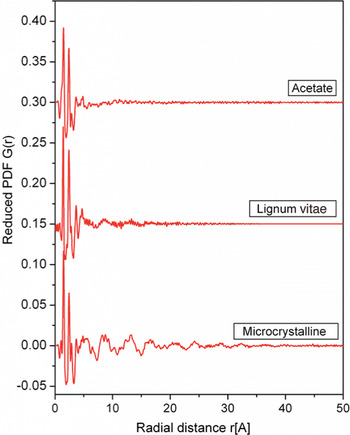
In Figure 7, we show the extremes exhibited in our study between a microcrystalline cellulose powder and lignum vitae pulp. The stick patterns produced by the pure crystallographic polymorphs are shown. Cellulose 1α exhibits a characteristic (001) peak at 10.28° a shifted d-max (−110) peak at 21.80°and an isolated (−111) peak at 25.04° in comparison with the patterns for cellulose Iβ. The pattern of lignum vitae has intensity at these characteristic positions that are clearly distinguished from the pattern of microcrystalline cellulose. However, both crystallite size analysis and pair distribution function analysis demonstrate that lignum vitae is of small crystallite size (15–25 Å). Pair distribution function analysis has been very useful in the interpretation of crystallite size and amorphous broadening since the analysis is very sensitive to the crystalline domain size as shown in Figure 8.
Comparison of XRD pattern data extremes demonstrated in native cellulose samples. From the bottom: two references of cellulose Iβ and Iα calculated from their crystal structures. The bottom experimental pattern is from a microcrystalline cellulose that has been analyzed as predominately small crystallite-sized cellulose Iβ. The experimental diffraction patterns of poplar, cherry, mulberry, and lignum vitae demonstrate a shift to lower angles for the primary diffraction maxima and additional intensity at lower angles.

Radial distribution of three cellulosic specimens, cellulose triacetate, lignum vitae, and microcrystalline cellulose as analyzed by pair distribution function analysis. These data exhibit varying domain lengths as shown from top to bottom.

Figure 8 exhibits the pair distribution analysis of two of the samples shown in Figure 7 and a cellulose acetate that is shown in Figure 9. There is a very nice correspondence between the crystallite size calculated for these specimens and the domain radial distance as calculated in the pair distribution analysis. This explains our interpretation of lignum vitae and microcrystalline cellulose as containing nanocrystalline domains and the interpretation of cellulose acetate as an amorphous material. The “micro” designation in microcrystalline cellulose refers to fiber sizing done by the commercial manufacturer, not a crystallographic interpretation.
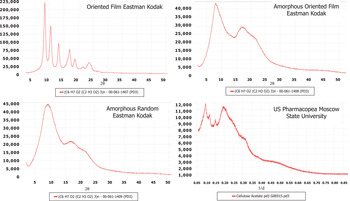
X-ray diffraction patterns of cellulose triacetate that were processed under varying degrees of mechanical and thermal processing. The processing treatments changed molecular orientation and crystallinity.

In reference to the data shown in Figure 7, with such small crystallite sizes we would expect some intensity at characteristic α positions due to line broadening, even if the materials were cellulose Iβ. The shift in d-max would favor an interpretation of either a distorted unit cell or the presence of cellulose Iα. Several wood pulps such as yellow mahogany, butternut, hickory, maple, cherry, white oak and redwood exhibited both a d-max shift and intensity at the (001) peak suggestive of a Iα, Iβ mixture of polymorphs. These wood pulps also had small crystallite sizes consistent with the concept of more Iα content if the alpha polymorph was favorable on the crystallite surface. We have studied several wood pulps such as poplar, pine, red oak, blue spruce, and walnut that exhibited a small crystallite size but did not exhibit a d-max shift or much intensity at the (001) peak location and were clearly identified as predominately cellulose Iβ.
In both pattern fitting and clustering techniques, there was a strong correlation dependence between the patterns of cellulose Iβ and cellulose Iα, as well as between cellulose II and amorphous cellulose. These correlations became stronger with decreasing crystallite size. The strong correlation factor between the amorphous state and one of the crystallite polymorphic states has been frequently observed in organic and pharmaceutical compounds (Bates et al., Reference Bates, Zografi, Engers, Morris, Crowley and Newman2006; Bates, Reference Bates2010). Overall these tools are very useful in obtaining precision in crystallinity, crystallite size, and polymorph identification analyses; however, the strong pattern correlations prevent high accuracy unless steps are taken to obtain additional supporting data (fiber patterns, NMR, infrared, and pair distribution function analysis) and standardized reference patterns.
In the paragraphs above, we have described the difficulties in crystallinity measurements and polymorph identification due to the degree of crystallite size broadening and broad angular range for both amorphous cellulose and nano size cellulose polymorphs. In general, the opposite is true; when crystallite sizes are larger the peaks narrow, overlap diminishes, crystallinity measurements and polymorph identifications are easier. In our studies, high-purity commercial pulps and cotton linters were clearly and predominately cellulose Iβ. Mercerized specimens were clearly mixes containing cellulose II where the cellulose II content was introduced with the mercerization process.
B. Substituted celluloses
Substituted celluloses offer even more complexity. In addition to starting materials having amorphous and crystalline regions and different polymorphs with varying hydrogen-bonding motifs, the cellulose chain offers three –OH groups per β-glycosyl unit. In the production of substituted celluloses each of the three groups can become a reaction site and their accessibility to reactants can be varied depending on the crystallinity. The amorphous regions are generally more accessible than the interior of a crystallite. The huge variety of commercial cellulosics and their properties often relate to the total degree of substitution and the substitution distribution pattern of unsubstituted, mono-, di-, and trisubstituted monomer units in the chains. It is conventional to discuss the degree of substitution for a particular cellulose grade. The degree of substitution is put in reference to the three reaction sites, so it is usually cited on a scale of 3. The exact degree of substitution is usually determined from NMR measurements, and these measurements are required to correctly identify subtle differences in XRD patterns.
In PDF there are several dissimilar patterns for ammonia cellulose, methylcellulose, and nitrocellulose. Several of the authors have worked extensively with cellulosics and we attribute most of the differences to differences in substitution patterns both in terms of total substitution (scale of 3) and distribution of reaction sites. In the case of ammonia cellulose, it is known that treatment by ammonia can alter the hydrogen-bonding network (cellulose III) and then various levels of ammonia can incorporate into the cellulose lattice (Wada et al., Reference Wada, Yoshiharu, Chanzy, Forsyth and Langan2008).
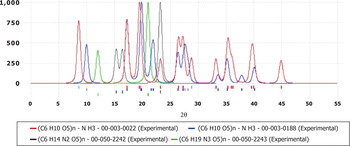
It is worth noting that when cotton linters were exposed to ammonia as noted in the experimental details section of PDF 00-050-2242, there was very little to no reaction since the XRD pattern is indistinguishable from cellulose Iβ. With the other three ammonia cellulose diffraction patterns, all are different and the original authors did not record any supporting compositional data. These four patterns are shown in Figure 10. This is a case where we have historical reference data but there is insufficient information for interpreting the structural significance of the changes.
Four digital X-ray diffraction pattern simulations for four independent determinations of ammonia cellulose, each pattern is clearly distinguishable from the others.

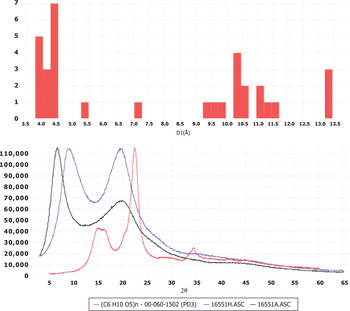
A non-uniform substitution distribution can disrupt the formation of crystallites and therefore many substituted celluloses exhibit amorphous behavior when analyzed by powder diffraction. This was demonstrated by June Turley of the Dow Chemical Company (Turley, Reference Turley1965) for methyl-, ethyl-, and propylcellulose. In general, all three patterns have scattering maxima at approximately 4.0–4.5 Å and a more distinct second scattering feature at higher interplanar spacings. A summary in the form of a histogram plot of the maximum intensity d-spacing vs. hits taken at 0.5 Å increment for 33 cellulose patterns in the Release 2012 PDF-4+ database is shown graphically in Figure 11. For the histogram, the d1 for most unsubstituted celluloses are on the left and the d1 for most substituted celluloses are on the right.
Top: The maximum d-spacing distribution for cellulosic materials in the Release 2012 PDF-4+ database. Bottom: Characteristic examples from experimental data. The two with major peaks at low angles are substituted celluloses while the third pattern is unsubstituted.

These data have recently been supplemented with reference patterns of cellulose triacetate. Three samples were processed under distinctly different conditions. The conditions were designed to study crystallinity and molecular orientation. These materials are shown in Figure 9. Cellulose triacetate is a highly substituted cellulose where the total degree of substitution is ~2.7 out of the three reaction sites. This high level of substitution can actually enhance crystallinity because of the higher uniformity of the substitution pattern when nearly every available site is reacted. In Figure 9, one can see a highly crystalline specimen where the sample was stretched to induce strain, a small amount of strain crystallization and then slowly annealed at 275 °C for 2 h. This pattern can be compared with a pattern where the specimen was not subject to mechanical forces and another where mechanical forces were uniaxially applied but the specimen was not annealed. Taken as a group they show a wide variation in crystallinity and molecular orientation. With these data we can now analyze the fourth specimen taken in the series, a commercial powder specimen of USP grade cellulose triacetate. By reference the USP specimen is shown to be a crystalline/amorphous blend in a ratio of approximately 80/20 in integrated areas, whereas the crystalline contribution has a crystallite size of 80 Å.
If one studies a histogram of the longest d-spacings for each of 33 known patterns of substituted and unsubstituted celluloses, there is a progression from the unsubstituted celluloses to those with large functional groups such as cellulose propionate and cellulose acetate butyrate as shown in Figure 12. Most of these references exhibit an amorphous pattern; however, the patterns are characteristic relative to the chemistry of substitution along the cellulose chain.
Longest d-spacing for each of 33 known cellulosic materials contained in the Release 2012 PDF-4+ database.

The longest interplanar spacings are usually associated with larger cell volumes and cell edges in crystalline materials. This chart includes both crystalline and amorphous materials. It should not be surprising that the unit cell increases in volume as larger molecules bond with the cellulose chain and that distances between chains increase with more substitution for amorphous materials.
Table II shows 13 reference materials that were developed for studying cellulosics. Five references were developed for studying native cellulose and its polymorphs and eight references are for substituted cellulose. These materials differ from previous cellulose references in the PDF in that all have complete experimental patterns suitable for pattern fitting techniques. These new references include supporting analytical data such as NMR results, TGA, elemental analyses or pair distribution analyses which sometimes enable the user to extract structure interpretation information along with phase identification.
By carefully collecting experimental patterns and including them in the PDF the authors are attempting to help users not only identify materials but also classify them based on their orientation, crystallinity, and crystallite size. By using more complementary analytical data with these references the authors hope to provide structural insight and morphological interpretation on the reference data and ultimately on the users' analysis of cellulosic materials.
V. CONCLUSION
A program of study has been initiated to produce reference materials useful for the diffraction analysis of cellulosics. This program has produced 13 references published in the PDF. These represent a new class of references in that they include various states of crystallinity and crystallite size and they typically have more stringent criteria for supplemental analytical data to further define purity and structural characteristics.
In the practical analysis of polymorphic content and crystallinity, the authors found that the crystallite size of the specimen can have a dramatic influence on the results. Diffraction profiles are broadened and many specimens have mixed crystalline/amorphous and polymorphic content. Deconvoluting the various contributions to the diffraction pattern can be a challenge for most automated methods, especially as the crystallite size decreases and/or amorphous contributions increase.
The authors welcome contributions from scientists who have read this paper. Contributions can be in the form of reference data of the type described in this report or of materials that can be studied by volunteer scientists or ICDD grantees. This is an ongoing study and we expect further references to be developed.
ACKNOWLEDGEMENTS
The authors are grateful to corporate sponsors and major universities for the contributions of instrumentation and software and to intelligent scientists who are devoted to the study of cellulosic materials. The corporate sponsors are the author's employers but also include OEMs and software developers in the field of X-ray analysis specifically mentioned in this paper.