


Introduction
The McMurdo Dry Valleys (MDV) are impacted by circulation from three regions: the relatively warm, humid Ross Sea; the cold, dry East Antarctic ice sheet; and the low-elevation Ross Ice Shelf system made up of climate systems over West and East Antarctica. The Transantarctic Mountains are a natural barrier for weather systems, and their steep elevation gradient enhances the climatic contrasts in the MDV. A shift in the relative contribution from any of the three adjacent climate systems will result in significant changes of the MDV climate, potentially amplifying regional climate change at local scales. Ice cores from the MDV can therefore provide a record of climate variations that may not be detectable in cores from the Polar Plateau.
To reconstruct past climate from glaciochemical data, it is necessary to understand site-specific factors controlling chemical species deposition and preservation. Previous studies of spatial variability in snow chemistry have been used to explore aerosol sources and transport mechanisms, the influence of elevation, annual accumulation and distance to the sea (Reference Mulvaney and WolffMulvaney and Wolff, 1994; Reference WagenbachWagenbach and others, 1998; Reference Wolff, Wagenbach and LegrandWolff and others, 1998a, Reference Hall, Mulvaney, Pasteur, Wagenbach and Legrandb; Reference Kreutz and MayewskiKreutz and Mayewski, 1999; Reference KreutzKreutz and others, 1999). Four snow pits across the MDV were sampled and analyzed to investigate glaciochemical characteristics of the MDV to enhance the interpretation of ice-core records from individual MDV sites.
Methods
The sampling surface of the snowpack was cleaned with a pre-cleaned plastic spade, and subsequently with a scalpel, at least 20 cm horizontally into the snow profile, to prevent sampling of contaminated snow. All tools, sampling equipment and bottles were rinsed and soaked with ultrapure 18 MΩ Millipore® water and dried in a class 100 facility prior to fieldwork. Samples were collected in high-density polyethylene (HDPE) trays and poured into HDPE Nalgene® 60 mL sample bottles. Tyvek® clean suits and dust-free polyethylene gloves were worn to prevent sample contamination by personnel. Sample bottles were stored in the snow at temperatures at least below –18˚C.
Major-ion concentrations were measured for cations (Na, K, Mg, Ca, NH4) using a DionexTM ion chromatograph with Dionex CS12 column and 20 mM methanesulfonic acid eluent. Anion concentrations (Cl, NO3, SO4) were measured with a Dionex AS11 column, 6.0 mM NaOH eluent. For both measurements a 0.25 mL sample loop was used. Methylsulfonate (MS) contentwas measured with Dionex AS11 column with 0.1 mM NaOH eluent and a 1.60 mL sample loop.
Samples were analyzed for Al, Ca, Cu, Fe, K, Mg, Mn, Na, P, S, Si, Sr and Zn using a Perkin-Elmer Optima 3000 XL axial inductively coupled plasma optical emission spectroscopy with a CETAC Technologies ultrasonic nebulizer (ICP-OESUSN). Rubidium was used as an internal standard for sodium, yttrium for all other elements. External quality-control samples were run every ten samples. Reproducibility for most species is within <±5% (n = 130), with the exception of Fe and Mg, which is within <±10% (n = 130). 18 MΩ Millipore® water blanks were processed along with samples to analyze background levels and potential contamination during sample processing. Results were close to the detection limits and showed no significant contamination.
Oxygen isotope ratios (δ18O) were measured using a CO2 dual-inlet system coupled to a Micromass® Isoprime mass spectrometer. Sample duplicates and standard measurements showed a precision of ±0.08‰.
Aerosol Sources for MDV Precipitation
Most ion species have multiple sources, and hence, depending on sampling location and season, their relative contribution varies. In the MDV, all major-ion species potentially contain a significant marine (Ross Sea) and terrestrial source (local dust from the MDV). The snow profiles in this study were sampled along a transect from the coast to the Polar Plateau, to yield results intended to be representative of the relative importance of marine vs terrestrial input.
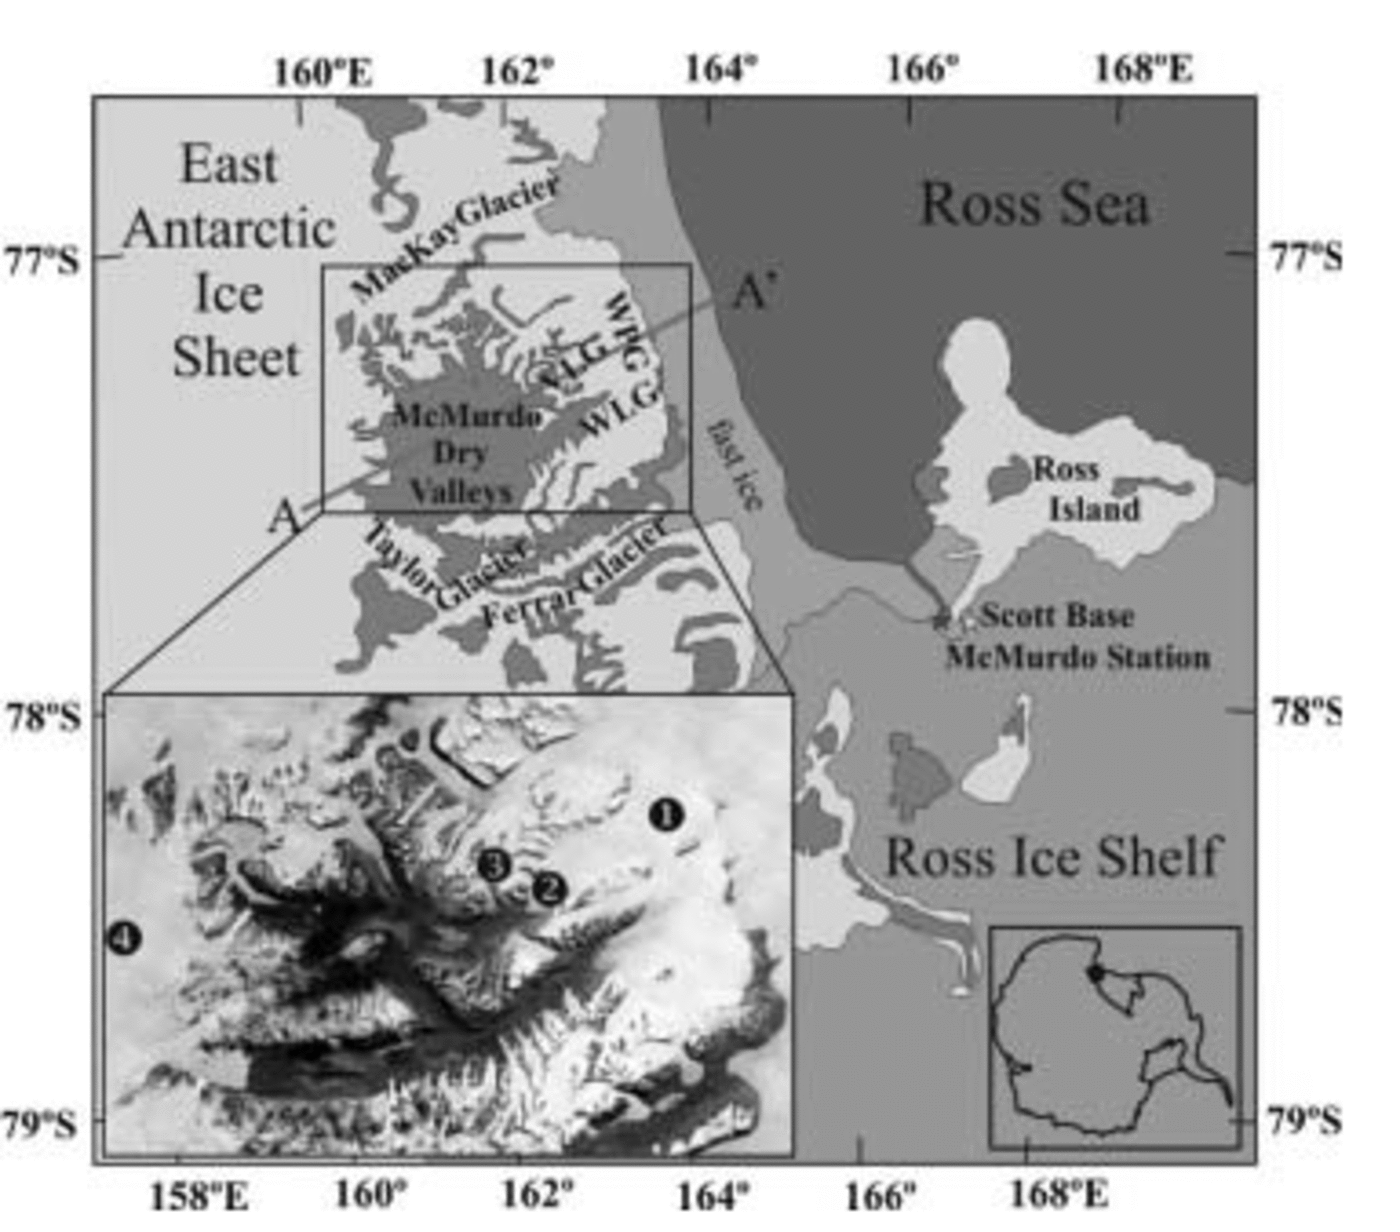
The locations of the four snow pits are shown in Figure 1: (1) Wilson Piedmont Glacier (WPG); (2) Victoria Lower Glacier (VLG); (3) Baldwin Valley Glacier (BVG); and (4) Polar Plateau near Shapeless Mountain (PP). With the exception of the PP study site, all sites are situated on locally accumulating glaciers that are not part of the East Antarctic ice sheet (EAIS). The sites vary in elevation and distance from the coast, ranging from 50 to 2400ma.s.l. and 8 to 93 km, respectively (Table 1). The snow profiles are 1.8–4.2m deep and provide a climate record for the last 15–42 years.
Map of the McMurdo Dry Valleys (MDV) and vicinity. Victoria Lower Glacier (VLG) is part of Wilson Piedmont Glacier (WPG) and lies between the Ross Sea, the MDV and the EAIS. WLG = Wright Lower Glacier. A–A' represents approximate location of schematic transect shown in Figure 4. Left inset: study sites in the MDV: (1) Wilson Piedmont Glacier; (2) Victoria Lower Glacier; (3) Baldwin Valley Glacier; (4) Polar Plateau, 5 km to the east from where indicated (source: United States Geological Survey satellite imagery). Right inset: location in Antarctica.
Overview of elevation, continentality, annual accumulation, and contaminant concentration at the study sites: Wilson Piedmont Glacier (WPG), Victoria Lower Glacier (VLG), Baldwin Valley Glacier (BVG) and Polar Plateau (PP)
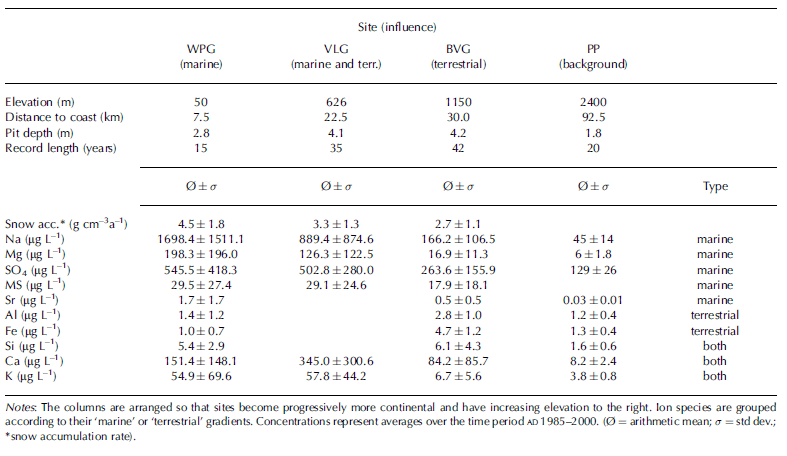
WPG is a low-elevation site (50ma.s.l.) and is situated only 7.5 km from the coast. Because of its proximity to the coast, WPG serves as a reference site for lower-tropospheric marine aerosol input. The VLG site is on an ice divide at 626ma.s.l. and feeds into WPG. It is situated between the dust-rich MDV and the seasonally open Ross Sea and is assumed to be influenced by both marine and terrestrial aerosol sources. BVG is a small valley glacier feeding into VLG. The sampling location is at 1150ma.s.l. and is surrounded by ice-free mountain peaks. As a consequence, dust input to BVG is potentially high and the site serves as a reference for terrestrial (MDV dust) aerosol input. Snow samples from PP, 20 km northwest of Shapeless Mountain at 2400ma.s.l., are studied to quantify aerosol input from distant sources that are independent of the MDV.
Average concentrations of chemical species at the four study sites are shown in Table 1. Not all ions were measured at all sites. Only those chemical species which were measured for at least three of the four snow pits are shown. These include Al, Ca, Fe, K, Mg, Na, Si, SO4, Sr and MS. Average concentrations are calculated over the time period AD 1985–2000, the longest common dataset. A common time period was chosen to avoid the effect of different climate events occurring at different depths in the four snow profiles.
Overall, major-ion concentrations at the four sites are comparable to or higher than other coastal Antarctic snow and ice samples (Reference Mulvaney and WolffMulvaney and Wolff, 1994; Reference Kreutz and MayewskiKreutz and Mayewski, 1999). In the MDV, Na, Mg, SO4, MS and Sr have higher values near the coast and gradually lower concentrations farther inland, suggestive of a predominantly marine source (Table 1). MS is thought to have only a marine source (Reference Mulvaney, Pasteur, Peel, Saltzman and WhungMulvaney and others, 1992) as verified by the trend in the MDV data. Al, Fe and Si have an opposite gradient (no data are available for VLG), with the highest values at the dust-rich site (BVG) and lower values towards the coast and the PP. Consequently, the dominant source for Al, Fe and Si is likely MDV dust, consistent with a previous study at Meserve Glacier, Wright Dry Valley (Reference Mayewski and LyonsMayewski and Lyons, 1982). However, Si concentrations are too high at WPG to consist primarily of sea-salt Si. Instead, Si at WPG may originate partly from large diatom and algae plumes that form in the seasonal sea-ice zone of the McMurdo Sound during late summer (Reference DiTullioDiTullio and others, 2000). Ca values are highest at VLG and lowest at the predominantly marine (WPG) and terrestrial (BVG) sites. This suggests that Ca concentration at VLG is cumulatively derived from marine and terrestrial sources. K concentrations are slightly higher at VLG than at WPG, but significantly lower at BVG and PP, suggesting a dominant marine source, and potentially an additional minor terrestrial source. Spatial gradients in aerosol content indicate that while Na, Mg, MS, SO4 and Sr have primarily a marine source, Al and Fe have a terrestrial source over the 15 year average. Ca, K and Si have possibly marine and terrestrial sources. Aerosol concentrations at the MDV sites (WPG, VLG and BVG) are significantly higher than at the PP, suggesting that local sources dominate MDV aerosol input.
Species Input Timing
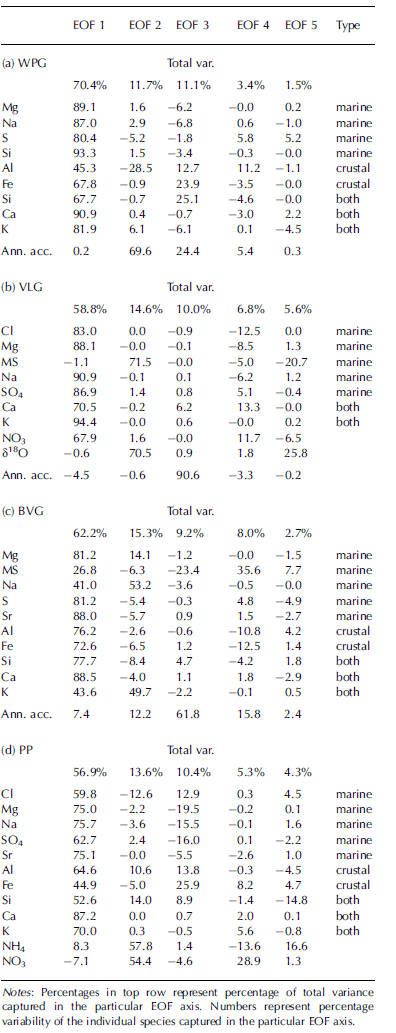
Empirical orthogonal function (EOF) analysis is used to statistically evaluate the covariance of variables in a common dataset (Reference Von Storch and Zwiersvon Storch and Zwiers, 2002). The derived EOF axes are orthogonal to each other and hence are statistically independent. In Table 2, EOF results of the glaciochemical data variability in the four snow profiles are shown. To assess the covariance at each site, all available chemical measurements as well as annual accumulation and oxygen isotope ratios are used. The snow pits were sampled at 1 cm resolution, resulting in an average of ten samples per year. All time series were resampled at seasonal resolution (winter and summer). The first five EOFs are shown, but the discussion focuses on EOF axes explaining >10% of the total variance.
EOF analysis on snow chemistry data measured for (a) WPG, (b) VLG, (c) BVG and (d) PP
Wilson Piedmont Glacier
The first axis (EOF 1, Table 2a) captures 70% of the variability of all species measured, with the exception of snow accumulation, which dominates EOF 2 and is correlated negatively to Al (29%). In EOF 3, 11% of the total data variability is dominated by terrestrial species and
Victoria Lower Glacier
EOF 1 captures 58% of the total data variance (Table 2b) and comprises all species measured, with the exception of MS, δ18O and snow accumulation. The concurrent deposition of NO3 with the local aerosols in EOF 1 is interesting, as the main source for nitrate is thought to be stratospheric (e.g. polar stratospheric clouds and tropical lightning) (Reference Legrand and DelmasLegrand and Delmas, 1986; Reference Legrand and KirchnerLegrand and Kirchner, 1990). However, Reference Gravenhorst, Müller and FrankenGravenhorst and others (1979) and Reference Savoie and ProsperoSavoie and Prospero (1982) describe a process by which stratospheric nitrate, once it arrives in the troposphere over marine environments, attaches to much larger sea-salt particles such as sodium. This seems to be true for VLG since 68% of NO3 co-varies with the remaining species. The second EOF is dominated by MS (72%) and δ18O (71%). The high covariance between the two species is suggestive of a positive correlation between temperatures (δ18O values) in the MDV (Reference SteigSteig and others, 2000) and marine productivity (MS) in the Ross Sea. EOF 3 captures 90% of the snow annual accumulation and is independent of any of the chemical species. As for WPG, the VLG EOF analysis suggests that species deposition occurs concurrently regardless of their sources, with the possible exception of MS, and that all deposition is independent of snow annual accumulation.
Baldwin Valley Glacier
At BVG, EOF 1 comprises 62% of the total data variability (Table 2c), with limited contribution from MS and snow annual accumulation. EOF 2 is dominated by Na and K, indicating a second source or transport mechanism independent of EOF 1. EOF 3 is dominated by snow accumulation, which is negatively correlated to MS. Overall, the EOF analysis of the BVG dataset suggests concurrent precipitation of 62% of the chemical species. With the exception of MS (23%), aerosol deposition occurs largely independently of snow annual accumulation.
Polar Plateau, near Shapeless Mountain
EOF 1 comprises 57% of the total data variance and is dominated by all species with the exception of NO3 and NH4. Nitrate and ammonium dominate EOF 2, suggesting a different source or independent precipitation mechanism. The independence of NO3 from the remaining chemical species stands in contrast to the NO3 co-variability as seen at VLG. The aerosol input to PP is thought to be primarily independent of the MDV and the Ross Sea, but dominated by regional aerosol sources from the Antarctic interior. This provides further evidence that at VLG NO3 may be transported by local marine aerosols, which explains the concurrent deposition at VLG. EOF 3 is dominated by marine species (Na, Mg and SO4), which are anticorrelated to terrestrial species (mainly Al and Fe) and Cl. The more complex aerosol input to PP might reflect the influence of East Antarctic aerosol deposition (e.g. winter maximum of marine species) overprinted with MDV aerosol precipitation (summer maximum of marine and terrestrial species).
The Aerosol Input Model
Snow chemistry data from the MDV are highly variable, and spatially dependent on distance to the coast and the ice-free valleys. Aerosol concentration is largely independent of snow annual accumulation, indicating that aerosol concentration data and not flux data are more suitable to investigate the MDV glaciochemical records (Reference KreutzKreutz and others, 1999). Species data at WPG, VLG, BVG and PP display high covariance as shown in EOF 1 which captures 70%, 59%, 62% and 57% of the total variance contained in the respective datasets.
The concurrent timing of maxima in aerosol concentration in MDV snow suggests either post-depositional modification (Reference Aristarain and DelmasAristarain and Delmas, 2002; Reference Delmas, Wagnon, Goto-Azuma, Kamiyama and WatanabeDelmas and others, 2003), or that aerosol deposition is similar in timing regardless of their source. Post-depositional alteration is dependent on annual accumulation, temperature gradient and crystal structure, and its effect should be larger with depth. The comparison between species variability in top and bottom layers in the snow profiles therefore provides a tool to assess the importance of post-depositional ion mobility. Chemical species time series of the VLG snow pit is shown in Figure 2. Axes are scaled logarithmically as values vary up to 3–5 orders of magnitude. All chemistry species peak concurrently in the top and bottom part of the VLG snow profile within the sampling resolution of 1 cm despite their age difference of 35 years. This is also the case in the remaining three snow profiles (data not shown). Therefore, post-depositional migration is thought to be of minor importance or to occur only at scales <1 cm.
Snowpack chemistry measurements for VLG. The 4.10 m deep snow profile was sampled with 1 cm resolution. Concentrations are in μgL–1, scales are logarithmic. Gridlines indicate concurrent peaks at three sections in the snow profile. The remaining gridlines are omitted for clarity. δ18O ratios are expressed in % Vienna Standard Mean Ocean Water (V-SMOW).
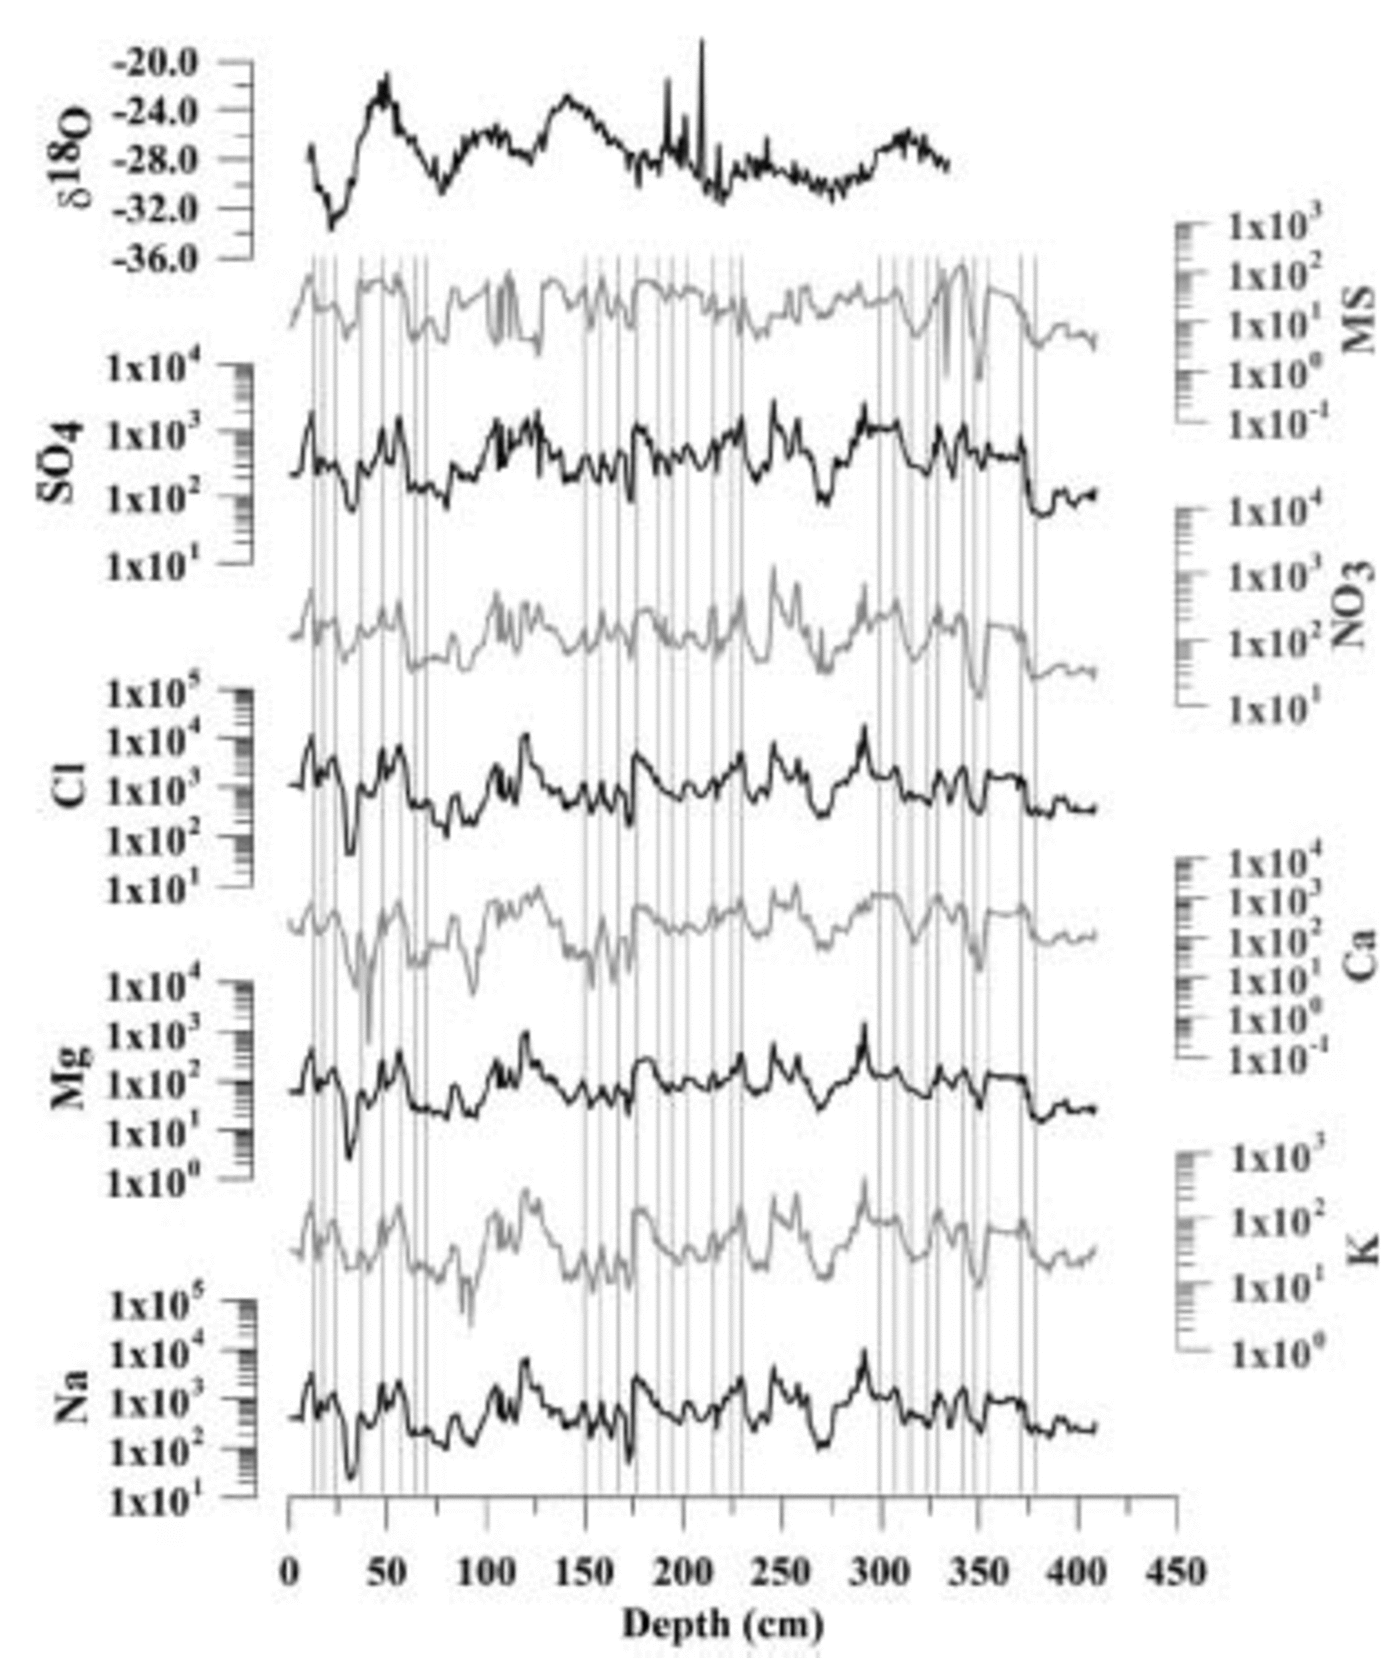
Consequently, the concurrent timing of chemical species variability is interpreted to reflect simultaneous input regardless of the source. The most important sources of the chemical species in MDV snow are marine (Na, Cl, Mg, SO4, Sr, K, Ca, MS) and terrestrial (Al, Fe, Si, Ca, K). The concurrent bulk aerosol input is unusual, as glaciochemical studies elsewhere report a distinct seasonality for aerosol species (Reference Legrand and MayewskiLegrand and Mayewski, 1997). For example, sea-salt Na concentration in snow is in general found to peak during winter/spring months when atmospheric turbidity is intensified (Reference Legrand and DelmasLegrand and Delmas, 1984), while MS peaks have been associated with summer precipitation at coastal Antarctic sites (e.g. Reference Mulvaney, Pasteur, Peel, Saltzman and WhungMulvaney and others, 1992). The snow pits in this study were sampled at the beginning of the austral summer (early to late October). Aerosol concentrations in the top snow layer at all four sites are low, including MS. Therefore, the surface snow layer is interpreted to represent winter/spring precipitation. Furthermore, the large variability in species concentration, over 3–5 orders of magnitude, cannot be explained by intensified atmospheric turbidity alone. Instead, we suggest a seasonal air-mass change model to explain the data variability and concurrent species.
The Victoria Valley Seasonality Model
Meteorological measurements at VLG during the 1999/2000 and 2000/01 austral summer field seasons show that Victoria Valley exhibits a consistent diurnal wind regime. During the warmer part of the day (1100–2300 h) the prevailing wind direction is east to southeast, coming from the Ross Sea, and during the cooler hours (2300–1100 h) the wind direction exhibits secondary maxima in a westerly direction accompanied by an increase in wind speed (Reference HendrikxHendrikx, 2001). The westerly winds promote airflow from the EAIS which is cooler, drier and significantly cleaner (PP) than the air mass originating from the Ross Sea (WPG). Daily wind flow as measured at VLG during summer 2000/01 clearly shows the diurnal wind system (Fig. 3).
Wind data recorded at VLG ice divide, 1 November– 16 December 2000. Bin size is 10˚. Length of bin sections represents % occurrence of this wind direction during entire measurement period.

This monsoonal wind regime applies also to the annual wind regime at VLG (Fig. 4) and has also been observed in Taylor Valley at Lake Hoare (Reference DoranDoran and others, 2002). The seasonal change in wind direction can be explained by radiative forcing of the MDV during summer. For most of the year, Victoria Valley is at least as cold as the surrounding mountains and ice sheet, and receives air that descends from the EAIS as katabatic winds (Reference King and TurnerKing and Turner, 1997; Reference PhillpotPhillpot, 1997) (Fig. 4a). This air is cold, dry and contains low levels of salts as seen in the average concentration of PP and in the winter surface snow layer at VLG (Fig. 2). During summer, however, incoming radiation warms the dark, rocky surface of the MDV more intensively than the high albedo surfaces of the surrounding glaciers (Fig. 4b). Average radiation measured during December 2000 showed albedo values for MDV rock and glacier surfaces of 27% and 96%, respectively (Reference HendrikxHendrikx, 2001). Surface temperatures on the rocky slopes of Victoria Valley are measured as high as +17˚C, with ambient air temperatures well below freezing (–8˚C). As a consequence, the air above the rocky surface warms significantly more than the air above glacier ice.
Schematic model of air mass input to Victoria Valley during (a) winter and (b) summer months. Arrows indicate air-mass transport paths. Approximate location of the schematic transect is indicated in Figure 1 (A–A').

Marine species (Na, Mg, MS, SO4, Sr)
As the air warms over the Victoria Valley, and ascends to an altitude of thermal equilibrium with the surrounding air mass, it creates a surface low-pressure cell that forces air masses from the Ross Sea above and across VLG (Fig. 4b). The overall dominance of easterly winds explains the concurrent high aerosol input during summer. The air mass flowing over VLG during these times originates from the Ross Sea and is relatively warm, humid and salt-rich. It stands in strong contrast to air masses that originate from the EAIS, which are responsible for aerosol concentrations that are 3–5 orders of magnitude lower than summer deposition (Fig. 4a).
Terrestrial species (Al, Fe)
As shown in the chemistry gradients (Table 1), terrestrial species are derived predominantly from MDV dust, and especially the sand dunes located west of VLG are a rich source for Al and Fe. For most of the year, the sand dunes are frozen solid. In early November 1999, only the top ~0.005m layer was found to be loose material. However, during summer (e.g. late December 1999) the active permafrost layer melts and the upper ~0.1–0.2m of the sand dunes thaw out. The fine sand material (Reference AylingAyling, 2001) is then mobile and may be moved by even moderate winds to the study sites. However, katabatic storms will episodically move large quantities of dust regardless of the season, which might be responsible for secondary maxima of terrestrial species observed in the EOF analysis.
Dating the VLG Snow Profile
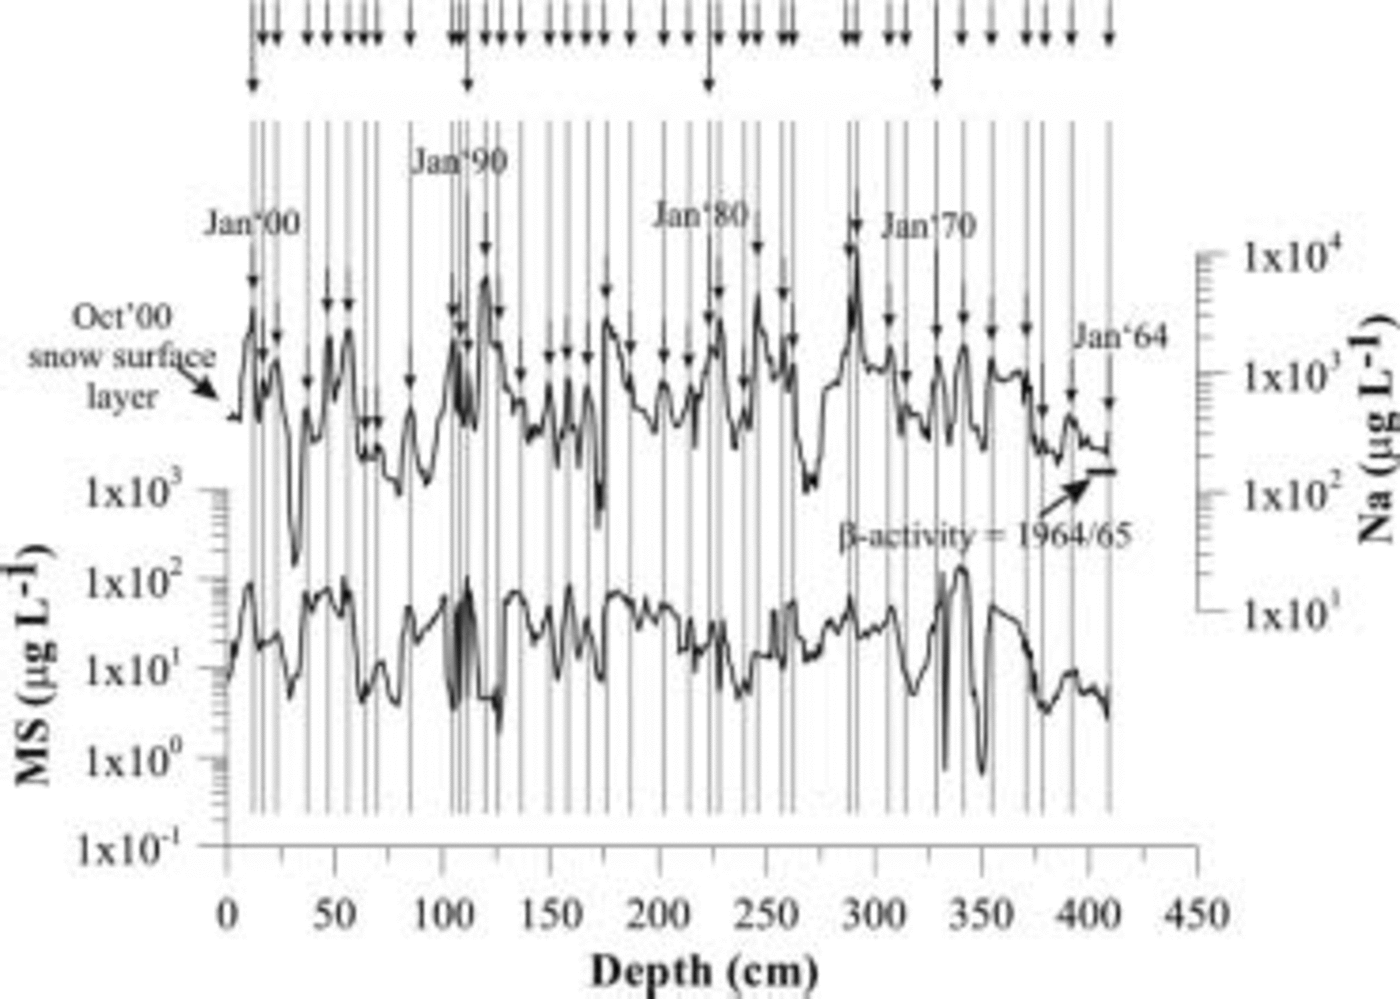
The seasonality of the chemistry signal can be used to identify seasonal layers in the snow profiles. Peaks in Na and MS were used to identify summer precipitation. Both species displayed a summer maximum. The annual-layer count is shown for the VLG snow profile. The bottom of the pit (4.10 m) is summer 1963/64 (Fig. 5). Due to overall low accumulation in the MDV region (e.g. at Newall Glacier ~0.035 m a–1 w.e. (Reference Mayewski, Elliot and BlaisdellMayewski and others, 1995), winter accumulation might not always be sufficient to separate two summer peaks in the record. Thus, the count of summer peaks only provides a minimum age. However, gross beta radioactivity profiling detected the 1964/65 nuclear-testing fallout peak (Reference Pourchet and PinglotPourchet and Pinglot, 1979) at 4.0 ± 0.1m depth, confirming the annual-layer count in the snow profile. Due to the good agreement between the two ages for the bottom snow layer, the error associated with the annual-layer count is assumed to be ±1 year.
Annual-layer count at VLG site using Na and MS. The 4.10 m deep profile was sampled in 1 cm increments. Arrows represent austral-summer peaks.
Conclusion
The spatial and temporal variability of aerosol deposition in the MDV suggests that most of the species input is deposited concurrently regardless of their sources. The most important source areas are the Ross Sea for marine species (Cl, Na, Mg, SO4, Sr, MS), and MDV dust for terrestrial input (Al, Fe). High aerosol concentrations are associated with summer precipitation and are largely independent of snow accumulation. Low aerosol concentrations represent winter precipitation. The seasonality of the marine aerosol input is explained by a polar version of the monsoonal flow, which is driven by the radiative forcing of the MDV. Ion concentrations are 3–5 orders of magnitude higher during summer when the precipitating air mass originates predominantly from the Ross Sea, while in winter the MDV are influenced by air masses draining off the EAIS, resulting in low aerosol concentrations. Terrestrial species are derived from local MDV dust and exhibit a summer maximum concurrently with marine aerosol input. During the warm, humid summer, permafrost-cemented sand dunes located west of VLG thaw, providing a rich source for Al and Fe. Occasional katabatic storms transport dust to the study sites regardless of the season, which is thought to be responsible for the secondary maxima of terrestrial species in the EOF analysis.
Acknowledgements
We thank A. Pyne for logistical and technical support, and E. Meyerson for advice on EOF analysis. Special thanks to C. Introne for isotope measurements and to G. Hamilton for beta activity analysis. We thank B. Ayling and J. Hendrikx for assistance in the field. We are grateful for the support of Antarctica New Zealand, the US National Science Foundation Office of Polar Programs, Scott Base and McMurdo Station. We thank B. Smith and an anonymous reviewer for constructive and helpful comments on the manuscript. This project is funded by Victoria University of Wellington, the Royal Society of New Zealand (grant No. 00-CSP-21-BERT), the Public Good Science Fund (grant No. VUW808) and the Trans-Antarctic Association Fund.



