1. INTRODUCTION
Maritime safety and security are achieved via Maritime Situational Awareness (MSA), which is supported by surveillance and tracking systems such as the Automatic Identification System (AIS) (Sidibé and Shu, Reference Sidibé and Shu2017). Surveillance operators are required to search for and predict conflict situations such as risks of collision, abnormal vessels and suspicious activities emerging from a large number of vessels within vast sea areas. Early detection of such situations allows time in which to take appropriate action, possibly before potential problems can occur (Wiersma, Reference Wiersma2010; Riveiro, Reference Riveiro2011). To offer support for operators of maritime surveillance systems in detecting these situations and choosing timely responses, many studies have been made on the topic of maritime anomaly detection.
As summarised in Riveiro et al. (Reference Riveiro, Pallotta and Vespe2018) based on the data processing strategy used, maritime anomaly detection methods can be divided into three main categories: data-driven approaches, signature-based approaches and hybrid approaches. Data-driven approaches appear easier to apply on a larger scale to gain efficient classification performance and detect different types of anomalies. Better AIS terminal networks and greater data storage and collection capacity have made it possible to access notably large volumes of data related to sea traffic, including ship location information. The majority of studies in this area fall under the data-driven category.
In studies of maritime anomaly detection, data-driven approaches usually consist of two steps, that is, normalcy extraction and detection. In the first step, a model representing normal vessel movement behaviour is taught from massive vessel historical movement data. In the second step, new vessel position data are assessed by the learned model, which considers any mismatch as anomalous behaviour.
As reviewed by Riveiro et al. (Reference Riveiro, Pallotta and Vespe2018), three main methods are used to extract the normalcy condition for maritime anomaly detection: parametric methods, nonparametric methods and clustering methods. Gaussian Mixture Models (GMMs) are one of the most popular parametric methods. In work by Laxhammar (Reference Laxhammar2008), the Gaussian mixture model and a greedy version of the expectation-maximisation algorithm were used to extract normalcy. For the nonparametric model, Kernel Density Estimation (KDE) is the most commonly used method. Ristic et al. (Reference Ristic, La Scala, Morelande and Gordon2008) used an adaptive KDE to derive a normal traffic model and used particle filters to predict the positions of vessels based on the derived density. However, clustering has recently become an increasingly popular method due to its favourable performance and the fact that it is easy to implement. K-medoids is a version of the k-means algorithm, which is based on classification. Zhen et al. (Reference Zhen, Jin, Hu, Shao and Nikitas2017a) used the k-medoids algorithm to cluster ship trajectories and a Bayesian network to detect abnormal vessels. Li et al. (Reference Li, Liu, Liu, Xiong, Wu and Kim2017) proposed a multi-step trajectory clustering method for robust AIS trajectory clustering based on Dynamic Time Warping (DTW) distance, Principal Component Analysis (PCA) and the k-medoids algorithm. The main drawback of the k-medoids algorithm is that the number of clusters is difficult to determine. Moreover, not all of the ship trajectories might be components of the traffic pattern on water because a ship has freedom of movement in most water areas, and classification-based clustering cannot recognise those trajectories that do not present the characteristics of the traffic pattern. Consequently, density-based clustering methods that can recognise noise data appear to be the most appropriate approach to pattern recognition due to their convenient properties compared with classification-based clustering. Density-based methods do not require specification of the number of clusters; they have the ability to derive arbitrarily shaped clusters and incorporate by-products of classification of the noise points (Riveiro et al., Reference Riveiro, Pallotta and Vespe2018). Zhen et al. (Reference Zhen, Riveiro and Jin2017b) utilised AIS data and the DBSCAN algorithm to obtain clusters of encountered vessels. Pallotta et al. (Reference Pallotta, Vespe and Bryan2013) proposed an approach based on an incremental variant of the Density-Based Spatial Clustering of Applications with Noise (DBSCAN) algorithm (Ester et al., Reference Ester, Kriegel, Sander and Xu1996) and the turning points to learn maritime traffic routes from vessel AIS data. These approaches selected the trajectories that deviated significantly from the patterns of the abnormal trajectories. Yan et al. (Reference Yan, Wen, Zhang and Yang2016) proposed an unsupervised method that applied density-based clustering for the identification of stops and moves in tracking points via the extraction of stationary areas of interest from the stops and detection of the main traffic routes from the moves. Liu et al. (Reference Liu, de Souza, Matwin and Sydow2014) improved the DBSCAN algorithm for extraction of normal ship trajectory patterns by considering the non-spatial attributes of the tracking point (speed and direction).
However, the DBSCAN clustering algorithm is sensitive to the input parameter values, the determination of which requires complex and time-consuming computation or expert domain knowledge, and studies are seldom aware of this problem. Yan et al. (Reference Yan, Wen, Zhang and Yang2016) adopted a heuristic approach based on k-nearest neighbour distances to determine the parameters of the DBSCAN algorithm. However, this approach requires many human interventions. Pan et al. (Reference Pan, Jiang and Shao2014) used entropy theory to determine the parameters of the DBSCAN algorithm, but the calculation in this approach is highly complex. Moreover, most of the methods available in the literature are designed for offline anomaly detection in trajectories where detection is performed after the entire vessel trajectory has been observed, and this is a serious limitation in surveillance applications. Therefore, additional effort should be devoted to real-time maritime anomaly detection.
Neural networks are powerful learning models that can achieve state-of-the-art results in a wide range of supervised and unsupervised machine learning tasks. Rhodes et al. (Reference Rhodes, Bomberger and Zandipour2007; Reference Rhodes, Bomberger, Seibert and Waxman2005) presented a neural network classifier known as fuzzy Adaptive Resonance Theory Map (ARTMAP) (Carpenter et al., Reference Carpenter, Grossberg, Markuzon, Reynolds and Rosen1992) to evaluate the behaviours of vessels. Bomberger et al. (Reference Bomberger, Rhodes, Seibert and Waxman2006) developed a method based on associative learning and a neural network to predict future vessel behaviours and detect abnormal vessels. In their work, vessel locations in the region are discretised with grids, but the prediction accuracy in the application is not very high. Xu et al. (Reference Xu, Liu and Yang2011) used a Back Propagation (BP) neural network to predict vessel trajectories. Daranda (Reference Daranda2016) built a three-layer BP neural network model to learn the clustered turning points and used it to predict marine traffic. Recurrent Neural Networks (RNNs) are connectionist models with the ability to selectively pass information across sequence steps while processing sequential data one element at a time. Thus, these methods can model inputs and outputs consisting of sequences of elements that are not independent. Further, recurrent neural networks can simultaneously model the sequential and time dependencies at multiple scales (Lipton et al., Reference Lipton, Berkowitz and Elkan2015). Compared with traditional neural networks, RNNs are more capable of processing time series data. Vessel trajectory data consists of tracking points with time stamps, a type of typical time series data. Consequently, RNNs are well suited to the tasks of maritime anomaly detection.
The main contribution of this paper is to improve the clustering performance for extracting the normalcy condition of vessel trajectories, and a method for the problem of input parameter selection in the DBSCAN algorithm is proposed. In the process of applying the DBSCAN algorithm, inverse Gaussian fitting is used to statistically determine the appropriate parameters. In addition, to improve the performance in availability and timeliness for detecting the anomalous behaviour of vessels, an RNN is applied in the field of maritime anomaly detection, which treats the vessel trajectory data from the result of clustering as the training data. Based on large amounts of real vessel data from AIS, we conducted an experiment for verification.
The remainder of the paper is structured as follows. Section 2 proposes the method for determining the parameters of the DBSCAN algorithm. Section 3 introduces the recurrent neural network for maritime anomaly detection. Section 4 shows the results of the verification experiment and Section 5 presents the conclusions.
2. DETERMINATION OF DBSCAN PARAMETERS
The DBSCAN algorithm is a classic density-based clustering algorithm that has two input parameters minPts and ε. Consider a set of points in a space to be clustered. For the purpose of DBSCAN clustering, the points are classified as core points, density-connected points and outliers. A point p is a core point if at least minPts points are located within distance ε. A point q is directly density-reachable from point p if q is within distance ε of p and p is a core point. Density reachability is the transitive closure of direct density reachability, and this relationship is asymmetric. This asymmetric density reachability is density connectivity. Based on the parameters, the points that are density-connected with each other are grouped into a cluster. All points that are not density-connected with any other point are outliers. In the DBSCAN algorithm, the combination of parameters plays a highly important role in the process. However, determination of the appropriate parameters is difficult because their practical meanings are abstract, and many possible combinations of parameters exist. In the first step of our proposed method, we use the statistical relationship to calculate the parameter of ε given a fixed minPts, which could sharply reduce the number of possible combinations and transform the problem of two parameter determinations into the problem of parameter combination selection. The second step consists of the selection of a parameter combination based on the clustering results.
2.1. Statistical relationship between parameters
The core-distance of an object p in the method presented here is the distance to the minPts closest point, which is a concept in the OPTICS (Ordering points to identify the clustering structure) algorithm (Ankerst et al., Reference Ankerst, Breunig, Kriegel and Sander1999), written as Dist(minPts). In the ideal result of density-based clustering, all data in the high-density area should be grouped such that the density of the cluster can reach its maximum. From a local perspective, for an individual data point p, in the case of clustering with the centre data by itself given the fixed minPts, the core distance of p Dist(minPts) can exactly meet the conditions of a core point and cluster formation. Therefore, we believe that for a fixed minPts, the value of the core distance in this dataset that can enable the most point data to become core points is the appropriate parameter ε. Therefore, we use the inverse Gaussian distribution to find the mode value of the core distances and treat it as the appropriate parameter ε in this dataset when minPts is given. The formulae for the probability density function of the inverse Gaussian distribution and its mode value are given as follows:
 $$\hbox{P}\lpar x\rpar = \left[\displaystyle{{\lambda}\over{2\pi x^3}}\right]^{\displaystyle{{1}\over{2}}}e^{-\displaystyle{{\lambda \lpar x-\mu \rpar ^2}\over{2\mu^2x}}} $$
 $$Mode =\mu \left[\left(1+\displaystyle{{9\mu^2}\over{4\lambda^2}}\right)^{\displaystyle{{1}\over{2}}}-\displaystyle{{3\mu}\over{2\lambda}}\right]$$
where λ and μ can be obtained by Maximum Likelihood Estimate (MLE).
Because the parameter minPts ranges from one to the size of the dataset, based on the statistical relationship above, we can obtain all of the parameter combinations.
2.2. Selection of parameter combination
The clustering process is conducted with all of the parameter combinations and the number of outliers is taken as the clustering performance to select the optimum parameter combination.
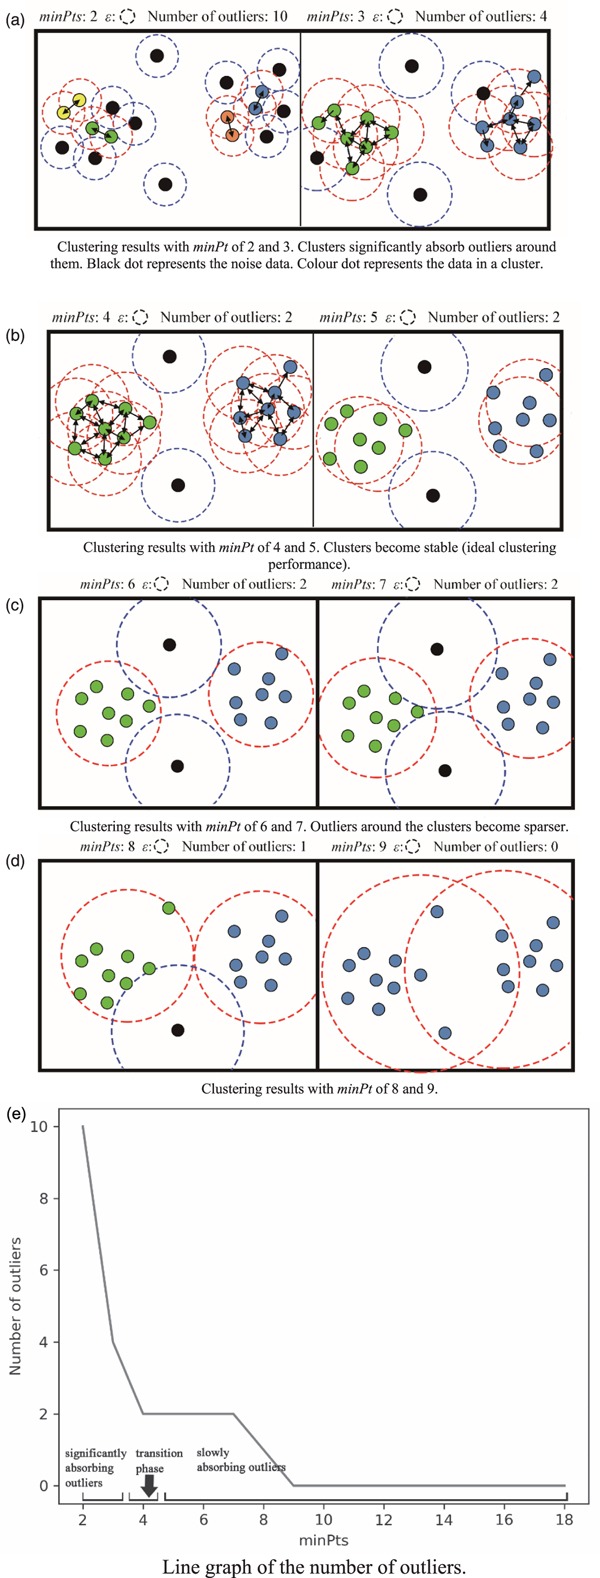
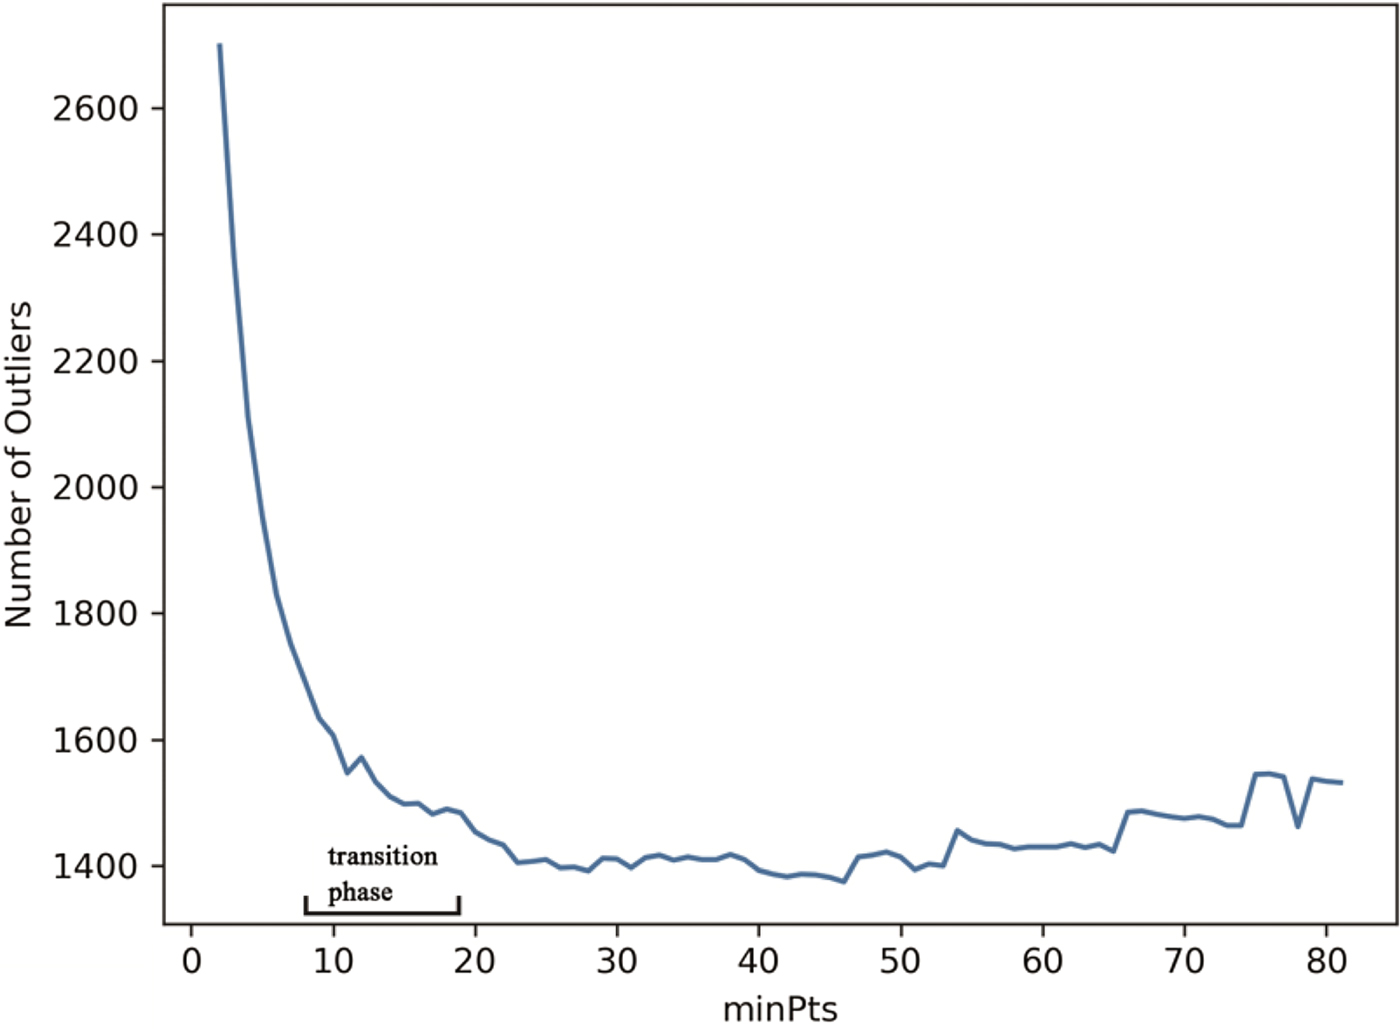
A parameter combination (minPts and its ε) corresponds to a certain degree of strength that can aggregate the elements into the clusters. A higher value of minPts indicates a greater strength. In multiple experiments, the change in the clustering result during the process of increases in the value of minPts can be viewed as a process in which each cluster absorbs the data around it. When minPts is equal to one, all data are classified as a cluster, and no outliers remain, which is apparently not appropriate. Thus, the process of increasing minPts is started at two, and at the beginning, many outliers occur around the clusters. With the increasing value of minPts, before the ideal clustering results are found, outliers are significantly absorbed into the clusters, which contributes to the sharp drop in the number of outliers. However, the outliers around the clusters subsequently become sparser. Hence, the reduction rate of the number of outliers decreases, which means that the number of outliers becomes stable.
Thus, we believe that the optimal parameter of minPts occurs at the transition phase from the stage of significant absorption of outliers to the stage of slowly absorbing outliers. In our method, we use a line graph of the number of outliers (in ascending order of minPts) to find the transition phase, as illustrated in Figure 1. Figures 1(a)–(d) show the clustering results with different parameter combinations (ascending order). The dotted-line circle represents the area of the corresponding ε of minPts. The number of outliers is plotted on the line graph, as illustrated in Figure 1(e). From Figure 1(e), minPts = 4 is identified in the transition phase. As shown in Figure 1(b), the clustering result with the corresponding parameter combination (minPts = 4) has exactly the ideal clustering performance.
The process of determining the parameter combination of DBSCAN algorithm. (a)–(d) Show the clustering results with different parameter combinations (ascending order). (e) Is the line graph for identifying the transition phase and optimal parameters.

3. ANOMALOUS VESSEL BEHAVIOUR DETECTION USING RECURRENT NEURAL NETWORK
3.1. Method of maritime anomaly detection based on RNN
The artificial neural network is one of the most effective data-driven approaches for the supervised learning task. It infers a function that maps an input to an output based on example input-output pairs derived from existing data. The characteristics can be used for anomaly detection, not only because it can predict the trajectories that conform to historical patterns, but also for the trajectories that did not conform to historical patterns it may sensitively become inefficient in prediction. While the latter is the property that other trajectory prediction methods that do not rely on historical data, such as the Kalman filter (Perera and Soares, Reference Perera and Soares2010; Stateczny and Kazimierski, Reference Stateczny and Kazimierski2011), do not have. Compared to those methods, a neural network can store the trajectory information in the customary route, which is extracted from historical data; only the regular ship movement can be predicted accurately. In the prediction that does not rely on historical data, the goal is to predict the vessel trajectory as accurately as possible no matter whether the movement is abnormal or not. This is the reason the neural network is applied as the predictor in this research, which has different predictive effects for different degrees of abnormality.
An RNN is a class of artificial neural network in which connections between nodes form a directed graph along a sequence. RNNs can use their internal state (memory) to process sequences of inputs. This process allows the model to learn temporal behaviours in a time sequence. The basic principle of the method presented here is that an RNN trained by trajectory data from the results of the DBSCAN algorithm is used as a vessel trajectory predictor. According to the previous tracking points and the traffic pattern, the network can predict the normal position of the next tracking point. It is hypothesised that anomalous vessel behaviours regarding vessel speed, course and route can cause abnormal performance in vessel position. Here, anomalous vessel behaviours are identified through the detection of abnormal position, and the deviation value between the predictive position and actual position is the indicator that shows the normality degree of the tracking point, defined by:
 $$deviation\_value=GeoDistance\lpar Lat_{pre}\comma \; Long_{pre}\comma \; Lat_{act}\comma \; Long_{act}\rpar $$
where GeoDistance is the function for calculating the geographical distance between two geographical coordinates. Lat pre and Long pre are the geographical coordinates of the predictive position. Lat act and Long act are the geographical coordinates of the actual position.
To supply a warning, the thresholds of the deviation value can be determined based on the user's practical requirements and the performance of training. The method here sets high and low levels of thresholds. New vessel position data generates a warning to attract additional attention from supervisors when the deviation value exceeds the high level or when the deviation value has exceeded the low level for several consecutive tracking points as these situations might be the anomalous vessel behaviours. In contrast, new vessel position data are treated as normal vessel behaviour when the prediction of the network is accurate.
The trajectories can be described by a set T = {t i|t i, i = 1,…2,n}, where t is the trajectory in the experiment and n is the number of trajectories. Trajectory data t consists of AIS tracking points, defined by:
 $$t=\lcub p_j \vert p_j=\lpar x_j\comma \; y_j\comma \; v_j\comma \; c_j\rpar \comma \; \ j=1\comma \; 2\comma \; \ldots\comma \; m\rcub $$
where j is the time instance index, m is the total number of tracking points in the trajectory and p j is the state vector of the ship at time index j. For the state vector, x j and y j are the coordinates of the tracking point and v j and c j are the speed and course of the ship at time index j. In addition, the values were normalised before training of the RNN. Feature scaling is used to bring all values into the range [0, 1].
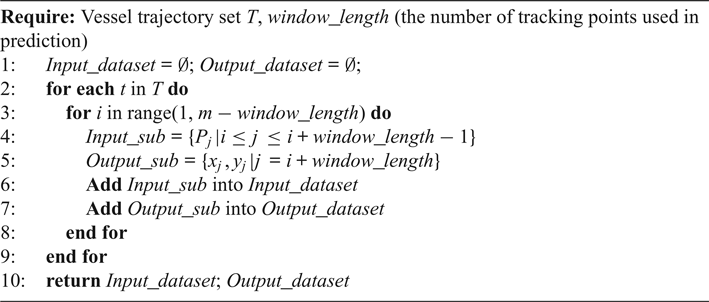
Trajectory data were processed into input and output datasets by a sliding window for the neural network. The processing method is shown in Algorithm 1.
Creation of a dataset for the neural network

3.2. RNN and long short-term memory
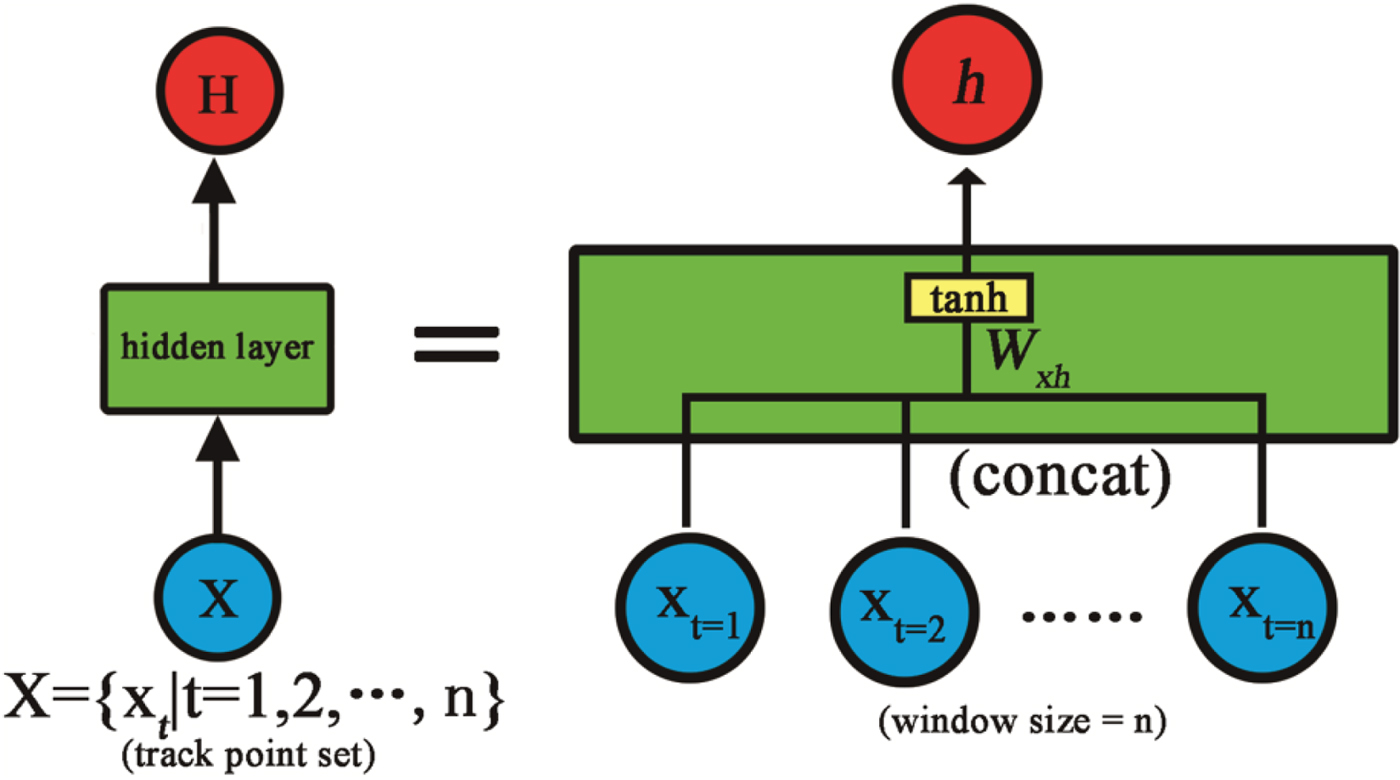
Compared to the traditional structure of a neural network, namely feed-forward neural network, the training efficiency of an RNN is higher in processing time series data. When applying a feed-forward neural network in the prediction of time series data, a fixed time step of information vectors of track points is concatenated into a larger vector by windowing. The information flow from the input layer to the hidden layer is shown in Figure 2. The hidden node value h is calculated as Equation (5).
Information flow in a feed-forward neural network.
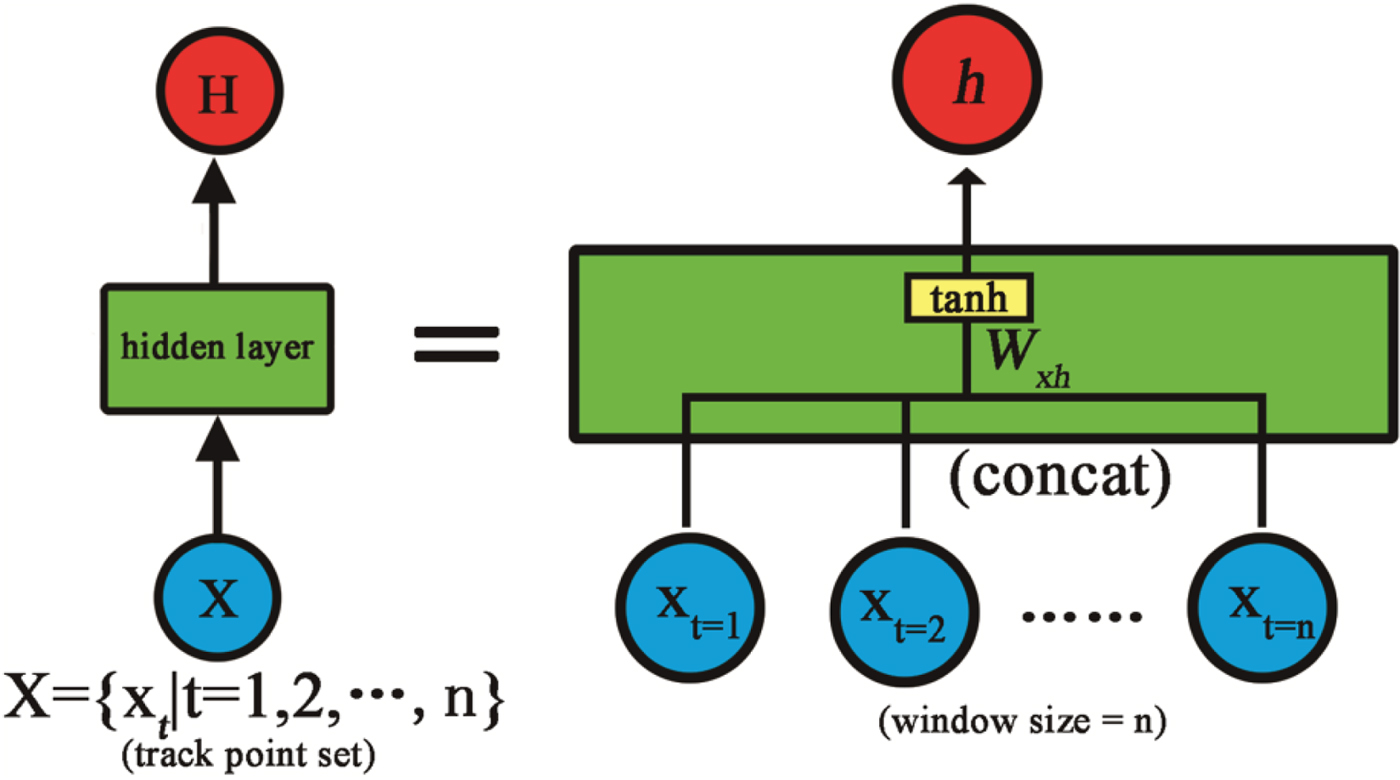
 $$h=tanh\ \lpar W_{xh} \cdot\, concat\, \lpar x_1\comma \; x_2\comma \; \ldots\comma \; x_n \rpar +b\rpar $$
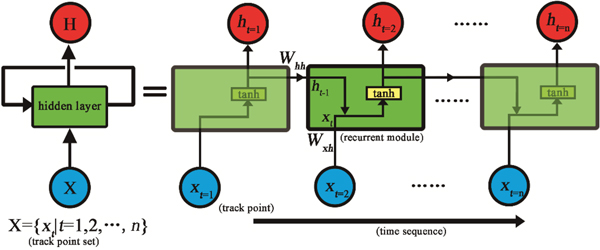
With a single training example, the weight of feed-forward neural network W xh can be trained by information at all the time steps only once. While in the RNN, the parameters are shared by all time steps, which may increase the training efficiency sharply. The basic structure of our RNN is shown in Figure 3.
Information flow in a recurrent neural network.
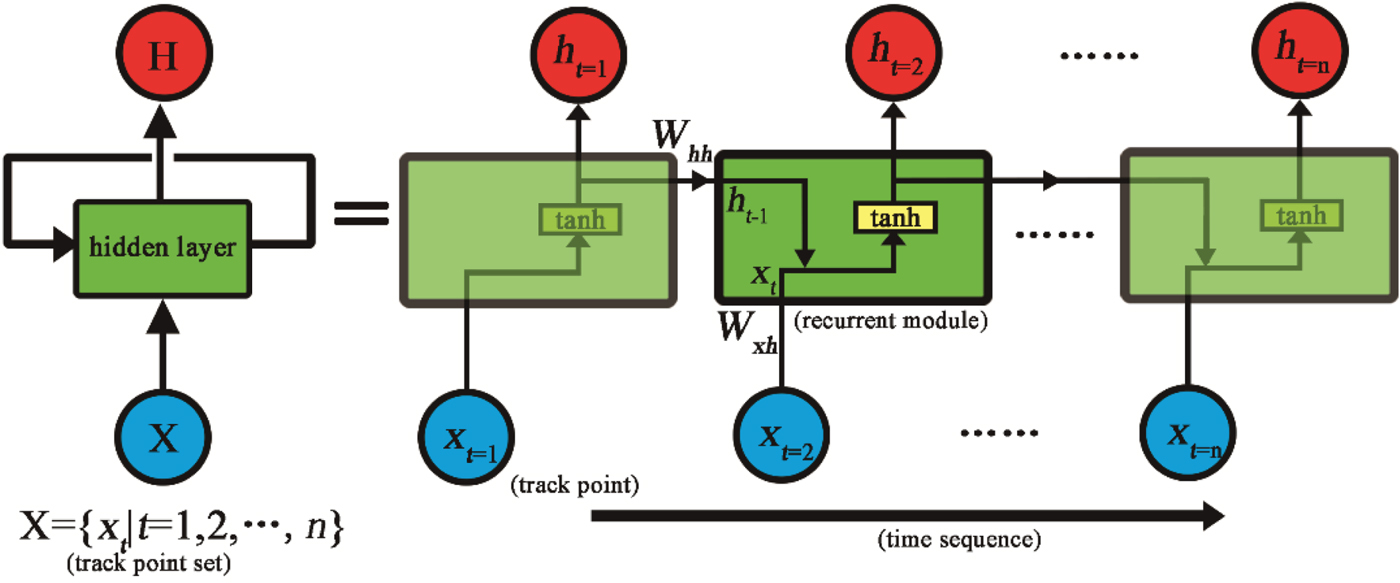
As shown in Figure 3, the training of each moment is independent. At time t nodes with recurrent modules receive input from the current data point x t and from the hidden node value h t−1 in the previous state. At time t, nodes with recurrent modules receive input from the current data point x t and from the hidden node value h t−1 in the previous state. The hidden node value h t at time t is calculated as Equation (6). That is to say, RNNs share weights across different time steps of the sequence. Consequently, if there are n time steps in the input data, with a single training example, the weights of RNN W xh, W hh can be trained n times.
 $$h_t =tanh \lpar W_{xh} \cdot x_t +W_{hh} \cdot h_{t-1} +b\rpar $$
In this paper, prediction of the vessel trajectory is performed by a fully connected RNN. A single hidden layer is used, and the number of hidden dynamic features of the hidden layer is determined based on the input data. In updating the weights, the Adam algorithm is applied (Kingma and Ba, Reference Kingma and Ba2014); this is a method for efficient stochastic optimisation that requires only first-order gradients and has low memory requirements. The method computes the individual adaptive learning rates for different parameters from estimates of the first and second moments of the gradients. Additionally, the model uses the Rectified linear unit (Relu) as the activation function (Nair and Hinton, Reference Nair and Hinton2010).
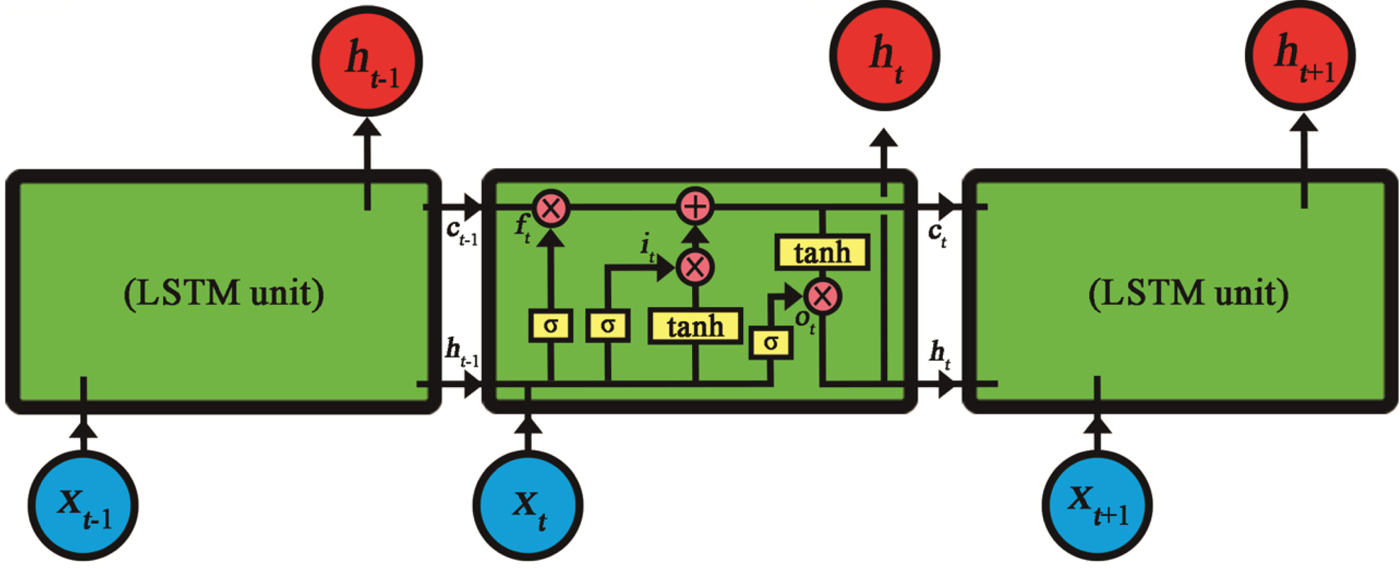
One of the most successful RNN architectures for sequence learning was introduced to solve the problem of vanishing gradients, namely, the Long Short-Term Memory (LSTM) (Hochreiter and Schmidhuber, Reference Hochreiter and Schmidhuber1997). In this method, the traditional nodes in the hidden layer are replaced with the LSTM unit, which is shown in Figure 4.
Information flow in a recurrent neural network with LSTM unit.

The key to the LSTM unit is the cell state. The cell state c t at time t is shown as the horizontal line running through the top of the LSTM unit in Figure 4. The LSTM unit has the ability to remove or add information to the cell state through the gates, which are marked with f t, i t, and o t in Figure 4. Gates are a way to optionally let information through and are composed of a sigmoid neural net layer (marked with σ) and a point-wise multiplication operation (marked with a multiplication symbol). f t indicates the forget gate, which decides what information should be discarded from the cell state. The process looks at h t−1 and x t, and outputs a number between 0 and 1 for each number in the cell state C t−1. The number 1 represents “completely retain this”, whereas the number 0 represents “completely discard this”. Additionally, i t indicates the input gate, which decides what new information from h t−1 and x t can be stored in the cell state, and o t denotes the output gate, which decides how much information in the cell state can be output. The equations of these gates are shown as follows:
 $$f_t = sigmoid\lpar {W_{xf} x_t +W_{hf} h_{t-1} +b_f } \rpar $$
 $$i_t =sigmoid\lpar {W_{xi} x_t +W_{hi} h_{t-1} +b_i } \rpar $$
 $$o_t =sigmoid\lpar {W_{xo} x_t +W_{ho} h_{t-1} +b_o } \rpar $$
Finally, the cell state c t at time t is calculated based on the gates (f t and i t), input x t, previous cell state c t−1 and previous hidden node value h t−1. The hidden node value h t at time t is calculated based on cell state c t and output gate o t. The equations of c t and h t are shown as follows:
 $$c_t =f_t \odot c_{t-1} +i_t \odot tanh\lpar {W_{xc} x_t +W_{hc} h_{t-1} +b_c } \rpar $$
 $$h_t =o_t \odot tanh\lpar {c_t } \rpar $$
4. EXPERIMENTAL CASE STUDIES
4.1. Experimental setup
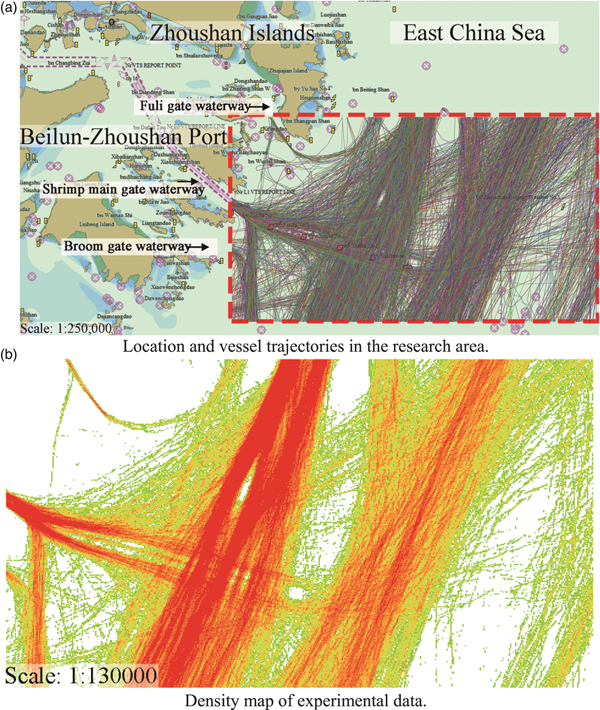
AIS data was collected from the Zhoushan Islands in January 2015. The research area is located outside of Beilun-Zhoushan port, which is one of the most important ports in China. This water area is situated near the middle portion of the China coastline. Many vessels that use the north-south transportation routes sail through this area. In addition, this area is close to the entrance of the Shrimp main gate waterway, which is the main waterway of Beilun-Zhoushan port, and thus, it is the main area where in-and-out of port ship encounters occur, as shown in Figure 5. All of the Class-A AIS messages from tankers and cargo ships were selected as experimental data from a total of 3,228 trajectories of 1,932 vessels. The data were pre-processed with respect to space and time (Zhao et al., Reference Zhao, Shi and Yang2018).
Experimental data source.

4.2. Results of vessel trajectory clustering
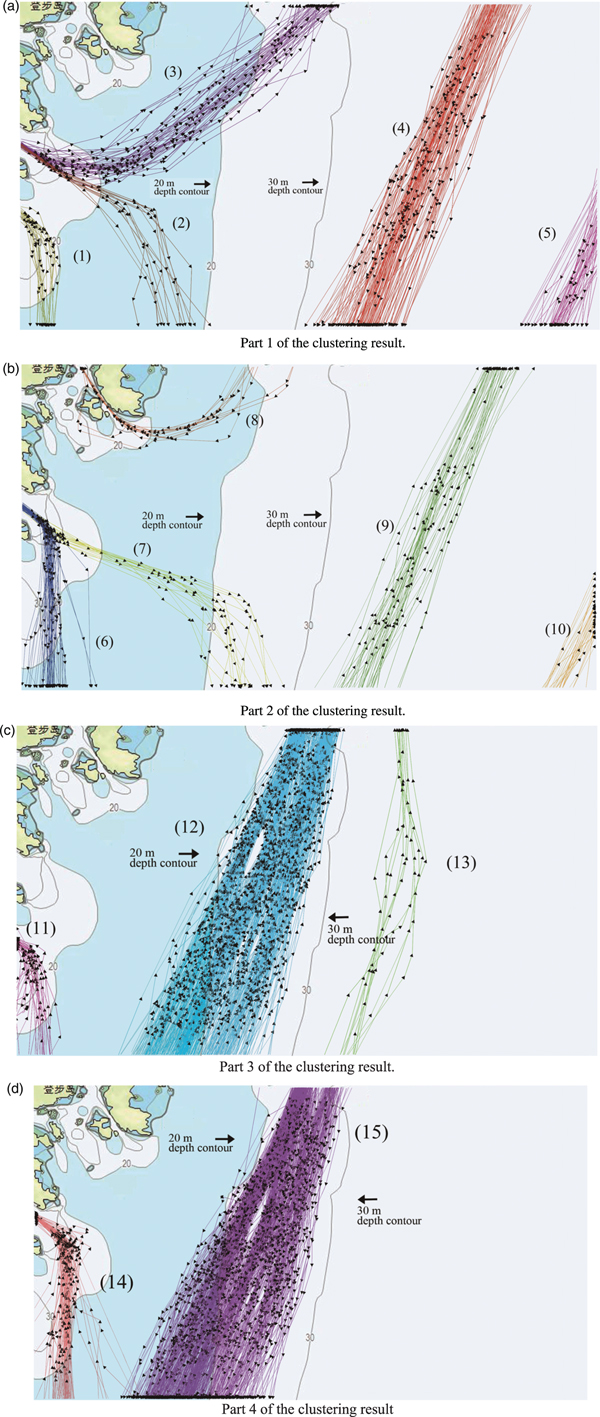
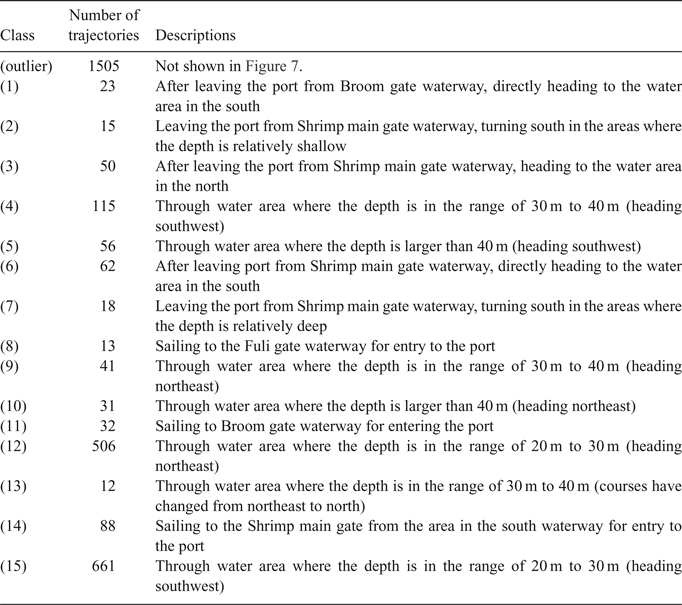
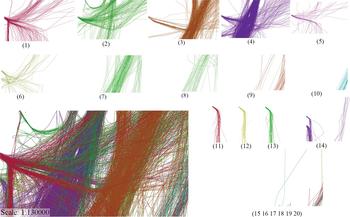
As described in Section 2.2, in the process of determining the parameter combination, the line graph of the number of outliers and the transition phase is shown in Figure 6. It is worth mentioning that there are slight increases in the noise levels in Figure 6. This is because in the process of increasing the value of minPt, when the merger of clusters occurs, the data around the edge of the original cluster might be identified as noise data. However, it does not affect the overall trend. After checking the clustering results with the parameter combinations in the transition phase, the parameter combination (minPt = 10, ε = 0.861) was determined. The results of the clustering for normalcy extraction are shown in Figure 7 and Table 1.
Line graph of the number of outliers in the experiment.

Results of proposed Density-based clustering.

Description of clusters.

From Figure 7 and Table 1, it is shown that the vessel trajectories that belong to the different customary routes are grouped into different clusters. From observation, the vessel trajectories in the same cluster are almost consistent in terms of shape. Compared to the results of classification-based clustering (Figure 8), the noise trajectories are removed, and the meaning of the cluster is clearer. The results show that the DBSCAN algorithm with the proposed method for determining the parameters is able to recognise the traffic patterns on the water. Although not all of the customary routes in this experiment area were detected, the clusters consisting of vessel trajectories in the results can still be used as normalcy data for maritime anomaly detection.
Results of classification-based clustering.

4.3. Experiment on maritime anomaly detection using recurrent neural networks
As described in Section 3, the vessel trajectories in the results of the DBSCAN algorithm were used to train the recurrent neural network with the LSTM unit introduced in Section 3.2. The parameter used in the process of obtaining the training dataset, namely window_length, is determined as five, which means that in our method, the prediction of the tracking point is made based on five previous tracking points. The time interval of the tracking points in the data set was processed into two minutes. In other words, in this experiment, the method assesses whether the behaviour of the vessel is anomalous by comparing the position that was predicted two minutes ago with the actual current position. The deviation value between the predictive position and the actual position is the indicator used to evaluate results from the neural network.
4.3.1. Prediction of vessel position
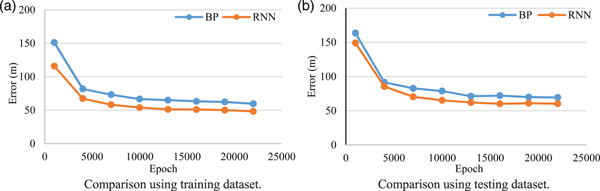
First, a comparison experiment regarding the prediction performances of a feed-forward neural network (three-layer BP neural network) and recurrent neural network was conducted. The deviation values of these two neural networks after different training epochs are shown in Figure 9. Figures 9(a) and 9(b) are the comparison results of prediction error based on the training dataset and testing dataset (data other than the vessel trajectories contained in the training set), respectively. In this experiment, the testing dataset consists of the vessel trajectories that account for 15% in each cluster.
Comparison results of prediction error between BP neural network and recurrent neural network.

From Figure 9, it can be seen that after the same training epoch the average prediction error of the RNN is 12.8% (training dataset: 20%) below the error of the feed-forward neural network. It is shown that the recurrent neural network used here has a better performance regarding training efficiency and prediction accuracy compared to the feed-forward neural network.
In the verification experiment, the testing dataset was used to validate the ability to predict the normal vessel position and the ability to detect anomalous behaviours of the vessel.
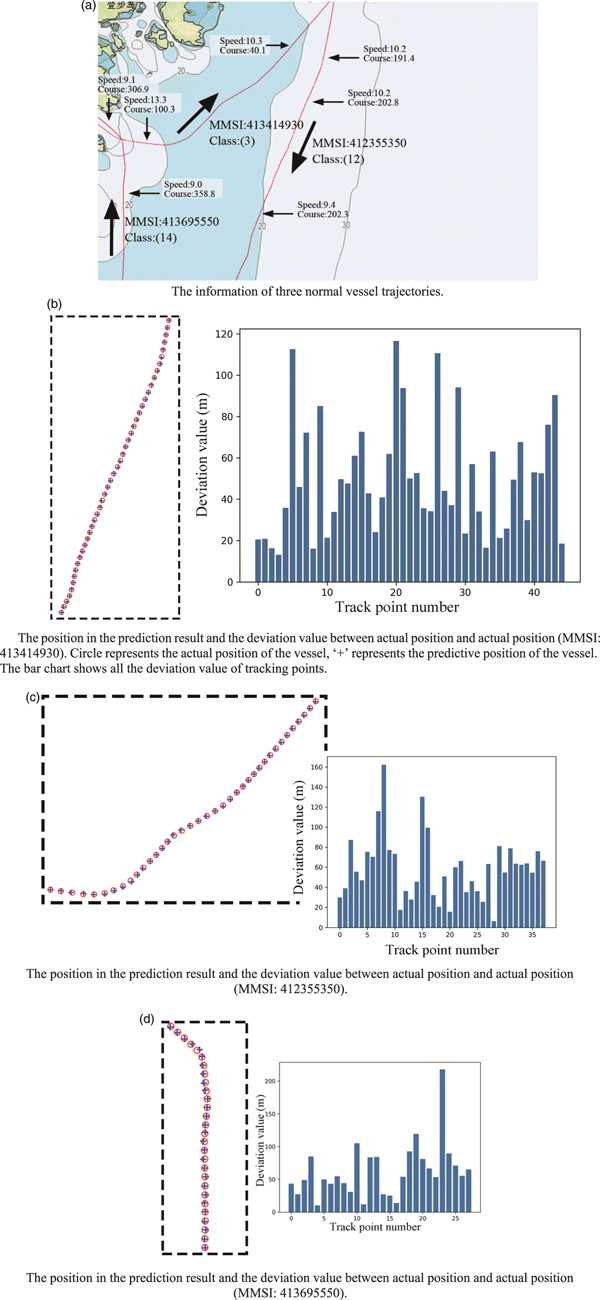
As shown in Figure 9(b), after the prediction, the prediction error (the mean of all of the deviation values using the testing dataset) is 60 m, which can satisfy the accuracy needs of traffic surveillance. Three detailed results of prediction are shown in Figure 10. As shown in Figure 10(a), these three vessel trajectories are the normal trajectories that follow the traffic pattern in this water area, which are selected from the results of clustering. These vessel trajectories are all located in the customary route, and the movement of the ship is steady (no sudden change in course and speed). Figures 10(b)–(d) show that the position can be predicted with acceptable precision by the neural network that has learned normalcy. Consequently, the method has been proven to have the ability to predict the position where the vessel is expected to be according to the traffic pattern on the water.
Three detailed results of prediction and deviation value between actual position and actual position.

4.3.2. Detection of anomalous vessel behaviours
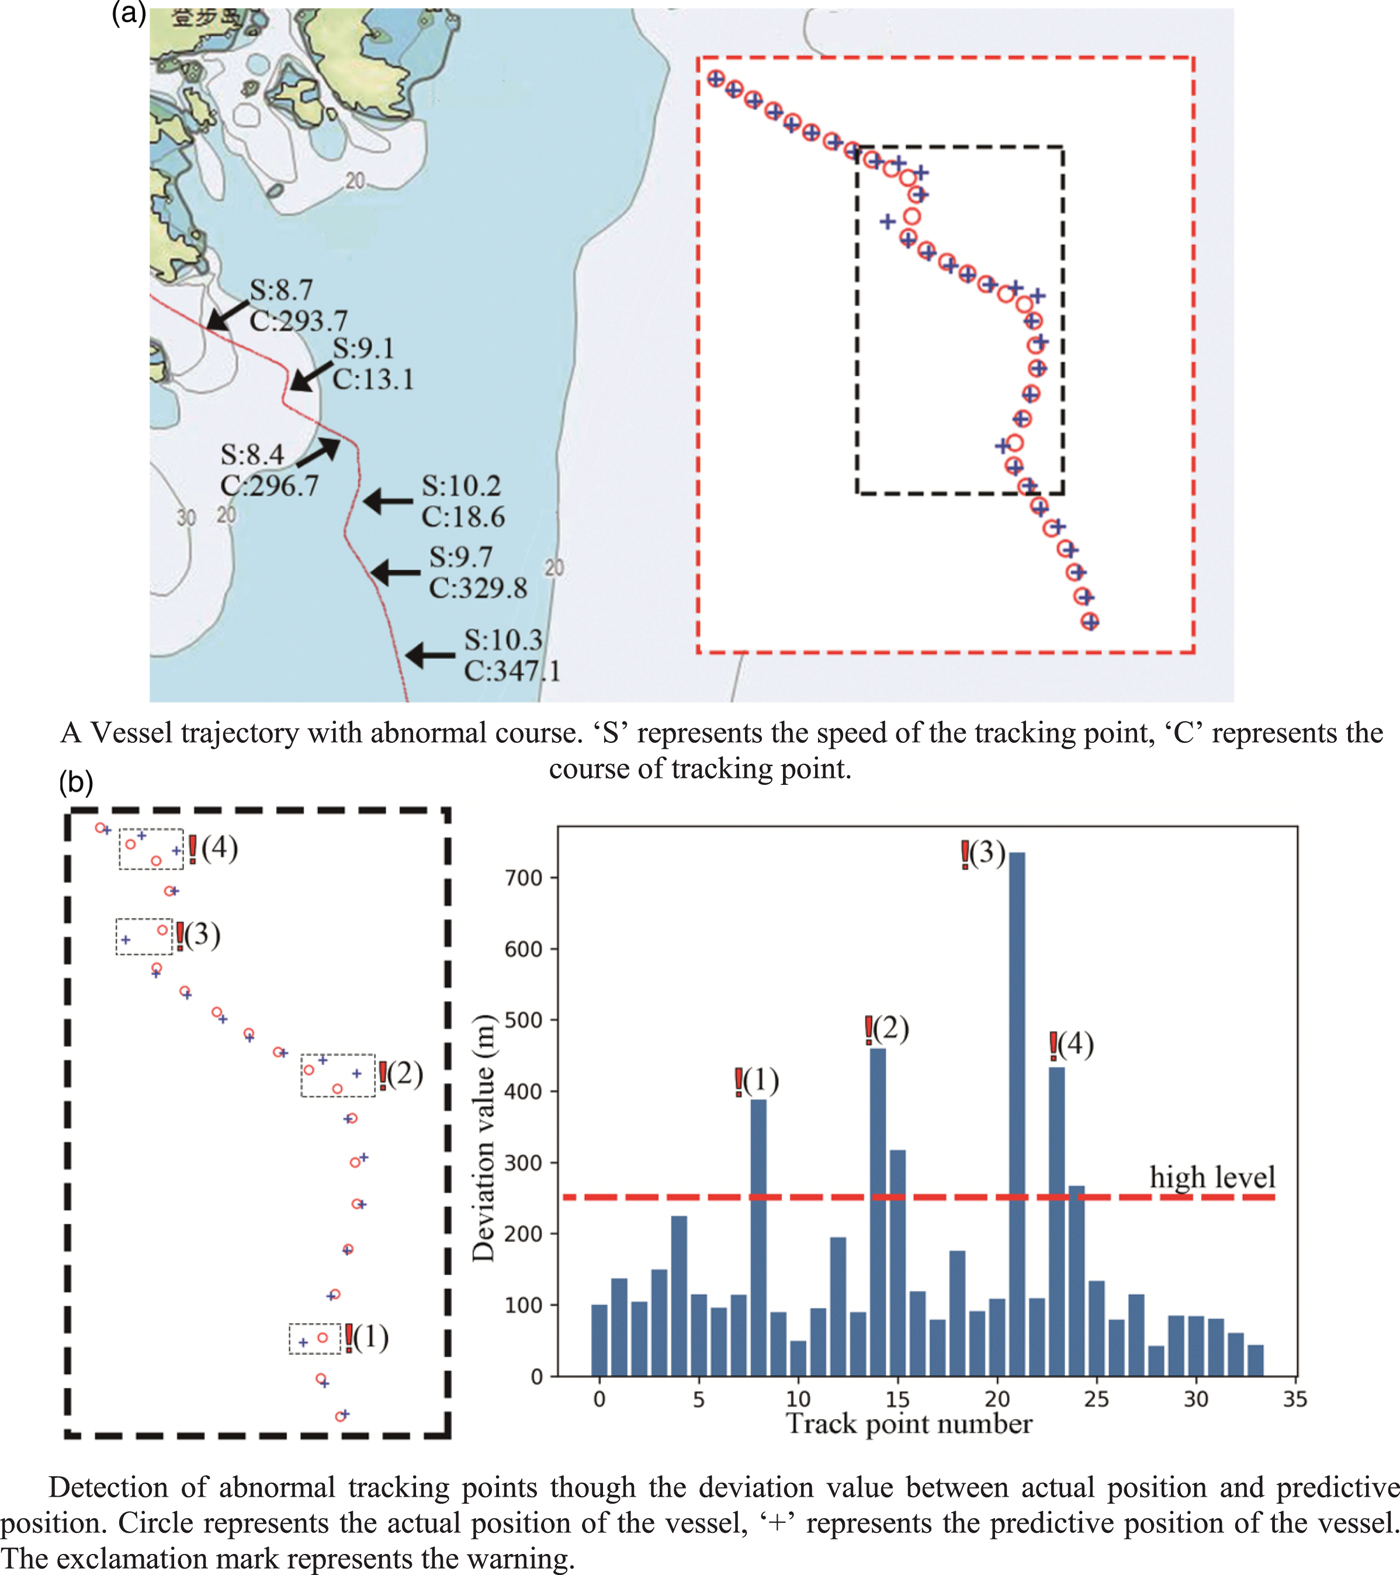
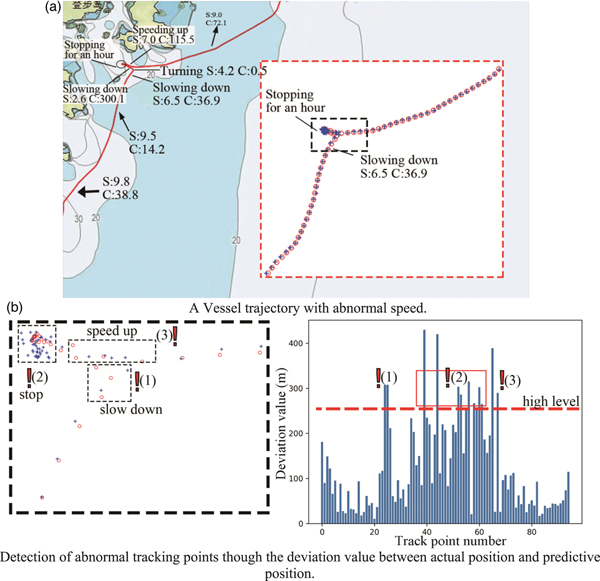
The vessel tracking points that do not follow the traffic pattern are treated as anomalous vessel behaviours. In marine traffic, the situations that might cause such mismatches include abnormal changes in course, abnormal changes in speed and sailing on an abnormal route. In this experiment, three types of abnormal vessel trajectories were selected to verify the detection capability. In the process of detection, two thresholds of deviation value of position were set to supply the forewarning signal, namely, 75 m (low level) and 250 m (high level). The detailed results are shown in
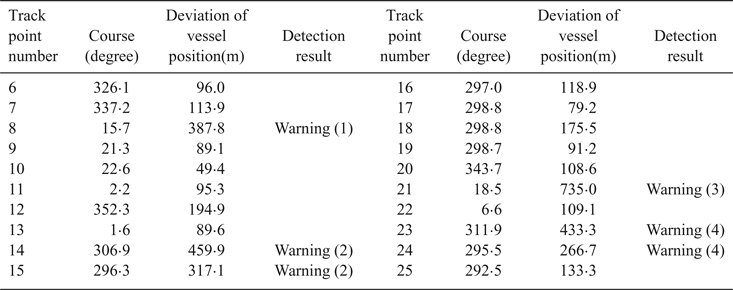
As observed from Figure 11(a), the trajectory is generated for a vessel that sails from the area in the south to the Shrimp main gate waterway for entry to the port. However, unlike most other vessels, which take a steady course, the course that is shown in this trajectory has changed several times within a short period (marked with a black block). The detailed predictive results in this period are shown in Figure 11(b). In Figure 11(b), the deviation value of the tracking point that has a sharp change in course is significantly larger than that of the others. Based on the thresholds of deviation, those tracking points (anomalous vessel behaviours) have been detected and are marked with a symbol. The detailed detection results in this period are shown in Table 2. The deviation between the actual position and predictive position that is caused by the sharp change in course exceeds the threshold value, which is identified as anomalous vessel behaviour.
Detailed prediction result of vessel trajectory (abnormal course).
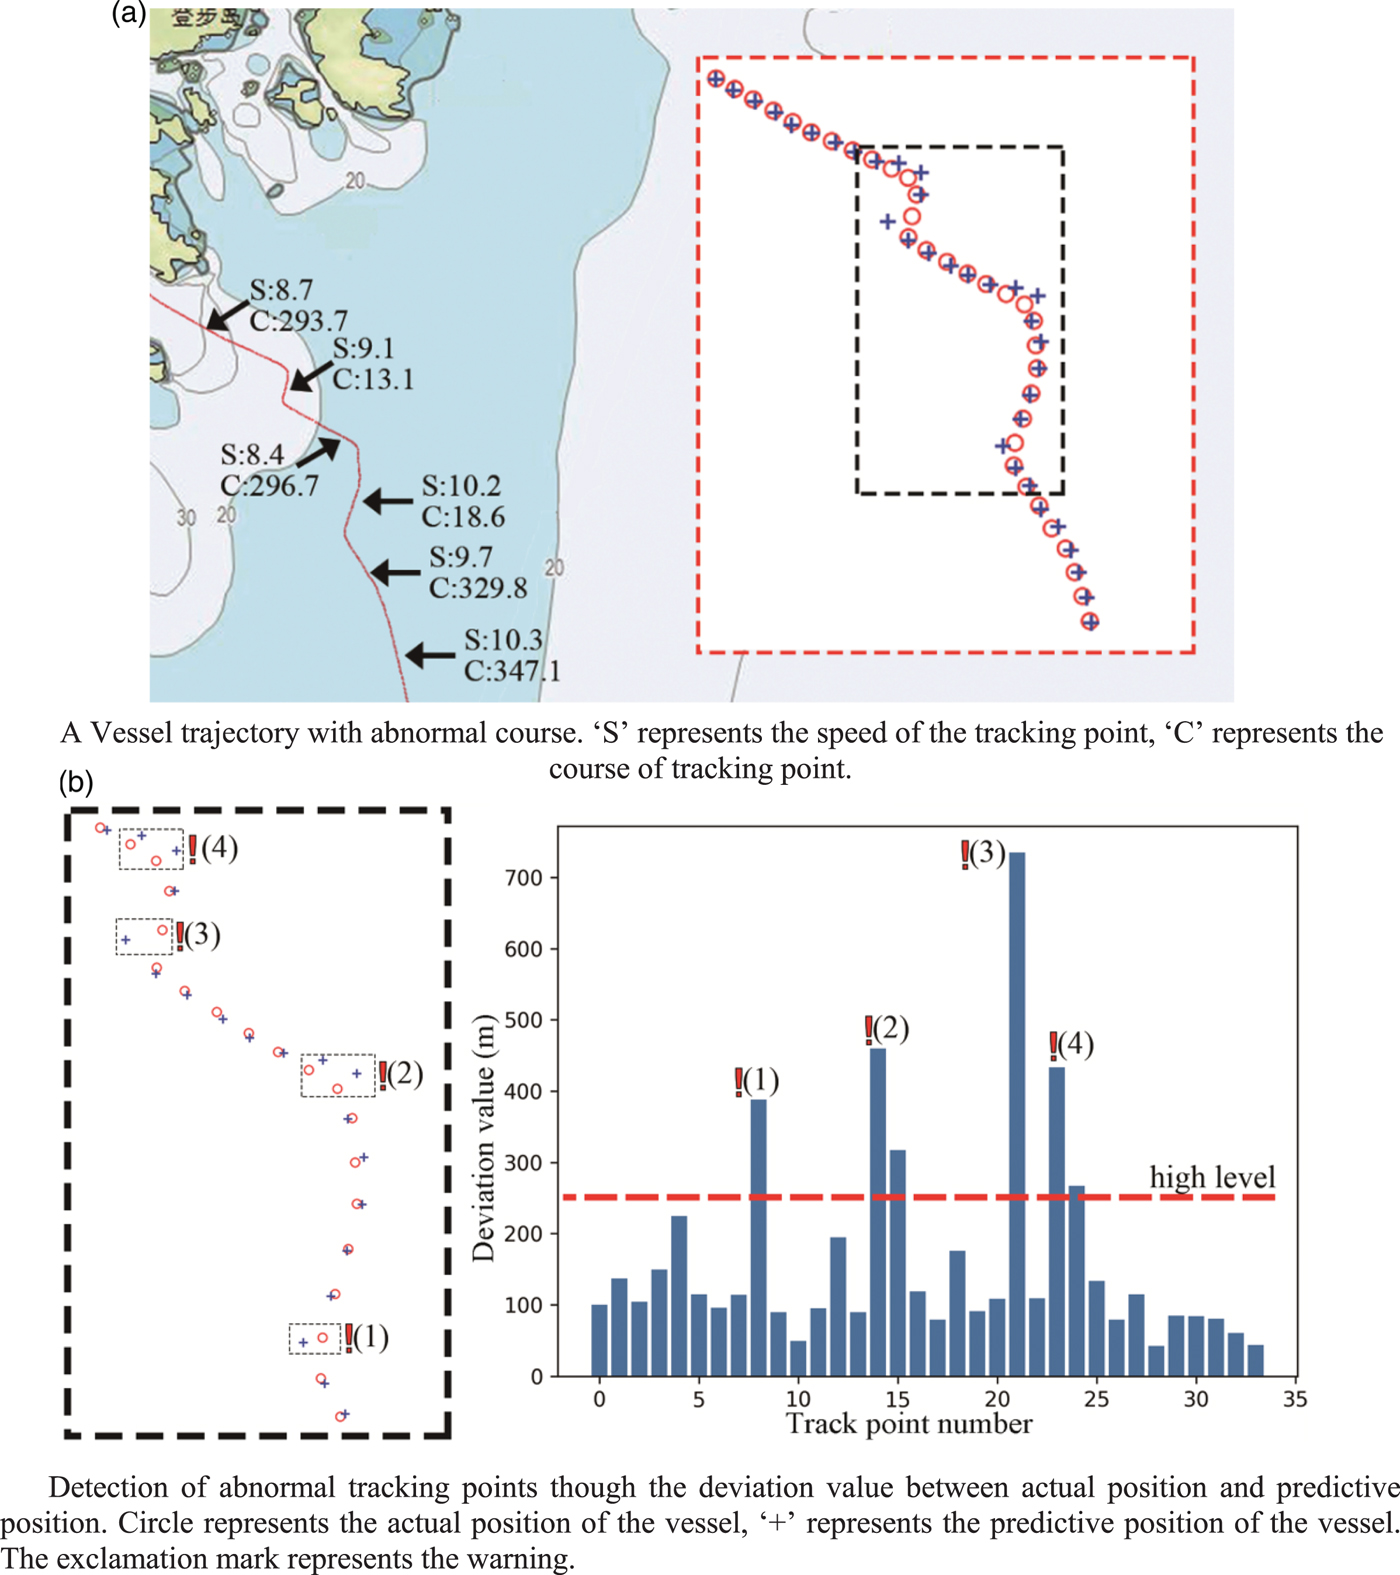
Detailed detection result of vessel trajectory (abnormal course)

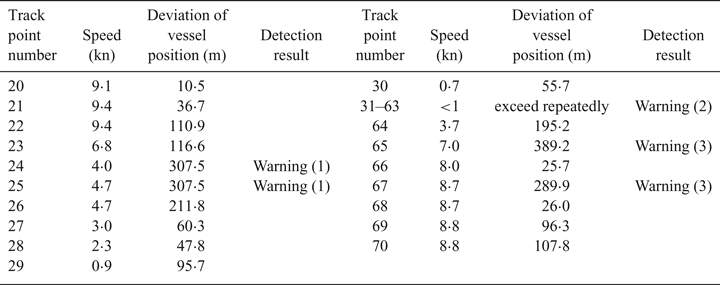
From Figure 12(a), it can be seen that the trajectory is generated for a vessel that sails from the port area to the water area in the north. However, in its movement process, the vessel slowed down and stopped for an hour (marked with a black block) near the entrance to the waterway. This anomalous vessel behaviour seldom occurs in this water area and might influence the traffic flow through the waterway. The detailed predictive results are shown in Figure 12(b). From Figure 12(b), in the area marked with ‘(1)’ and ‘(3)’, the sudden increase in deviation value was caused by the abnormal change in speed and course. Moreover, in the area where the vessel abnormally stopped (marked with ‘(2)’), the tracking points that have larger deviation values were detected for the warning state. The detailed detection results are shown in Table 3. The deviation between the actual and predictive positions that is caused by the abnormal change in speed exceeds the threshold value, which is identified as anomalous vessel behaviour.
Detailed prediction and detection result of vessel trajectory (abnormal speed).
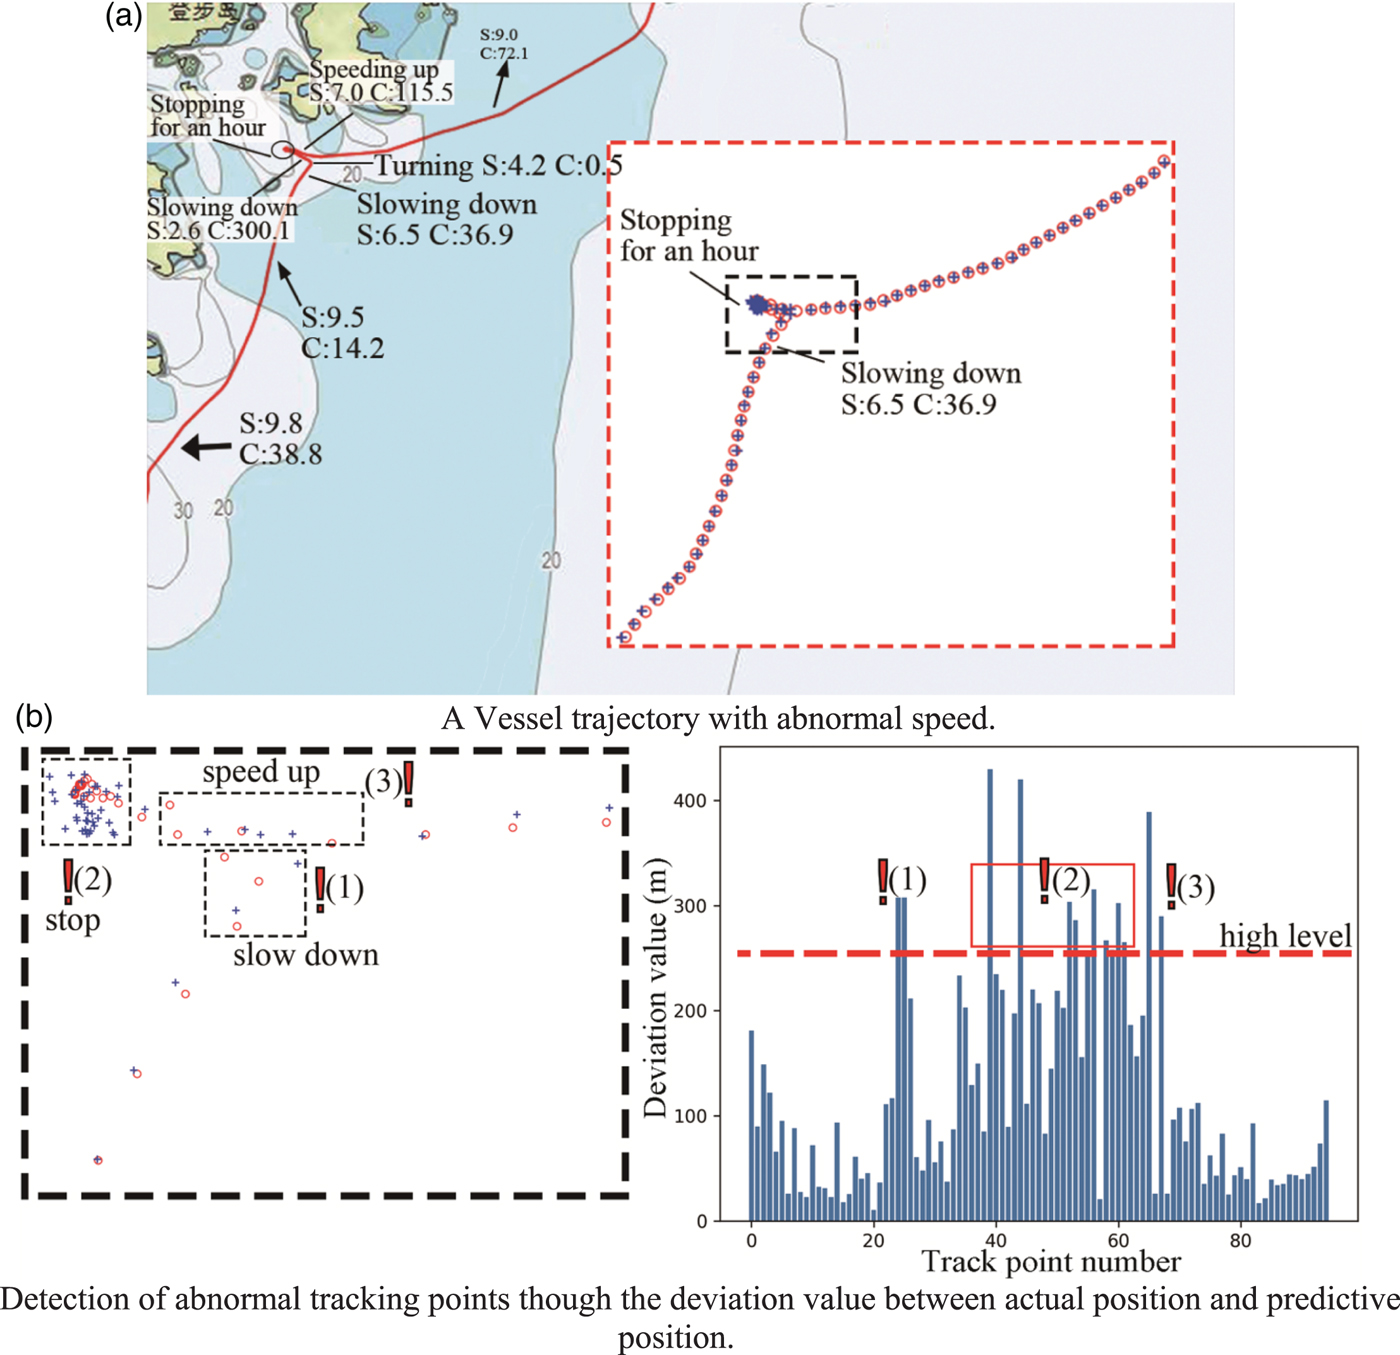
Detailed detection result of vessel trajectory (abnormal course)

In Figure 13(a), the trajectory is generated for a vessel that sails from the Fuli gate waterway to the water area in the south. The first half of the vessel trajectory is a route that is not popular in this water area. The second half of the vessel trajectory follows the existing traffic pattern shown by the cluster (class 6) in the DBSCAN results. The detailed predictive results of the first half (marked with a black block) are shown in Figure 13(b). Due to the abnormal route, the deviation values of the tracking point in this region are all relatively large. Those tracking points that exceed the low level consecutively have been detected by our method (marked with a block in Figure 13(b)).
Detailed prediction and detection result of vessel trajectory (abnormal route).

This experiment shows that our method has the ability to detect the anomalous behaviours of a vessel in terms of speed, course and route within a short time.
5. CONCLUSION
As discussed in this paper, maritime anomaly detection in maritime surveillance can improve the situational awareness of vessel traffic supervisors and reduce casualties and losses of goods caused by maritime accidents. To detect anomalous vessel behaviours, a method consisting of pattern recognition by the DBSCAN algorithm and anomaly detection using a recurrent neural network is proposed.
In this method, the parameters of the DBSCAN algorithm are determined based on statistical analysis and subsequently use the vessel trajectories from the results of DBSCAN clustering as the training data to train the recurrent neural network built in the LSTM unit. Moreover, the network that has learned the normalcy of water traffic in this area is applied as the vessel trajectory predictor to detect anomalous vessel behaviours in real time.
Based on a month of AIS trajectory data collected from the area of the Zhoushan Islands, a verification experiment was conducted. The experimental result shows that the method has the ability to detect anomalous behaviours of a vessel in terms of speed, course and route and can supply forewarning within a short time, which might aid the supervisor in decision-making.
However, the method has a high requirement on the quality of sample vessel trajectory data, which makes practical application more complicated. The tasks such as data collection, pre-processing extensive data and similarity measurement may directly affect the efficiency and effect of this method. For the traffic patterns of different vessel types or period, the particular normal model should be built based on a particular AIS track dataset. In this paper, the normal model has only used the AIS messages from tankers and cargo ships; for shorter vessels such as fishing vessels, the RNN used here may not have effective results. Future research will focus on improving the performance of the DBSCAN algorithm and long-term prediction.
FINANCIAL SUPPORT
This work was partly supported by “National Natural Science Foundation of China” (grant number: 51579025).