Research on was/were variation in British communities and a number of relatively isolated coastal communities in the United States has identified two principal patterns: (i) a variable pattern of leveling to was across person, number, and polarity; and (ii) leveling to weren't in negative clauses plus a usually less advanced leveling to was in positive clauses (Anderwald, Reference Anderwald2001; Britain, Reference Britain2002; Cheshire, Reference Cheshire1982; Cheshire & Fox, Reference Cheshire and Fox2009; Schilling-Estes & Wolfram, Reference Schilling-Estes and Wolfram1994; Tagliamonte, Reference Tagliamonte1998; Wolfram & Schilling-Estes, Reference Wolfram, Schilling-Estes, Britain and Cheshire2003; Wolfram & Sellers, Reference Wolfram and Sellers1999). The other potential pattern, (iii) variable patterns of leveling to were across person, number, and polarity, is reported to be infrequent (Chambers, Reference Chambers1995:242; Edwards & Weltens, Reference Edwards, Weltens and Viereck1985:110), leading Wolfram and Sellers (Reference Wolfram and Sellers1999:94) to refer to it as “a minority levelling option.”
Historically, pattern (iii) was more widely distributed across England than it is today. Ellis's (Reference Ellis1869–1889) data suggested that leveling to were was more frequent in the North, but it was also found in several counties in the South, including Norfolk and Suffolk. Corroborating this, Britain (Reference Britain2002:34) found evidence of this pattern in the speech of the oldest informants in his study of Fenland English, but his apparent time data suggested that this system is gradually being replaced by pattern (ii). Tagliamonte (Reference Tagliamonte1998) showed a similar pattern arising in York in the northeast of England, suggesting that the potential for leveling to the was/weren't system is not restricted to Southern varieties of English.
Despite the encroachment of pattern (ii) elsewhere in the country, resistance in Lancashire and other Northern varieties persists, as Anderwald (Reference Anderwald2002:184) has observed. Pattern (iii) is maintained in the dialect spoken in Bolton, a town in the northwest of England. Accounts of Lancashire dialects confirm that were across all persons is traditional to this area (Ellis, Reference Ellis1869–1889; Wright, Reference Wright1892; see also Beal, Reference Beal and Kortmann2004:121 for an overview). This is corroborated by the 1950–1961 Survey of English Dialects materials, which included a Bolton district, Harwood (Orton, Halliday, & Barry, Reference Orton, Halliday and Barry1962–1971).Footnote 1 More recently, Cheshire, Edwards, and Whittle's (Reference Cheshire, Edwards, Whittle, Milroy and Milroy1993:71–72) survey of school children recorded the reporting of nonstandard were in northwest England and Shorrocks (Reference Shorrocks1999:168–169) reported were for all persons across his 1970s conversational corpus of Bolton.
My 2003 study found nonstandard were in positive contexts to be robust in Bolton speech, occurring 17% of the time (Moore, Reference Moore2003:73; compare this to 3% of the time in Tagliamonte's [1998] study of another Northern variety, York English). Perhaps more significantly, there is no real evidence for leveled was in the dialect. Nonstandard was does occur, but its use is highly circumscribed. Moore (Reference Moore2003:72–73) noted that 38 of the 58 instances of nonstandard was are existentials—a context in which variation exists even in standardized varieties of English (Cheshire, Reference Cheshire, Bex and Watts1999; Hay & Schreier, Reference Hay and Schreier2004). Indeed, literature on existential be (for instance, Britain & Sudbury, Reference Britain, Sudbury, Jones and Esch2002; Eisikovits, Reference Eisikovits and Cheshire1991; Meecham & Foley, Reference Meecham and Foley1994) has suggested that the uncertainty of case assignment in this context may be leading to lexicalization of the there + 's/is/was collocations (Cheshire & Fox, Reference Cheshire and Fox2009:8).
This paper considers why Bolton speakers (who are by no measure sociogeographically isolated) are resisting the processes of dialect leveling identified elsewhere in the country. The answer may be found in an analysis of contributory social factors. Previous studies have found there to be strong external factors implicated in was/were variability. These studies have shown expected social patterns, such as female lead in change from below (Labov, Reference Labov1990). Both Tagliamonte (Reference Tagliamonte1998) and Cheshire and Fox (Reference Cheshire and Fox2009:23) found that females are leading the spread of the was/weren't system in York and outer London, respectively. However, some of the social effects identified in other studies reflect idiosyncratic sociocultural contexts. For instance, in an example of a less typical male lead in a change from below, Schilling-Estes and Wolfram (Reference Schilling-Estes and Wolfram1994:287–288) explained the male preference for weren't in their Ocracoke data as a consequence of its symbolic significance to islander identity (an identity with which males more typically align). Further, Schilling-Estes and Wolfram (Reference Schilling-Estes and Wolfram1994:298) observed that nonstandard was/were variability maintains its “sociolinguistic vitality” against pressures of standardization by virtue of its ability to distinguish islanders from outsiders.
This paper argues that there are similar identity processes at work in Bolton. In particular, it will be demonstrated that the stability of leveled were in Bolton may be attributable to its utility as a symbol of localness. To consider the social status of this pattern, practice-based aggregates and their interaction with traditional structural classifications (those linked to social class and familial background) are considered.
STRUCTURAL VS. PRACTICE-BASED SOCIAL CONSTRAINTS
The interaction between different social factors has long been acknowledged in variationist work, often in discussions of variable rule analysis (Bayley, Reference Bayley, Chambers, Trudgill and Schilling-Estes2002:131; Guy, Reference Guy, Ferrara, Brown, Walters and Baugh1988:126; Tagliamonte, Reference Tagliamonte2006:181–185). Labov (Reference Labov2001:97) noted that it is possible to resolve the problems created by the nonorthogonal nature of social factors by creating interactive independent variables, giving the example of “lower middle class women.” Further, Labov's (Reference Labov2001) analysis of (dh), (neg), and (ing) in Philadelphia demonstrated how multiple regression analysis can be used to compare different social factors and their effects on stable sociolinguistic variables. Labov's account demonstrated that a social class calculation that combines occupation, education, and house value is the most reliable indicator of sociolinguistic patterning, given that combined calculations “correct and compensate for idiosyncratic effects and uncertainties” arising from any one social factor alone (Labov, Reference Labov2001:118).
Another way to view the reliability of combined calculations would be to see them as better representing the precise contexts in which linguistic variables accrue social significance. The salience of a combined calculation may reflect a feature's occurrence in sociolinguistic practice which is not necessarily restricted to one categorical domain. For instance, someone who works on an assembly line might also play in the factory's brass band with people who are simultaneously colleagues, ex-school friends, and neighbors (simultaneously embedding occupational, educational, and housing statuses in concrete social engagement). In this way, we might assume that a social aggregation that more directly reflects the indexical links (Silverstein, Reference Silverstein, Basso and Selby1976, Reference Silverstein, Mertz and Palmentiers1985, Reference Silverstein, Schieffelin, Woolard and Kroskrity1998, Reference Silverstein2003; Ochs, Reference Ochs, Duranti and Goodwin1992) between a variant and the social practice in which it occurs will capture more instances of that variant's application and, consequently, show up as more significant in a statistical correlation. In this sense, the more effectively the social aggregates used in statistical analysis serve as “stand-ins for social practice” (Eckert, Reference Eckert2000:24), the more reliable our analyses of social and linguistic covariation.
This paper argues that the best account of social and linguistic covariation is provided by an account that favors neither structural nor practice-based aggregations, but combines their effects upon the data. Previous studies have hinted at the relationship between structural and practice-based factors, but discussions often stop short of explicitly evaluating what each contributes to the analysis. For instance, Labov (Reference Labov2001) explored how the structural groupings of ‘occupation’, ‘education’, and ‘house value’ interact and alluded to “idiosyncratic effects” that may well be the result of differentially skewed forms of practice. Likewise, Eckert's (Reference Eckert2000) jocks and burnouts study observed links between social class and forms of social practice (such as cruising, dirt biking, cheerleading, or hanging out in the local area) but, as Eckert and Wenger (Reference Eckert and Wenger2005) implied, it is not necessarily the case that the practices of both communities of practice (CofPs) are equally constrained by their class associations.
In undertaking an account that explores some of the structural and practice-based forms of social organization used most frequently in variationist analysis, this paper explicitly addresses how these social factors interact and directly evaluates how each constrains the use of were in first- and third-person singular contexts. This will inevitably address questions about speaker agency—a key issue in debates about structural versus practice-based models of language variation (Coulmas, Reference Coulmas2005; Milroy, Reference Milroy, Cain and Russom2007). Distinguishing between the consequences of structural constraints and practice-based affiliations may help to distinguish between what speakers are able to do by virtue of their social placement and what they do by virtue of desire and motivation. By conducting this social analysis alongside a consideration of the internal constraints on nonstandard were, this account will provide further insight into a heretofore understudied aspect of was/were variability.
DATA AND METHODOLOGY
The data used in this paper is drawn from a two-year ethnography of adolescents at Midlan High SchoolFootnote 2 in Bolton, England, conducted between June 2000 and February 2002. Bolton is situated in the county of Greater Manchester, but was part of Lancashire until a boundary reorganization in 1974. The town was not only one of the chief centers of the U.K. textiles industry (with over 300 mills operating in 1922), but also a major producer of the coal that supported this activity (Shorrocks, Reference Shorrocks1998:15). Bolton's history as a Lancashire town and its socioeconomic independence has resulted in the area maintaining independence from the city of Manchester, despite less than 20 miles separating the two. Although Bolton's textiles industry declined in the 1960s (relatively late, considering that the national decline of this industry began in the 1920s),Footnote 3 the landscape around Midlan High (which is in the north of the town, close to the new border with Lancashire) retains some of the now sought-after stone-clad cottages and terraces that housed weavers and, later, mill workers. Many of the old mill buildings have also been converted into prestigious apartments.
If we compare statistics from the district in which Midlan High is situated, Green Vale, with those for Bolton as a whole, its relative economic prosperity is apparent. The census reveals that the unemployment rate was only 2.1% in 2001 (the second lowest rate in the borough) compared with 3.5% for the town as a whole, and 82.6% of houses were owner-occupied (the average for the town as a whole was 69.5%).Footnote 4 However, 12.2% of those in Green Vale still needed local authority or housing association assistance to obtain property. Although this figure is lower than the town average (21.9%), it illustrates that there is some socioeconomic diversity in the district. Furthermore, the school draws pupils from areas beyond Green Vale, many of which are much less prosperous. Thus, although the school does have a relatively high proportion of middle class students, it is not exclusively middle class.
The speech of 39 girls is analyzed here. Most of these girls were members of two different tutor groups from a single year group, who were aged 12–13 years when the study began and 14–15 years at its completion. As tutor groups were not streamed for ability, the girls used in the study represent a characteristic sample of the school's female intake. Boys were not studied as a consequence of the ethnographic methodology. Perhaps unsurprisingly, given my own gender, girls were more comfortable with me and more willing to offer me their time. Although it would have been interesting to explore gender in the analysis offered here, the interaction between gender and other social factors is frequently addressed in variationist research (see, in particular, Eckert, Reference Eckert1990; Eckert & McConnell-Ginet, Reference Eckert and McConnell-Ginet1992; Labov, Reference Labov1990), and the absence of boys from this dataset does not hinder the comparison of structural and practice-based aggregations.
Throughout the study, I went into the school at lunchtime and engaged in whatever activity was occurring (this could range from simply eating lunch in the snack bar, to attending a drama rehearsal, to hanging out with the smokers on the outskirts of the playground). The fieldwork was documented in notes amounting to 196,400 words. Interactions between the girls were first recorded six months after the study began. Recordings never took place as a formal interview and served as an extension of my regular interaction with the girls. Typically, between two and four girls would discuss recent events and used the sessions as a way to record their activities. In addition to these recordings, questionnaires were also circulated to the study's participants. These questionnaires provided an informant view on social practices (which were used to corroborate ethnographic observations) and background information to enable social class, self-identification, and parental place of birth classification. The recordings from this study comprise approximately 50 hours of data and a 262,000-word corpus.
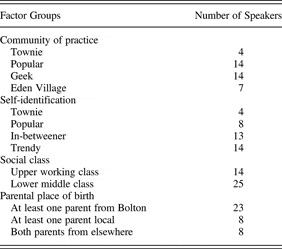
The social factors analyzed are shown in Table 1.Footnote 5 Four CofPs were identified, and each girl's membership was evaluated on the basis of who she spent time with, what activities she engaged in, her orientation to peers and her surroundings, personal style and appearance, and her own and others' assessments of her group memberships. The Populars exhibited an antischool attitude, displayed a sporty and feminine style of dress, and engaged in moderately rebellious activities such as drinking and smoking. Midway through the fieldwork, the Townies emerged and broke off from the group of Populars, when the former started to engage in risky behavior such as drug-taking and sexual activity. Their friendship network included older boys, with whom they spent time in the local area. The Geeks, by contrast, maintained most of their relationships through the school in activities such as orchestra and sport, and were institutionally orientated and conformist. Finally, the Eden Village girls, named after their desirable home area, also oriented toward the institutional values of the school and adopted a trendy teen style, preferring to spend free time dancing, shopping, and at sleepovers.
Social factors considered in the analysis

In recognition of work on self-identification (S-ID) in variationist studies (for instance, Asprey, Reference Asprey2008; Burbano-Elizondo, Reference Burbano-Elizondo, Omoniyi and White2006; Llamas, Reference Llamas, Omoniyi and White2006, Reference Llamas2007; Underwood, Reference Underwood and Thomas1988), informants were also classified according to this criterion. Speakers were asked to tick up to two boxes on a questionnaire, labeling themselves using terms regularly used in Midlan High discourse. Informants were invited to add other terms if they felt them to be more salient and, whilst some speakers expanded upon their choices, nobody added additional labels. Informants were asked to tick two boxes because nearly all informants always ticked “normal” and it was necessary to ensure that informants identified other salient classifications in addition to this one. By excluding the normal identifications, examining feedback on the forms, and checking with speakers, each speaker was allocated a principal classification.
Following Labov (Reference Labov1966, Reference Labov2001), social class status was assigned on the basis of an index that allocated each girl a score according to parental education, occupation, and house price.Footnote 6 Parental data were used because of the age of the informants involved. Education levels distinguished among (i) high school (up to 15 years of age), (ii) high school (15+), (iii) college (16–18), and (iv) university (18+). Occupation was rated according to the Office of Population Censuses and Surveys' (1980) Classification of Occupations and Coding Index, and house price was evaluated using the UpMyStreet website,Footnote 7 which provides average house prices for postcode areas. The social class calculations initially resulted in five different class statuses, but these were collapsed into two classes following preliminary runs on the data. Having two classes more accurately reflected ethnographic observations of the socioeconomic situation at Midlan High. Given the relative prosperity of Green Vale, there was clustering around the center of the socioeconomic hierarchy, reflecting an apparent lower middle class/upper working class distinction, as shown in Table 1.
Finally, parental place of birth (PPoB) locations were analyzed. Informants were ranked according to whether (i) at least one parent was from Bolton, (ii) at least one parent was born locally (i.e., in the northwest of England), or (iii) both parents were from elsewhere. These classifications followed initial comparisons of mother and father place of birth combinations.
In all, 2747 tokens of first- and third-person singular was/were were analyzed using Goldvarb X (Sankoff, Tagliamonte, & Smith, Reference Sankoff, Tagliamonte and Smith2005).Footnote 8 To avoid the effects of interaction, each of the social factors discussed was run in a separate multivariate analysis. The same linguistic constraints on nonstandard were were considered in each separate analysis: (i) polarity, (ii) grammatical subject, and (iii) clause type.
Previous studies of was/were have shown a consistent polarity effect, with negative contexts favoring nonstandard were.Footnote 9 Findings on the effects of grammatical subject have been less conclusive. Cheshire and Fox (Reference Cheshire and Fox2009) reported that grammatical subject had no consistent effect on nonstandard was nor nonstandard weren't in their London data set.Footnote 10 In other analyses of pattern (ii), there is some consistency for leveled weren't: Ocracoke (Schilling-Estes & Wolfram, Reference Schilling-Estes and Wolfram1994) and York (Tagliamonte, Reference Tagliamonte1998) varieties show increased nonstandard weren't in existential contexts and decreased weren't with noun phrase subjects; and Ocracoke, York, and Lumbee (Wolfram & Sellers, Reference Wolfram and Sellers1999) varieties all exhibit more nonstandard weren't with first-person than with third-person singular pronouns. However, Britain (Reference Britain2002) showed the reverse pattern in Fenland English—his subject constraint hierarchy for leveled weren't was: noun phrase > third-person pronoun > existential > first-person pronoun. It may be significant that the Fenland variety has a historically documented use of leveled were in positive contexts and maintains a relatively higher rate of these forms (Britain, Reference Britain2002:23–24); as such, it may be the only locale that reflects, at least partially, the constraints of a more fully leveled were system. This possibility will be considered further below.
The third linguistic constraint considered is clause type. Schilling-Estes and Wolfram (Reference Schilling-Estes and Wolfram1994:281) did not consider this factor explicitly, but stated that “there may well be some quantitative differences in the syntactic constructions in which the form occurs.” Both Tagliamonte (Reference Tagliamonte1998) and Cheshire and Fox (Reference Cheshire and Fox2009) considered syntactic configuration and found tag questions to be particularly significant in the use of nonstandard weren't. Cheshire and Fox (Reference Cheshire and Fox2009:16–17) also found subject-verb order to have a significant effect on nonstandard was, with interrogatives with postverbal subjects exhibiting more nonstandard forms than declaratives with preverbal subjects. In the light of these findings, an extensive range of clause types was coded in the analysis undertaken here.
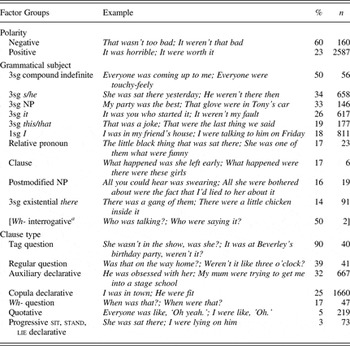
Table 2 illustrates all of the linguistic factors considered in the analysis and the rates of nonstandard were for each individual factor. All the factors shown were run in the multivariate analysis except wh- interrogatives in the grammatical subject factor group, which were too infrequent to accurately predict their patterning. Where the marginals in Table 2 show factors to behave similarly and it was “linguistically principled” (Wolfram, Reference Wolfram and Preston1993:216), factors were collapsed in the analysis to avoid empty cells where counts were low. In the grammatical subject factor group, relative pronouns, clause subjects, postmodified NPs, and existential there were collapsed into one factor. All of these subject types exhibit ambiguity over the number assignment of the subject, either because the subject itself refers anaphorically (relative pronouns) or cataphorically (existential there) to a notional subject elsewhere in the clause, or because the subject itself is syntactically complex (postmodified NPs and clauses). As Tagliamonte (Reference Tagliamonte1998:172) noted, “the relative proximity of the subject noun and the verb and what comes between them directly influence whether agreement occurs,” thus we might expect opaque or complex subjects to differ from other subject types either because of the separation of the anaphoric and notional subjects or because of “more general processing reasons” if the subject itself is complex (Tagliamonte, Reference Tagliamonte1998:172).
Linguistic factors considered in the analysis of nonstandard were

Note: aExcluded from the analyses.
The only other factors to be combined in the grammatical subject factor group were third-person singular (3sg) s/he and 3sg NP. Initial runs on the data weighted these factors within 0.001 of each other.
In the clause type factor group, two factors were combined: quotative and progressive sit, stand, lie.Footnote 11 The latter verbs were separated from the other progressive auxiliaries because of the distinct way that they behave in the northwest of England (as observed by Cheshire, Edwards, & Whittle, Reference Cheshire, Edwards, Whittle, Milroy and Milroy1993:70–71; Edwards & Weltens, Reference Edwards, Weltens and Viereck1985:109). Instead of I was sitting/standing/lying, the predominant form used in Bolton English is I was sat, stood, lay. The peculiarity of progressive sit, stand, lie has elsewhere been observed in relation to quotatives: Stein (Reference Stein1990); Rickford, Wasow, Zwicky, and Buchstaller (Reference Rickford, Wasow, Zwicky and Buchstaller2007); and Rathje (Reference Rathje2009) have suggested these forms may be developing new quotative functions (cf. Stein's [1990] example: “I'm sitting there, ‘This is an English test?’”). This observation provides a principled reason to combine these two factors which may both serve related discourse functions. Although it could be argued that these two factors ought to have been excluded entirely, given that scores of less than 5% indicate potential candidates for exclusion from variation analyses (Guy, Reference Guy, Ferrara, Brown, Walters and Baugh1988:132; Taglimonte, 2006:87), they are not categorically standard contexts. It is not the case that quotatives nor progressive sit, stand, lie never occur with nonstandard were, rather, they do so rather infrequently. Their presence in the model did not result in the kind of unstable results observed by Guy (Reference Guy, Ferrara, Brown, Walters and Baugh1988:132); thus, they were included.
One other issue in the clause type factor group deserves comment. The remaining factors are sectioned into interrogative and declarative types, with the declaratives further separated into copula and auxiliary forms. Of course, it is possible for there to be copula and auxiliary interrogatives. However, auxiliary interrogatives were rare and patterned in the same way as copula interrogatives. Thus, only the declaratives are separated for copula and auxiliary forms in this factor group.
Having outlined the social and linguistic factors considered, it is now possible to consider the results of the multivariate analyses.
RESULTS
Internal constraints
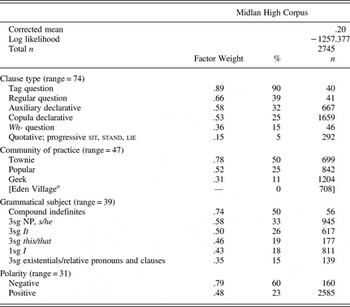
Table 3 shows the results for the CofP multivariate analysis. As there was consistency in the factor weights and the rankings of the linguistic constraints across all of the analyses, only the CofP run is shown here. This consistency is unsurprising, given the proven regularity of internal constraints (Labov, Reference Labov1969:729, Reference Labov2001:34; Sankoff & Labov, Reference Sankoff and Labov1979).
Multivariate analysis of the contribution of internal factors and community of practice to the probability of nonstandard were.

Note: aNot run in the binomial, up and down analysis.
The patterning of the linguistic constraints provides some confirmation of the findings of previous studies of was/were variation. Clause type, grammatical subject, and polarity are all selected as significant. As predicted by Tagliamonte (Reference Tagliamonte1998) and Cheshire and Fox (Reference Cheshire and Fox2009), tag questions are ranked more highly than any other clause type, with regular questions also highly ranked. Declaratives do not exert any strong effect on nonstandard were. More surprisingly, wh- questions disfavor nonstandard were. Cheshire and Fox's analysis of clause type did not separate regular and wh- questions, but the data here suggests that the two forms pattern differently. A possible explanation of this may be the relative formality of wh- questions compared with regular questions (Kearsley, Reference Kearsley1976:371), resulting in the former's inhibition of nonstandard forms.Footnote 12
Quotatives and progressive sit, stand, lie also disfavor nonstandard were. Given that these forms apparently have fixed discourse functions, it is possible that they have grammaticalized differently from other was/were forms (see Buchstaller, Reference Buchstaller2004, for a comprehensive discussion of the grammaticalization of quotatives).
A closer look within some of the other factor groups reveals some differences from other studies. Of the grammatical subject types, only compound indefinites strongly favor nonstandard were. This contradicts Tagliamonte's (1998:169) data, which suggested that these pronouns did not pattern any differently to other third person pronouns. Nonetheless, it is not surprising that compound indefinites, which refer semantically to a mass of individuals, favor were.Footnote 13 The other subject constraints analyzed follow the pattern Britain (Reference Britain2002) observed for Fenland English, with only first-person singular (1sg) I and 3sg existentials (combined with other number ambiguous subject types in this analysis) switching their ordering. That the Bolton data patterns most closely with Britain's (2002) Fenland data substantiates the earlier claim that Britain's analysis may reflect relic constraints from a more fully leveled were system. In both of these data sets, existentials clearly disfavor nonstandard were. Previous discussion of existential was/were has focused upon its ability to constrain nonstandard was, which has been explained as a consequence of analogy with there's + plural constructions (Britain, Reference Britain2002:19; Meecham & Foley, Reference Meecham and Foley1994) but some of the studies (Schilling-Estes & Wolfram, Reference Schilling-Estes and Wolfram1994; Tagliamonte, Reference Tagliamonte1998) also rank existentials highly on the subject constraint hierarchy for nonstandard weren't. This pattern is reversed in the Midlan High data, which shows existentials disfavoring nonstandard were. However, note that existentials were the only context in which Midlan High exhibited marked levels of nonstandard was. It may be that, in the Bolton data analyzed here, the collocation ‘there + was’ is strong enough not just to increase nonstandard was output, but also to inhibit nonstandard were. Wolfram and Sellers (Reference Wolfram and Sellers1999:109) observed a similar pattern in Lumbee English and considered its contrast with Anglo-American varieties to be a matter of alternative lexicalization strategies.Footnote 14
Also contradictory to other findings is the ranking of 3sg it. Tagliamonte (Reference Tagliamonte1998:179) found that it was the most constraining of all third-person pronouns, so much so, that she described were leveling in York as “very highly circumscribed. It is used predominantly with negative tag questions with it.” Similarly, Cheshire and Fox (Reference Cheshire and Fox2009:25) observed that “the frequent collocation of weren't and it is … resulting in an invariant weren't it form that functions as a single analyzable unit” in their outer London data. Table 3 suggests that nonstandard were is much less circumscribed in the Bolton data analyzed here: It does not exert any strong effect on nonstandard were; indeed, it actually exerts a slightly weaker effect than 3sg NPs and s/he. When tag questions and grammatical subjects are cross tabulated, nonstandard were occurs marginally less frequently with it than with other subjects (3sg NPs and s/he = 93% [n = 15]; it = 83% [n = 21]). This suggests that, whilst tag questions clearly favor nonstandard were, no particular subject type combination is preferred in Bolton. Another striking result in the grammatical subject factor group is the low ranking of 1sg I, which contradicts most of the previous findings on nonstandard weren't (with the exception of Britain [2002], which also ranks 1sg I low on the constraint hierarchy).
Finally, we see that polarity patterns here as predicted by other studies. However, it is notable that this is the lowest ranking constraint (given that it has the smallest range within its factors). As we would always expect some difference in polarity (Anderwald, Reference Anderwald2002:182, notes that leveling is always likely to be more prevalent in negative clauses than in positive ones), this result supports the assertion that was/were variability in Bolton does not conform in any straightforward way with the positive was and negative weren't leveling pattern identified in other studies.Footnote 15 Although it may be possible to interpret high use of nonstandard were with tag questions (which always occur more frequently with negative polarity, see Kimps, Reference Kimps2007) as a movement toward a leveled was/weren't system, the findings on grammatical subject and the low ranking of the polarity constraint do not correspond with the circumscribed negative tag with it constraint identified by Tagliamonte (Reference Tagliamonte1998) and Cheshire and Fox (Reference Cheshire and Fox2009). Several studies have shown that use of local features is intensified in discursively weighty contexts (see, for instance, Schilling-Estes, Reference Schilling-Estes2004; Traugott, Reference Traugott, Eckert and Rickford2001; Woolard, Reference Woolard2008), thus, tag questions may show up as salient in different studies because of the well-established pragmatic salience of these features (see, for instance, Cameron, McAlinden, & O'Leary, Reference Cameron, McAlindan, O'Leary, Cameron and Coates1988; Holmes, Reference Holmes1984; Lakoff, Reference Lakoff1975; Moore & Podesva, Reference Moore and Podesva2009). This suggests that, rather than the Bolton system moving toward the leveled was/weren't pattern, we are simply seeing a universal tendency for pragmatically salient features to correlate with marked linguistic behavior.
External constraints
Earlier in the paper, it was argued that social classifications which most closely serve as surrogates for social practice capture social and linguistic covariation more reliably. Consequently, we might expect the CofP analysis to provide the most efficient model of the data, given that it is a classification based upon observations of social practice. There is some evidence in support of this expectation: The CofP analysis was the only one to produce a knockout group, the Eden Village girls. The marginals revealed that this CofP only used nonstandard were .3% of the time. This amounted to two instances of nonstandard were out of 708 tokens, which were produced by two girls who were peripheral members of this community (both girls had distanced themselves from this CofP when I returned to the school post-fieldwork). As the remaining Eden Village girls were categorical standard was users, this factor group was treated as a knockout in the CofP analysis and the speakers excluded from all of the multivariate analyses. To ensure the integrity of the linguistic analysis, four other categorical standard was users (a Geek and three Populars) were also excluded from the multivariate analyses.
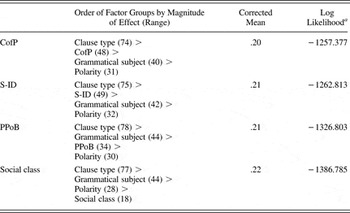
The results for each of the social factor runs are summarized in Table 4. These results reveal that each social factor was selected as significant in its individual multivariate analysis. The results are also suggestive of the extent to which each social factor models the variation. There is a close correspondence between the CofP and the S-ID analyses. Both of these factor groups exhibit a sizeable range, and they are highly ranked in the ordering of the factor groups by magnitude of effect (as indicated by the range; only clause type is ranked more highly). In comparison, the PPoB and the social class factor groups have a lower magnitude of effect in their respective runs, with social class ranked lowest of all the factor groups in its analysis.Footnote 16 To decode the relative effects of each of these social factors, it is necessary to look more closely at the patterns in the data. In this section, group and individual frequencies will be explored and compared to establish exactly how these social factors interact.
Summary statistics for each of the individual social factor runs

Note: N for all runs = 2745.
aThese log likelihood figures may look high, but this is, to some extent, a consequence of the number of factor groups run in the analysis. As Tagliamonte (Reference Tagliamonte2006:226) observed, “the more factor groups you put into an analysis, the bigger the log likelihood. A run with only two or three factor groups might produce a log likelihood of –456.24. A run with six factor groups might produce a log likelihood of –1456.24.”
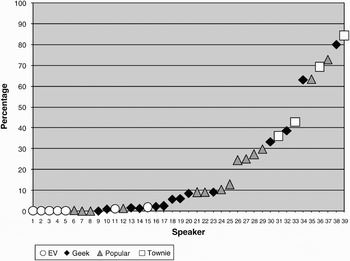
Beginning with the CofP classification, recall that Table 3 revealed that the Townie CofP clearly prefer nonstandard were, the Populars neither favor nor disfavor the variant, the Geeks clearly disfavor nonstandard were, and the Eden Village girls have near categorical use of standard was. Figure 1 provides further insight into this data by showing frequencies of nonstandard were according to individual and CofP membership. Each individual speaker is given a unique number, which remains the same in all subsequent figures and reflects their ranking in terms of nonstandard were use.
Frequencies of nonstandard were according to community of practice membership.

Figure 1 demonstrates more coherent patterning for the two extreme CofPs: the Townies (speakers 31, 33, 36, 39) and the Eden Village girls (speakers 1, 2, 3, 4, 5, 11, 15; speakers 11 and 15 are the peripheral Eden Villagers). The patterns for the Popular and Geeks CofPs are less regular: the Geeks (speakers 9, 10, 13, 14, 16, 17, 18, 19, 20, 23, 30, 32, 34, 38) tend to cluster more toward the bottom of the scale, and the Populars (speakers 6, 7, 8, 12, 21, 22, 24, 25, 26, 27, 28, 29, 35, 37) cluster more toward the mid/top of the scale, but neither is found exclusively at either end.
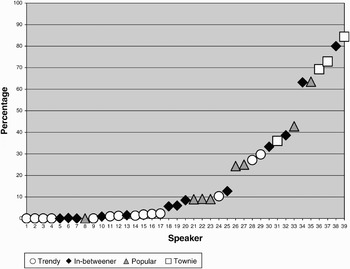
The S-ID results show parallels with those for CofP. The multivariate analysis for S-ID ranked the social factors as follows: Townie (.83) > Popular (.61) > In-betweener (.40) > Trendy (.27). The similarities between these runs are not surprising given that two CofP labels (Townie and Popular) were used in self-identification. Figure 2 shows that self-identified Townies cluster at the top end of the scale and self-identified Populars are also fairly consistently distributed on the upward part of the slope. However, the other S-ID labels, Trendy and In-betweener, seem to model the data less well than the CofP memberships. Whereas most of the Trendies are clustered on the bottom half of the slope, there are some Trendies who have over 10% nonstandard were (namely, speakers 24, 28, and 29); more problematic still, the In-betweeners do not exhibit any obviously coherent pattern, given that they are distributed throughout the scale.
Frequencies of nonstandard were according to self-identification.

A comparison of Figures 1 and 2 suggests that the S-ID model may be slightly less elegant than the CofP model because it does not distinguish the Eden Village Trendies (speakers 1, 2, 3, 4, 11, 15) from other girls who also appropriate the term trendy. Like the term normal, what is trendy is very much in the eye of the beholder. The Eden Village girls' notion of trendy (pastels, glitter, sleepovers) was very different from the Popular girls' notion of what was trendy (sportswear, make-up, hanging out in the lobby of the local cinema), and this is reflected in the distinction between those Trendies with zero nonstandard were and those with relatively high scores.
The term In-betweener is similarly ambiguous. It could mean in between Geek or Popular, for instance—something reflected by this label's distribution throughout the scale. A comparison of Figures 1 and 2 shows that the Populars who self-identify as In-betweeners (speakers 6, 7) are at the bottom of the scale, whereas the Geeks who self-identify as In-betweeners (speakers 30, 34, 38) are at the top of the scale. This suggests that the term In-betweener may be used as a generic label by those who realize that they do not fully fit the stereotype of the group with whom they share the majority of their social practices.
Despite problems with the labels used, it should be noted that there are some instances where S-ID seems to pattern more coherently than CofP. A Popular girl, Stacey (speaker 37), who has a nonstandard were score of 72.9%, self-identified as Townie even though she did not hang out with the Townie CofP identified here. However, the term Townie was not exclusive to this peer group. Stacey's older sister was described as a Townie. Increasingly, toward the end of the fieldwork, Stacey started to hang out more and more with her sister, engaging with older boys and with the wider working class culture accessed by the other Midlan High Townies. Thus, Stacey's use of the term illustrates her identification with (and aspirations to) a personality type, but it is an identification that transcends the interactions she has within her own high school peer group. In this way, Stacey's high score for nonstandard were may reflect Townie engagement that goes beyond the peer group studied in this paper. Here then, we see an example of how a S-ID categorization can be useful in identifying an individual's personal trajectory, which may not always be visible from looking at their institutional practice alone.
In contrast, one of the Townies, Ellie (speaker 33), who has a score of 42.8% nonstandard were self-identifies as Popular. Ellie highly valued her popularity as a group member and it may well be that the need to define herself as a popular person was more important to her than to acknowledge her Townie status, which was well-established. In an interview, she claimed to be happy to be called a Townie, but rejected the significance of labels, saying, “at the end of the day, as long as you're comfortable with yourself, that's all that matters.” For Ellie, the label was not important—it was the way in which she behaved that told people who she was.
This discussion suggests that S-ID can be a useful way to model the covariation of social and linguistic factors; however, to accurately interpret S-IDs, it may be necessary to have ethnographic knowledge of the speakers analyzed. As the discussion of the Trendies and In-betweeners has shown, analysts ought to be able to check that speakers are using S-ID labels in the same way and, if they are not, be able to accurately interpret the ways in which they are used.
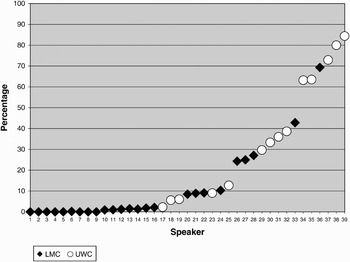
Turning to the data from the social class and PPoB analyses, the multivariate analyses showed predictable rankings. In the social class run, the factor weights for upper working class and lower middle class were .64 and .42, respectively. Though the range for this factor group is less remarkable than the social factors already considered, the multivariate analysis did not include categorical speakers. Figure 3, which includes these speakers, shows a striking pattern: almost all speakers who use less than 5% nonstandard were have higher social class status (only speaker 17 does not). Although not all of the middle class speakers pattern in this way, Figure 3 suggests that the higher one's social class, the more one is constrained to use standard was.
Frequencies of nonstandard were according to social class.

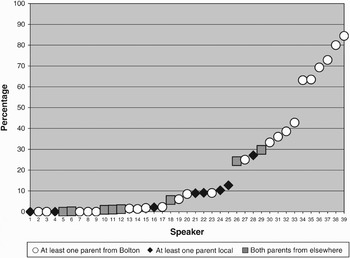
The PPoB run ranked the factors as follows: at least one parent from Bolton (.66); at least one parent local (.33); or both parents from elsewhere (.28). When this data is viewed by speaker, it becomes apparent that the most striking pattern occurs at the higher end of the scale for nonstandard were usage. Figure 4 shows that all of the speakers who use more than 30% nonstandard were have at least one parent from Bolton, which suggests that having at least one parent from Bolton is a prerequisite for high nonstandard were use.
Frequencies of nonstandard were according to parental place of birth.

On the one hand, Figures 3 and 4 do not reveal anything surprising. The first section outlined the history of nonstandard were in Bolton and revealed that this form is traditional to the area. As speakers who have links to the Bolton area are more likely to participate in familial and neighborhood networks that provide access to this grammatical form, we would expect them to exhibit higher frequencies of nonstandard were (given the norm enforcing tendencies of local networks [Milroy & Milroy, Reference Milroy, Milroy and Milroy1992]). Likewise, decades of sociolinguistic research have shown that the higher a speaker's social class, the less frequently they will use nonstandard forms; thus the clustering of higher class speakers at the lower end of the scale in Figure 3 is expected.
However, what is surprising about Figures 3 and 4 is what they reveal about the interaction between the structural categorizations of social class and PPoB and the practice-based CofP categorization. A comparison of Figures 1 and 3 shows that the CofP with the lowest rate of nonstandard were, the Eden Village girls, is the only CofP to have speakers who are exclusively from the higher social class. Recall from the ethnography that the Eden Village girls were named after their prestigious home location. All of these girls (except one: Catherine, speaker 3) live in this predominantly middle class area which has particularly high house prices. By virtue of its isolation from the other catchment areas of Midlan High (Eden Village is three miles from Midlan High, and the girls must use a bus service to travel to and from school), the Eden Village girls' home address restricts their ability to maintain friendships with girls outside their home village. Furthermore, the desirability of this village has meant that the population is heterogeneous, composed as it is of aspirational Boltonians who have moved there and wealthy incomers who have been drawn by the desirability of an elite Eden Village home address. Thus, the Eden Villagers' social engagements are largely limited to high status networks composed of individuals from a range of geographical backgrounds. These structural constraints simultaneously isolate their close-knit CofP and constrain their conservative near categorical use of standard was. Thus, whilst the practice of the Eden Villagers correlates with their language use, their practice itself is conditioned by their wider social circumstances and, more specifically, their social class.
On the other hand, there is no similarly marked interaction between the other CofP memberships and social class. A comparison of Figures 1 and 3 shows that Geeks, Populars, and Townies are drawn from both of the social class groups identified in this study. For instance, half of the Townies (speakers 33 and 36) are in the lower middle class group, and the other half (speakers 31 and 39) are in the upper working class group. This is because, unlike the isolated Eden Villagers, the girls from the other CofPs are regularly brought together irrespective of their social class backgrounds. Consequently, these girls do not experience the same intensity of structural constraints on their forms of engagement and participation—hence the patterning of nonstandard were largely transcends class boundaries. There are some notable exceptions: the three Popular girls with zero nonstandard were (speakers 6, 7, and 8), who look so irregular in Figure 1, all have lower middle class status. It is likely that there is something in particular about the class status of these three girls that constrains their use of nonstandard were, despite their engagement in other forms of practice associated with the Popular CofP. For instance, one of the girls, Cindy (speaker 8) was a committed dancer and actress and these activities most likely provided opportunities to engage more frequently beyond typical Popular networks. That the other two of these three girls (speakers 6 and 7) self-identify as In-betweeners suggests some awareness that their engagement in Popular practice is perhaps more tentative than that of some of their peers.
The other salient interaction in the data is that between Townie membership and PPoB: A comparison of Figures 1 and 4 shows that all of the Townies have at least one parent who was born in Bolton. One of the defining characteristics of the Townies is their use of the local area. Their social networks, which often include older boys who live in some of the most working class areas of Bolton, extend well beyond the safe suburbs surrounding Midlan High. It is likely that gaining access to these wider networks is, at least in part, dependent upon local social ties. However, it would be inaccurate to argue that the Townies are constrained to use nonstandard were because of their familial backgrounds. Figure 4 shows that there are many speakers with parents from Bolton who use little or no nonstandard were. Rather, having at least one parent from Bolton may be a resource that the Townies draw upon in the course of their social engagement. Their pursuit of daring, fun, and rebellion means transcending (what they perceive as) mundane life in Green Vale. Having established family connections in the Bolton area may facilitate deeper engagement in the practices traditionally associated with that geographical domain and provide more potential to network beyond their immediate home district. Unlike some of their peers, the Townies are motivated to exploit these network connections because of their desire to move beyond the gentile environs of Green Vale and explore the greater Bolton area. Their high use of nonstandard were reflects this engagement in the wider local networks in which this traditional feature is maintained.
Other speakers do not have the agency that the Townies appear to exercise. Figure 1 shows four Geeks with uncharacteristically high rates of nonstandard were (speakers 30, 32, 34, 38). Comparisons with Figures 3 and 4 reveal that these Geeks are simultaneously from the lower social class and have at least one parent born in Bolton. As noted in the ethnographic discussion, Geeks are defined by the manner in which they engage with the institutional norms of the school. Their shared engagement, which is confined to interaction within Midlan High, tends toward less cohesion and weaker ties than some of the other CofPs. Consequently, strong social ties and obligations outside school may exert as much, if not more, pressure upon their linguistic behavior as their interactions within the school. It is unsurprising, therefore, that Geeks from local lower class neighborhoods with Boltonian family have relatively high rates of nonstandard were. Much like the Eden Villagers, these speakers are isolated by their backgrounds, which inadequately challenged by weak ties within school, serve to constrain their linguistic practice. Like the atypical Populars, these Geeks identify themselves as In-betweeners, acknowledging their somewhat tenuous engagement in all of the CofP's practices.
This discussion has revealed a complex interaction between CofP membership, self-identification, social class, and parental place of birth. The case of the Eden Villagers and the atypical Geeks suggests that structural positioning may affect a speaker's linguistic behavior by constraining available forms of social engagement. The linguistic fate of these speakers is sealed by the relative isolation of their personal social networks, albeit in quite different ways. The Eden Villagers have neither desire nor opportunity to step outside their privileged environs. Similarly, but less fortuitously perhaps, the atypical Geeks may have desire but only limited opportunities to sustain forms of social practice that would facilitate their social (and linguistic) transformations. However, the case of the Townies (and to some extent, the Populars) demonstrates that speakers may transcend the boundaries imposed upon them by structural constraints if they have opportunities to do so and are motivated to exploit the alternative forms of engagement available to them. In doing so, these speakers are able to make use of linguistic resources that reflect the social practice in which they have chosen to engage. The Townies' use of a local nonstandard form reflects their engagement in locally instantiated, working class practices and enables them to acquire meaning for themselves that (for the higher class Townies, at least) transcends their actual social backgrounds.
CONCLUSIONS
The previous section has demonstrated the complex interaction of social factors that govern the probability of nonstandard were in the Bolton data analyzed here. More than this, however, it also provides a possible explanation for the maintenance of nonstandard were in this community in the face of standardization and other forms of leveling which have been observed elsewhere. The intense interaction of social factors reveals that nonstandard were is embedded in this community in a number of complex ways. That adolescents, in particular, use nonstandard were as a reflection of their social practices suggests that the form has active sociolinguistic salience. Though we might expect adolescents to exhibit higher levels of stable nonstandard forms (Labov, Reference Labov2001:119), the students at Midlan High have a whole range of nonstandard forms at their disposal. That the Townies (who are the individuals more actively motivated to engage in practices associated with localness), use more nonstandard were suggests that this form still has robust “sociolinguistic vitality” in Bolton. This CofP's use of the variant simultaneously reflects its traditional social class and geographic associations and constructs a more contemporary meaning indexical of the wild and rebellious social practices in which these individuals engage. It is possible that the establishment of multiple indexical orders (Silverstein, Reference Silverstein, Schieffelin, Woolard and Kroskrity2003) may serve to maintain a feature's “sociolinguistic vitality”; after all, if a form exhibits different levels of meaning (which may be symbolic of practices, identities, and locales), there is more potential for its use in creative forms of styling (see, for instance, Johnstone, Andrus, & Danielson, Reference Johnstone, Andrus and Danielson2006, who show the multiple and competing meanings of features associated with the local geographic area of Pittsburgh).
However, this study has also demonstrated that a CofP approach cannot explain everything about a feature's distribution. There are some speakers, such as the atypical Populars and Geeks, whose engagement in shared social practice within school correlates with their nonstandard were use less well than their social class and/or familial background. To use Bourdieu's (Reference Bourdieu and Nice1977) terminology, we might suppose that these speakers are constrained by other aspects of their habitus.Footnote 17 That speakers might be constrained in this way raises questions about speakers' abilities to use language creatively. Speakers cannot use language agentively if they are in some way constrained from fully engaging in the contexts in which alternative linguistic practices are acquired. In this sense, agency is a slippery concept; speakers may exhibit different motivations to engage in forms of sociolinguistic practice, but the data from the Eden Village girls and the atypical Geeks suggests that such desires can be conditioned by one's experience of the world.
This is not to dismiss the significance of social practice but to acknowledge that practices associated with social class and PPoB more strongly constrain some speakers than practices associated with their high school experience. As discussed in the introduction, the efficacy of social aggregates depends upon their ability to stand in for the actual contexts in which language is used and acquired. The issue here is not about practice, but about the ability of a CofP analysis to capture a sufficient snapshot of the multiple social practices in which individuals engage. The ethnography for this study took place in a high school and, as a result, captured the social practice within that institutional context. The analysis of nonstandard were suggests that some speakers engage in forms of social practice beyond the school that were not captured by their high school CofP membership. In these cases, social class and PPoB categorization served as better substitutes for practices that were linked to these structural constraints. This finding suggests that we may need to acknowledge the limitations of CofP categorizations. As noted elsewhere (Gee, Reference Gee2005; Meyerhoff, Reference Meyerhoff2005), the CofP is an excellent tool for accessing local level practice, but it may only capture a particular kind of practice (usually that associated with an institution, as the many high school CofP studies have shown; cf. Bucholtz, Reference Bucholtz1999; Eckert, Reference Eckert2000; Mendoza-Denton, Reference Mendoza-Denton2008; Moore, Reference Moore2004). In some cases, what goes on beyond that institutional context may better explain the linguistic variation we observe.
This paper has demonstrated that there are limitations to any form of social categorization, and that the best account of social and linguistic covariation may be that which favors neither structural nor practice-based aggregations, but considers their combined effects upon the data. The aggregation based most closely upon social practice, CofP, was argued to model the data most efficiently, but a study of the way in which this factor interacted with the other categorizations supplied further elaboration on the distribution of nonstandard were. In turn, this combined approach provided a more rounded explanation of the maintenance of nonstandard were in this Bolton community. This analysis suggests that nonstandard were is still alive and well in this northwest British town. Whether or not it remains so may depend upon whether or not it maintains an active role in local sociolinguistic practice.