Obsessive-compulsive disorder (OCD) is characterized by recurring and persistent thoughts, impulses, or images (obsessions), and/or repetitive behaviors or mental activities (compulsions) that one feels driven to do in response to an obsession or inflexible rule. This categorical conceptualization of OCD has steered research toward cognitive and behavioral aspects, others aside that appear to be key to the development and treatment of OCD, including emotional and social aspects (Cisler, Brady, Olatunji, & Lohr, Reference Cisler, Brady, Olatunji and Lohr2010). If we wish to understand mental disorders, we must comprehend the emotions underlying and sustaining them (Watson, Clark, & Carey, Reference Watson, Clark and Carey1988), as well as their relation to personality factors tied to the use, course, and efficacy of treatments (Hopwood et al., Reference Hopwood, Quigley, Grilo, Sanislow, McGlashan and Yen2008).
A growing number of researchers and clinicians insist that a dimensional approach must be undertaken when researching symptoms of psychopathology. Taking a dimensional perspective, we address the presence of obsessive-compulsive (OC) symptoms in the general population (Fullana et al., Reference Fullana, Mataix-Cols, Caspi, Harrington, Grisham, Moffitt and Poulton2009) and, in so doing, come closer to understanding individual vulnerability factors prior to any label of psychopathology being applied. This gives us important information while avoiding the inconveniences of using clinical samples (Gibbs, Reference Gibbs1996).
Emotions and OC Symptoms
Emotions are complex phenomena that exert a powerful influence on our behavior. Interest in studying the relationship between OCD and emotions has been relatively recent, and the results remain inconclusive. In general, emotional control is believed to directly regulate pathological behavior in people diagnosed with an anxiety disorder and OCD (Cisler, Olatunji, & Lohr, Reference Cisler, Olatunji and Lohr2009). More specifically, patients with OCD have difficulty recognizing emotional facial expressions, especially negative ones (Daros, Zakzanis, & Rector, Reference Daros, Zakzanis and Rector2014); show a higher sensitivity to and propensity for disgust (Berle & Phillips, Reference Berle and Phillips2006; Inchausti, Delgado, & Prieto, Reference Inchausti, Delgado and Prieto2015); and are more prone to guilt than people not suffering from the disorder (Mancini & Gangemi, Reference Mancini and Gangemi2015). Other researchers have concluded there is no difference in how these patients versus other clinical groups perceive emotions (Buhlmann, Wacker, & Dziobek, Reference Buhlmann, Wacker and Dziobek2015; Montagne et al., Reference Montagne, de Geus, Kessels, Denys, de Haan and Westenberg2008). Examining the relationship between emotional processing and OC symptomatology, Casado, Cobos, Godoy, Machado-Pinheiro, and Vila (Reference Casado, Cobos, Godoy, Machado-Pinheiro and Vila2011) found that subjects with more OC symptomatology, evaluated using images from the International Affective Picture System (IAPS; Lang, Bradley, & Cuthbert, Reference Lang, Bradley and Cuthbert2008), had less control over the emotion produced by the image than subjects with less OC symptomatology.
Personality and OC Symptoms
The relationship between obsessive-compulsive (OC) symptoms and personality is complex, given the array of personality models and their respective assessment tools, as well as OCD’s considerable clinical heterogeneity. Those factors make it altogether challenging to reach definitive conclusions. Generally, in nonclinical populations, the neuroticism dimension has been the main predictive factor for high scores on OC symptoms (Fullana et al., Reference Fullana, Tortella-Feliu, Caseras, Andión, Torrubia and Mataix-Cols2005, Malouff, Thorsteinsson, & Schutte, Reference Malouff, Thorsteinsson and Schutte2005). Other studies have reported differences in emotionality and scrupulousness between subjects at-risk and not at-risk for OCD (Roncero, Fornés, García-Soriano, & Belloch, Reference Roncero, Fornés, García-Soriano and Belloch2014). Patients diagnosed with OCD score higher on extraversion, agreeableness, and conscientiousness (Inchausti et al., Reference Inchausti, Delgado and Prieto2015); lower on neuroticism than patients diagnosed with a depressive disorder (Rector, Hood, Richter, & Bagby, Reference Rector, Hood, Richter and Bagby2002); and higher on avoidance, and lower on the dimensions of novelty-seeking, self-directedness, and cooperativeness (Alonso et al., Reference Alonso, Menchón, Jiménez, Segalas, Mataix-Cols, Jaurrieta and Pujol2008).
According to the literature review, emotions and personality both seem to relate to OC symptoms’ presence, intensity, and interference. However, much remains unknown about how they relate, and to what extent they influence the presence of OC symptoms. With that in mind, the present study’s objective was to examine in depth the relationship between emotional processing dimensions – in terms of Lang’s Bio-informational Model (1995), the Big Five personality factors, and OC symptoms in college students; then analyze the predictive value of emotional dimensions and the Big Five for OC symptoms. We expect that emotional processing dimensions will differentiate among high- and low-OC symptomatology groups, and will be viable predictors of OC symptoms scores.
Method
Participants
The participants were 100 college students ranging in age from 18 to 29 years old, with an average age of 20.98 years (SD = 3.34), of whom 71 were women. Participants were recruited through convenience sampling, at the lectures of required courses in different degree programs, by asking for research volunteers. They received nothing in exchange for their collaboration. None of the participants exhibited obsessive-compulsive symptomatology at the time of data collection, nor had they previously. That was corroborated by the Structured Clinical Interview for DSM (SCID–I outcomes (First, Spitzer, Gibbon, & Williams, Reference First, Spitzer, Gibbon and Williams1999).
Instruments
International Affective Picture System (IAPS; Lang, et al., Reference Lang, Bradley and Cuthbert2008). Adapted for the Spanish population by Moltó et al. (Reference Moltó, Segarra, López, Esteller, Fonfría, Pastor and Poy2013; Reference Moltó, Montañés, Poy, Segarra, Pastor, Irún and Vila1999), and Vila et al. (Reference Vila, Sánchez, Ramírez, Fernández, Cobos, Rodríguez and Moltó2001), it evaluates emotional processing using a set of normative emotional stimuli that reliably evoke a wide variety of emotional reactions, on a psychological as well as physiological level. IAPS is a library of over 1,000 images, and its reliability has been tested in an array of countries and cultures. The present study selected a total of 23 pictures for use based on descriptive data from earlier studies (Lang et al., Reference Lang, Bradley and Cuthbert2008); they were situated at all levels of the three dimensions being evaluated. Lang (Reference Lang1995) maintains that emotions can be defined according to an affective space made up of three emotional response systems, with certain characteristics in common: Valence (tendency toward approach or avoidance), arousal (higher or lower energy requirement), and dominance (continuity or interruption in the behavioral sequence). Those three characteristics are the three main dimensions organizing the emotional world at the highest level: Valence (the image’s level of pleasant-unpleasantness) connotes a positive or negative appraisal of the emotion, and regulates the direction of behavior – that is, positive valence (approach behaviors) or negative valence (avoidance behaviors); arousal (aroused-calm) indicates the level of energy the emotion requires, and is associated with the level of physiological activation one feels when visualizing the image; and dominance (controller-controlled) indicates the subject’s level of control over the image, and ability to terminate the emotion, respectively (Lang, Greenwald, Bradley, & Hamm, Reference Lang, Greenwald, Bradley and Hamm1993).
Self-Assessment Manikin (SAM; Bradley & Lang, Reference Bradley and Lang1994). This nonverbal, pictorial measurement scale is quick and easy to administer. It includes three types of human-like figures, and gives respondents a sequential scale from one to nine points with which to measure the intensity of each dimension evaluated by the IAPS images. This method of assessment collects information for each image selected, on the three overarching emotional dimensions of valence, arousal, and dominance.
Dimensional Obsessive-Compulsive Scale (DOCS; Abramowitz et al., Reference Abramowitz, Deacon, Olatunji, Wheaton, Berman, Losardo and Hale2010 ). The Spanish-language version (Fullana, López-Solá, & Petrusa, Reference Fullana, López-Sola and Pertusa2010; López-Solá et al., Reference López-Solá, Gutiérrez, Pino, Rosado, Taberner, Segalàs and Fullana2014) was used, which has the same psychometric properties as the original. It is a brief 20-item questionnaire that evaluates, from a dimensional perspective, the presence of OC symptomatology. It has a total of four subscales, pertaining to four different areas of content where symptoms emerge: Worries related to germs and contamination (contamination and hygiene); Concerns related to causing harm, injury, or bringing bad luck (responsibility for damage); Unacceptable/prohibited thoughts; and Preoccupation with symmetry and the need for things to be in their right place (order and symmetry). It also evaluates five severity parameters (SPs) related to time spent; avoidance behaviors; associated distress or anxiety; interference with functioning; and difficulty ignoring obsessions and resisting compulsions. This study utilized individual scale scores, as well as total DOCS scores computed as the sum of all responses.
NEO Five-Factor Inventory (NEO-FFI; Costa & McCrae, Reference Costa and McCrae1992 ). The 60 items comprising it evaluate, in brief, five major personality dimensions – Neuroticism, Extraversion, Openness, Agreeableness, and Conscientiousness, which correspond to the five traits that the Big Five Model’s authors propose.
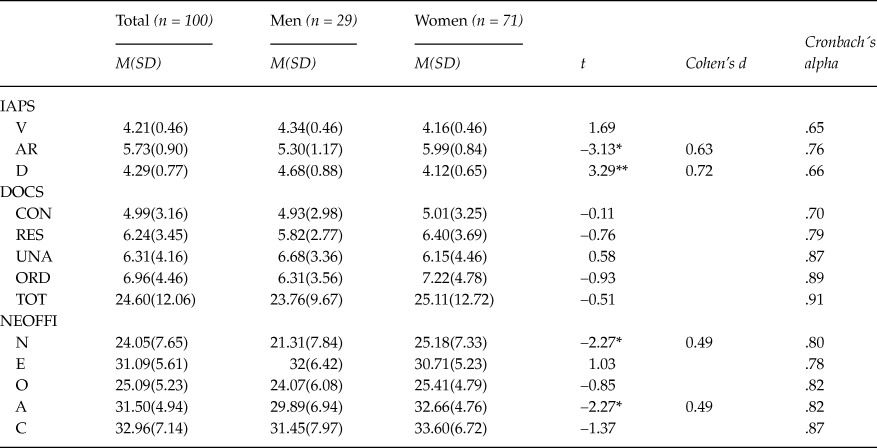
Clinical interview (SCID–I; First et al., Reference First, Spitzer, Gibbon and Williams1999 ). This was conducted by one of the researchers, who has over four years of experience in clinical assessment and intervention. The aim was to establish an absence of obsessive-compulsive symptomatology in participants at the time of data collection. Each scale’s internal consistency was recorded, using Cronbach’s alpha value, and appears in Table 1.
Means and Standard Deviations of IAPS, DOCS, and NEOFFI Scores. Student’s t Test for Independent Samples. Effect Size. Cronbach’s alpha Value.

Note: IAPS = International Affective Picture System; V = Valence; AR = Arousal; D = Dominance; DOCS = Dimensional Obsessive-Compulsive Scale; CON = Contamination and hygiene; RES = Responsibility for damage; UNA = Unacceptable or prohibited thoughts; ORD = order and symmetry; TOT = Total score on the DOCS; NEO-FFI = Neo Five-Factor Inventory; N = Neuroticism; E = Extraversion; O = Openness, A = Agreeableness; C = Conscientiousness.
*p < .05. **p < .001.
Procedure
Participant recruitment and individual interviews were conducted over the course of two months. Once the interviews were finalized, questionnaires were administered in groups of five to eight participants, in sessions approximately 40 minutes in length. The questionnaires were administered in a classroom, so testing conditions (noise, light, distance, etc.) were similar for all participants. First, the IAPS-SAM was administered. Each image was projected on a screen so that all participants were the same distance from it. Each was projected for eight seconds, and followed by a black screen for an eight-second interval, so participants had time to answer before we continued on and projected the next image. The DOCS and NEO-FFI questionnaires were administered last.
The present study adopted the ethics criteria established under prevailing norms. Accordingly, as a prerequisite to testing, all participants were informed of the characteristics and objectives thereof. We requested their informed consent to participate in the study in writing, as well as their commitment not to record or distribute the images that would be presented. They were, furthermore, assured about the anonymity and confidentiality of all data collected, which were solely for research purposes.
Data Analysis
The data were analyzed using the SPSS statistical package, version 21. We conducted descriptive data analyses, tested for normal distribution using the Kolmogorov-Smirnov test, and measured effect size by means of Cohen’s d. We split the total DOCS score variable, establishing two groups (high and low) using the 75th percentile as a cut-off. Student’s t tests for independent samples were carried out, along with multivariate linear regression analysis (entry method).
Results
Descriptive Data Analyses. Emotional Processing Dimensions (Valence, Arousal, and Dominance), DOCS, NEO-FFI Dimensions, Sex Differences
Table 1 displays the results of descriptive data analyses, the K-S test, and a means comparison of questionnaire scores according to sex. Our participants’ scores on the three dimensions of emotional processing were similar to what Lang et al. (Reference Lang, Bradley and Cuthbert2008) reported. With regard to sex differences, we found statistically significant differences in the arousal, dominance, neuroticism, and agreeableness dimensions, with women scoring much higher on all scales except dominance, where men scored higher. In light of these results, subsequent analyses were conducted separately for men and women.
Differences in Emotional Processing Dimensions and NEO-FFI Dimensions According to High- and Low-scoring Groups on Self-perceived OC Symptomatology. Separated by Sex
First, participants were split into two groups: High and low. To do so, we calculated the 75th percentile of total DOCS scores, for men and women separately, finding scores of 31 and 33, respectively. The low group, scoring under the 75th percentile, displayed fewer OC symptoms; whereas the high group, scoring at or above the 75th percentile, reported greater self-perceived OC symptomatology.
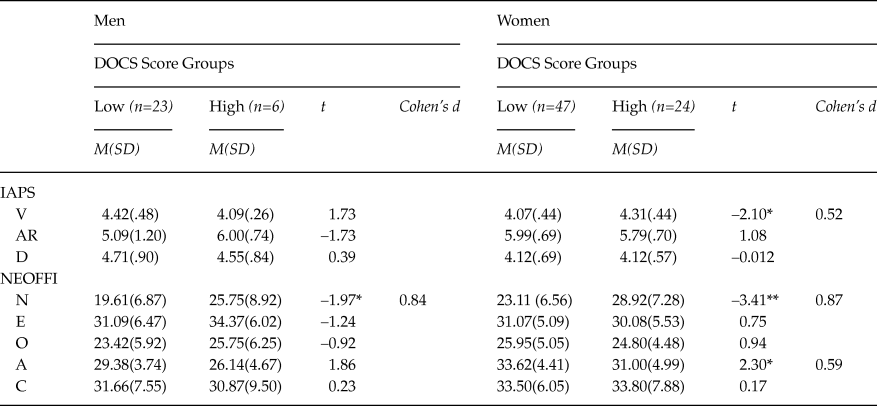
We utilized Student’s t test for independent samples to compare the high- and low-scoring groups in terms of self-perceived OC symptoms, separately for men and women. In terms of the emotional processing dimensions, the two groups of women showed significant differences in that the high DOCS group scored higher on the valence dimension than the low group. That suggests they perceived the IAPS images presented more disagreeably and negatively compared to the low group (see Table 2).
Differences in Emotional Processing Dimensions and Personality (NEO-FFI) According to Total DOCS Scores, by Sex. Student’s t Test for Independent Samples. Effect Size.

Note: IAPS = International Affective Picture System; V = Valence; AR = Arousal; D = Dominance; N = Neuroticism; E = Extraversion; O = Openness, A = Agreeableness; C = Conscientiousness.
DOCS = Dimensional Obsessive-Compulsive Scale; NEO-FFI = Neo Five-Factor Inventory; d = Cohen’s d
*p < .05. **p < .001.
On NEO FFI dimensions, in both men and women, there were statistically significant differences such that the high-symptomatology groups scored higher on neuroticism. Additionally, women showed significant differences such that the DOCS high group scored lower on agreeableness than the DOCS low group. Furthermore, participants (women and men) who scored high on OC symptoms were characterized by lower emotional stability, and tended to experience more negative moods, more irrational ideas, and less impulse control than those who scored low on OC symptoms. Furthermore, women in the high-OC symptoms group tended to define themselves as less sociable, agreeable, and cooperative, and to show a lower capacity for empathy.
Relationship between Emotional Processing Dimensions, the NEO FFI, and OC Symptoms. Regression Analysis. Separated by Sex
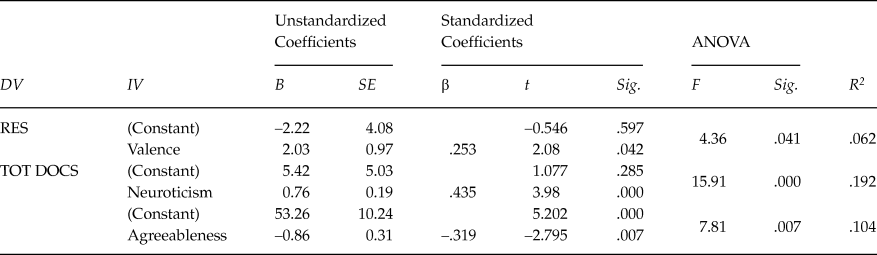
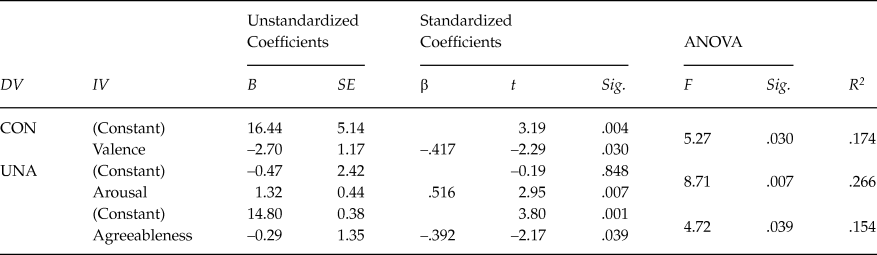
Last, we conducted linear regression analysis (variable entry method) to analyze the predictive value of emotional processing dimensions and NEO FFI dimensions for individual scale scores and total scores on the DOCS. In women, results pointed to a significant predictive association between valence and the responsibility for damage scale of the DOCS, and between neuroticism and agreeableness scores, and DOCS total scores (see Tables 3 and 4).
Linear Regression Analysis. Variable Entry Method. Partial Regression Coefficients. Women’s Group

Note: RES = Responsibility for damage; DOCS = Dimensional Obsessive-Compulsive Scale; TOT DOCS = Total score on the DOCS; R 2 = Coefficient of determination.
Linear Regression Analysis. Variable Entry Method. Partial Regression Coefficients. Men’s Group

Note: CON = Contamination and hygiene; UNA = Unacceptable or prohibited thoughts; R 2 = Coefficient of determination.
In men, the arousal and agreeableness dimensions significantly predicted scores on the unacceptable/prohibited thoughts scale, and the valence dimension significantly predicted scores on the contamination and hygiene scale. There were no statistically significant results found among the remaining emotional and personality dimensions.
Discussion
This study’s objective was to unpack the relationship between emotional processing dimensions, the Big Five personality factors, and OC symptoms in college students.
Scores on the dimensions of emotional processing of IAPS images were similar to what earlier studies reported (Lang et al., Reference Lang, Bradley and Cuthbert2008; Moltó et al., Reference Moltó, Montañés, Poy, Segarra, Pastor, Irún and Vila1999). In terms of sex differences, men – compared to women – perceived IAPS images with a higher level of dominance and lower arousal, implying they might feel less influenced by the images (external aspects), and less physiologically aroused. These results are consistent with Moltó et al.’s (Reference Moltó, Segarra, López, Esteller, Fonfría, Pastor and Poy2013) findings, and with research on stereotypes about sex differences surrounding emotional responses, whereby women would respond to the images with greater emotion (Lithari et al., Reference Lithari, Frantzidis, Papadelis, Vivas, Klados, Kourtidou-Papadeli and Bamidis2010). According to Lang (Reference Lang1995), dominance impacts continuity versus bursts of emotion over time, so men feel more able to interrupt the emotional experience than women.
Regarding the observed differences in emotional and personality dimensions between the high- and low-OC symptoms groups, valence was able to differentiate between the two groups of women, with women in the high group perceiving images as more unpleasant, and tending to engage in more avoidance behaviors. Likewise, they resembled people diagnosed with OCD in their overestimation of threat, with neutral stimuli being processed as threatening/unpleasant (Rhèaume, Ladouceur, & Freeston, Reference Rhèaume, Ladouceur and Freeston2000).
In terms of personality, in both men and women, the high-OC symptoms group scored higher on neuroticism. However, women with high OC symptoms additionally scored distinctly lower on agreeableness. Therefore, the neuroticism dimension was able to differentiate between men with high- and low-OC symptoms, and women with high- and low-OC symptoms, and it was the only dimension where we found differences in the men’s group. These results are akin to Mancini and Gangemi’s (Reference Mancini and Gangemi2015) findings that people who reported more OC symptoms described themselves as more susceptible to guilt, which is one of the central characteristics of neuroticism. This result also supports Inchausti et al.’s (2015) findings of a positive, significant correlation between conscientiousness and all the subscales comprising the DOCS. Moreover, women with high scores on OC symptoms reported themselves to be less sociable, empathic, and agreeable. The agreeableness dimension, along with extraversion, is among those that predict social adjustment, and as part of that, empathy is key to our understanding of and approach to different disorders, in addition to being an essential factor in social interaction (Decety & Moriguchi, Reference Decety and Moriguchi2007). Fontenelle et al. (Reference Fontenelle, Soares, Miele, Borges, Prazeres, Rangé and Moll2009) argue that the relationship between OC symptoms and empathy might be due to the presence of anxiety and depression, which OCD patients often display. We did not evaluate participants for anxiety and depression in this study, but we believe this result should be more deeply examined in subsequent studies. Epidemiological studies suggest sex differences in negative affect scores, which would also be associated with anxiety and depression (Sachs-Ericksson & Ciarlo, Reference Sachs-Ericksson and Ciarlo2000), and could explain our results.
Conversely, we did not observe differences in extraversion in subjects with OC symptomatology, whereas other studies have (Fullana et al., Reference Fullana, Tortella-Feliu, Caseras, Andión, Torrubia and Mataix-Cols2005; Roncero et al., Reference Roncero, Fornés, García-Soriano and Belloch2014); nor in conscientiousness, one facet of which is order, which encompasses traits related to cleaning, tidiness, and organization (Costa & McCrae, Reference Costa and McCrae1992). The latter results might be due to participant characteristics; namely, Inchausti et al. (Reference Inchausti, Delgado and Prieto2015) used clinical samples diagnosed with OCD and other anxiety disorders, while our participants were college students. The result might even be due to features of the symptom itself, considering that conscientiousness seems to be more closely related to the checking and rechecking typology (MacDonald & Davey, Reference MacDonald and Davey2005).
Finally, our analyses of prediction illustrate a complex relationship between the dimensions of emotional processing, of personality, and the presence and severity of OC symptoms in our participants. Among the women, a tendency to perceive images as more unpleasant would relate to worries about causing harm, injury, or bringing bad luck. Meanwhile, in men, a tendency to perceive images as more pleasant would relate to less worries about contamination and germs; and the higher psychophysiological arousal prompted by the images would relate to more prevalent prohibited and unacceptable thoughts.
Shifting our attention to personality factors, neuroticism would predict high scores on OC symptoms among women, while agreeableness would relate to low scores in both women and men. For men, though, agreeableness was connected especially to an absence of prohibited/unacceptable thoughts. Fullana et al. (Reference Fullana, Tortella-Feliu, Caseras, Andión, Torrubia and Mataix-Cols2005) maintain that neuroticism is a main predictor of high scores on OC symptoms in non-clinical populations. Neuroticism is conceived of as a disposition to experience negative emotions in response to difficult situations, or situations appraised as difficult by the subject (Watson, Reference Watson1999). In addition to the neuroticism dimension, Roncero et al. (Reference Roncero, Fornés, García-Soriano and Belloch2014) reported a predictive value of extraversion for OC symptomatology. Our results did not provide evidence to that effect, but we did find that agreeableness had predictive value for low scores on the DOCS and the unacceptable thoughts scale. The two dimensions have some overlapping content, aspects of social adjustment, which might explain the coincidence.
These results may be of interest to our understanding of OC symptomatology by incorporating important emotional variables (Watson et al., Reference Watson, Clark and Carey1988) and plans for intervention. Likewise, some researchers suggest that emotional experiences, and the processing thereof, may promote positive psychotherapy outcomes (Herrero et al., Reference Herrero, Castilla, Vizcaíno, Molinari, García-Palacios and Botella2013, Magnavita, Reference Magnavita2006), and that personality dimensions can mediate treatment efficacy in various mental disorders (Hopwood et al., Reference Hopwood, Quigley, Grilo, Sanislow, McGlashan and Yen2008), and specifically OCD (Kyrios, Hordern, & Fassnacht, Reference Kyrios, Hordern and Fassnacht2015).
In addition to obvious limitations to the generalizability of our participants’ results – due to sample size, sample characteristics, and selection technique used – we shall comment on other limitations that arose in this study. First, please note that the IAPS-SAM is based on the semantic differential technique, to establish continuity between two ends of three emotional processing dimensions. Not unusually, this technique has a theoretical foundation, but it does not in and of itself establish a measurement model, but rather a psycho-semantic theory. That very quality could be interpreted as bias, determining two ends for each emotional processing dimension, since they are not opposing by definition alone.
For all the reasons above, we believe these results should be taken and analyzed with every sort of precaution. However, we do believe they are relevant and promising by suggesting that emotional processing is a variable of interest to better understand OC symptoms, and that effective interventions should be designed with such differences in mind. Furthermore, we will need to keep broadening our sample of participants; more deeply explore sex differences; and expand and compare these results to clinical samples, in order to verify differences we found, and relationships we proposed, here.