The transition metal dichalcogenides (TMDs) have recently garnered much attention due to their potential for new and highly efficient electrical and optical devices. Reference Wang, Kalantar-Zadeh, Kis, Coleman and Strano1–Reference Chang, Yang, Lee, Taom, Hwang, Jena, Lu and Akinwande11 Unlike graphene, Reference Novoselov, Geim, Morozov, Jiang, Zhang, Dubonos, Grigorieva and Firsov2 TMDs have a finite band gap. Reference Mak, Lee, Hone, Shan and Heinz3 This is critical for transistor applications and indeed excellent switching behavior with high ON/OFF ratio has been demonstrated for a number of different TMDs. A three terminal transistor behavior is also used extensively to probe the material properties, such as dielectric permittivity and mobility, of the TMD material. However, when these structures are characterized in the ambient conditions, different molecules, such as oxygen, water vapor, etc., can get absorbed at the interface between the channel and the gate oxide. These molecules typically lead to trapping centers at the interface. Reference Late, Liu, Matte, Dravid and Rao12–Reference Lee, Yu, Cui, Petrone, Lee, Choi and Lee17 As a result, in almost all experiments a DC sweep of the gate voltage, V g, shows large hysteresis of the drain current, I D. These trap states and resulting hysteresis are highly undesirable. For example, the traps can continuously change the threshold voltage as a function of gate bias; more importantly they can significantly reduce the ON current. On the other hand, the two branches of the hysteresis curves are typically different and usually depend on the initial condition, rate of sweep, etc. Therefore, critical parameters, such as mobility, which is extracted from the slope of the I d–V g characteristic (or the so-called transfer characteristics), can no longer be reliably estimated. In this work, we first show that the dependence of the hysteresis on different parameters can be effectively exploited to quantify the nature and density of the trap states. Such information can provide important insight as to how to engineer the interface for optimum device performance. Next, we show that by applying carefully designed pulses to the gate of the transistor, the effect of the trap states can be completely removed and thus the hysteresis can be eliminated, revealing the intrinsic nature of the material itself.
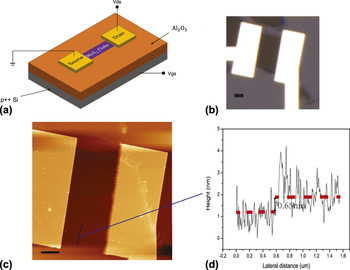
In this work, we have used a monolayer MoS2 as our model system. Aluminum dioxide (Al2O3) was used as the gate dielectric and was deposited using the atomic layer deposition onto a heavily doped p-type Si substrate. To achieve good color contrast with MoS2, the thickness of the Al2O3 was chosen to be 72 nm. Reference Benameur, Radisavljevic, Heron, Sahoo, Berger and Kis18,Reference Liu, Kang, Sarkar, Khatami, Jena and Banerjee19 Monolayer MoS2 flake was mechanically exfoliated from bulk crystal, then transferred onto the oxide surface, and finally localized under the optical microscope. The electrodes were patterned by e-beam lithography. An Au (60 nm)/Ti (10 nm) bi-layer was used as the electrode metal [Fig. 1(b)]. Atomic force microscope (AFM) was used to confirm the flake's thickness [Figs. 1(c) and 1(d)]. All the DC electrical characterizations were done under dark condition and at the ambient environment.
(a) The schematic of back gate MoS2 transistor. (b) The optical image. (c) The AFM image of fabricated device. Scale bars are both 2 µm. (d) Corresponding flake thickness measurement.

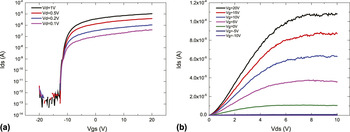
The transfer characteristics of the monolayer transistor are shown in Fig. 2. The transistor shows n-type transfer behavior [Fig. 2(a)], with an on/off ratio ∼108, a subthreshold swing (SS) of 127 mV/dec, and negligible gate leakage. As shown in Fig. 2(b), in the saturation region, the current density reaches around 15 µA/µm. Schottky behavior is observed in the low V ds region, which limits the total current obtainable from this transistor.
(a) The transfer curves with gate voltage sweeping from −20 to 20 V, drain bias ranging from 0.1 to 1 V. (b) The source/drain electrical characteristics with different gate biases.

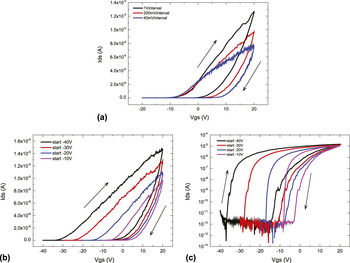
As the gate voltage is swept back and forth, a clear hysteretic behavior is observed (Fig. 3). We have characterized the hysteresis by varying different test parameters. Figure 3(a) shows the I d–V g behavior as the gate voltage is started from −20 V, gradually increased to 20 V and then brought back to −20 V with different sweeping intervals. With higher sweeping interval values, in other words, fewer sweeping points, the hysteresis window is shallower and the on current at 20 V is higher. Figures 3(b) and 3(c) show the transfer characteristics with different starting points while keeping the interval unchanged. It is clear that a more negative starting point leads to a shift of the threshold voltage toward the left. Using this fact, the nature and distribution of the trap centers can be understood, which we will discuss next.
(a) The I ds–V gs sweeping with different sweeping intervals, ranging from 40 mV to 1 V. (b and c) The I ds–V gs curve in linear axes (b) and in log y axis (c) with different starting points from −40 to −10 V, with the same ending point (20 V). The sweeping interval is kept unchanged at 200 mV. Drain voltages are all 1 V.

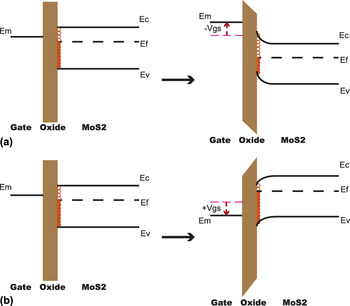
The trapping mechanism can be understood from the schematics shown in Fig. 4. The interface states in the band diagram are all following the Fermi–Dirac distribution:
 $$f\left( E \right) = {1 \over {1 + {{\rm{e}}^{{{\left( {E - {E_{\rm{F}}}} \right)} \mathord{\left/ {\vphantom {{\left( {E - {E_{\rm{F}}}} \right)} {kT}}} \right. \kern-\nulldelimiterspace} {kT}}}}}}\quad .$$
Schematics of interface trapping states changing with gate bias (a) in negative direction, and (b) in positive direction.

Considering an interface state above the Fermi level, the possibility to have electrons trapped is low. While for states below the Fermi level, the states are mostly full with trapped electrons. Once negative voltage is applied to the gate [Fig. 4(a)], the band near the interface will shift upwards. This will lead to some states initially to come above the Fermi level which was initially full. This process thus detraps electrons, increasing the current. On the other hand, when positive gate bias is on [Fig. 4(b)], states previously above the Fermi level will go down below it, resulting in trapping more electrons and eventually reducing the channel current.
Note that once the trapping/detrapping happens, a reasonably long relaxation period is needed by the states to return to the initial condition even after the gate bias is removed. This is responsible for the “speed dependent” and “scale dependent” hysteresis as seen in Figs. 3(a) and 3(b).
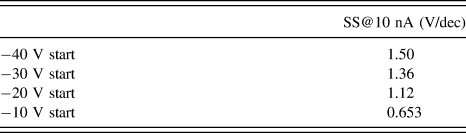
From Fig. 3(c), it is observed that the SS degrades as the DC sweeps are started at increasingly negative voltage (Table I). This observation allows one to estimate the effective density of the interface states from Reference Taur and Ning20 :
 $${\rm{SS}} = \ln \left( {10} \right)\left( {{{kT} \over q}} \right)\left[ {1 + {q \over {{C_{{\rm{ox}}}}}}\left( {\sqrt {{{{\varepsilon _{{\rm{ch}}}}{N_{\rm{a}}}} \over {4{\varphi _{\rm{B}}}}}} + q{D_{{\rm{it}}}}} \right)} \right]\quad ,$$
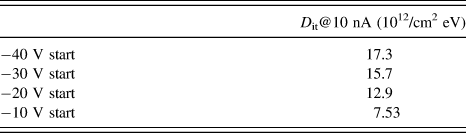
here, we neglect the effect of channel depletion capacitance on SS, as the changes in the SS value for different starting points are significantly large than the ideal value of 60 mV/dec. For Table I, the SS at the same current level (10 nA) was considered where all other conditions in the channel for different sweeping parameters were kept the same. The calculated D it results are shown in Table II. The interface traps are found to have an energy-dependent distribution; there are more interface states at higher energies. Our results are consistent with previous studies, Reference Choi, Raza, Lee, Jeon, Pezeshki, Min and Kim21 performed using optical techniques.
SS values at 10 nA channel current with different sweeping start points.

Density of interface states with different sweeping staring points.

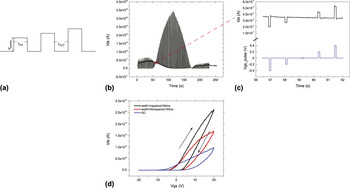
Having quantified the nature and distribution of the trap states, we now move on to the hysteresis that comes from these trap centers. To achieve this, we set up a “pulsed measurement” technique Reference Estrada, Dutta, Liao and Pop22 where the current voltage characteristic was measured using various pulse widths (t on) and pulse periods (t off) [Fig. 5(a)].
(a) The schematic of voltage pulse generation in pulsed measurement. (b) The whole I d–time curve generated by the normal pulse series. (c) Part of normal pulse series and the corresponding I d–time sweeping curves. All the peaks correspond to the voltage pulses on the gate. (d) The normal pulsed measurement IV curves, compared with DC mode. Drain voltages are all 1 V.

The real time current changes as the gate bias is swept, is shown in Figs. 5(b) and 5(c). After each pulse, a clear decay of the current is observed which corresponds to the trapping/detrapping mechanism. In Fig. 5(d), the l pulsed measurement mode results are depicted, together with the DC transfer curve in the same sweeping scale and interval (200 mV) for comparison. The time width to capture one point in DC measurement is around 100 ms, without any relaxation between 2 points. With 100 ms pulse width and 100 ms “relaxation” time, the effects of interface trapping are dramatically reduced, and at the same time the on current increases. When reducing the pulse width to 1 ms, thereby decreasing the time for trapping/detrapping, the interface effects are furthermore minimized, leading to the enhancement of channel current by nearly 4 times compared to the DC mode. 1 ms width and 100 ms periods seem to be the optimum choice. No enhancement was found with longer pulse periods within the limit of our measurement instruments. This indicates that time needed for detrapping is significantly long.
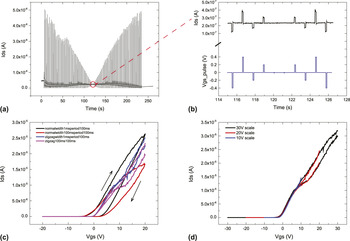
Next a “zigzag pulse series” Reference Mattmann, Roman, Helbling, Bechstein, Durrer, Pohle, Fleischer and Hierold23,Reference Liu, Qiu, Zhang, Zheng and Zhang24 was set up, in which a voltage pulse follows another one with the same amplitude but opposite direction (e.g., −20, 20, −19, 19, …, 19, −19, 20, −20 V). All the sweeping points were the same as in the previous case, but in a different sequence. The main idea here is that the opposite pulse helps the state to come to equilibrium after trapping/detrapping (compared to just putting the voltage to zero). For example, the electrons detrapped in the negative V g pulse are immediately retrapped. Those two effects will offset each other and make the system to go back to the initial state. Thus the hysteresis will nearly disappear. Figures 6(a) and 6(b) show the time domain behavior of the drain current. It is found to be nearly symmetric, especially in the low voltage region (100–150 s). Figure 6(c) shows comparison of the I d–V g behavior measured by the normal pulse mode and the zigzag pulse mode. Notably, for the zigzag mode, the hysteresis is significantly lower; in fact in the linear region (0–10 V), the hysteresis window completely disappears. Moreover, the curves with a pulse width of 1 and 100 ms nearly overlap each other. So does the curves for different scales (±30 V scale to ±10 V scale) [Fig. 6(d)]. The threshold voltage stays at around −1.5 V for all the measurements done in zigzag mode, showing a lightly n-doped MoS2 property. Thus the zigzag pulse mode enables a robust current–voltage characteristic, for the most part eliminating the deleterious effects of the trap states, revealing the intrinsic nature of the material itself. The mobility extracted from these transistors from the DC sweeps gives 1.74 cm2/(V s) for the forward sweep and 3.14 cm2/(V s) for the backward sweep. Therefore, there is almost a 100% difference between the results from two branches of the hysteresis. By contrast, mobility extracted from the zigzag pulse-mode data gives almost identical values for the two branches [5.91 cm2/(V s) for the forward sweep and 5.59 cm2/(V s) for the backward sweep]. Note that, even in presence of pulsed gating, some of the states can be filled/empty in the steady state (pulsed gating only removes the dynamic trapping/detrapping) and can adversely affect the mobility.
(a) The whole I d–time curve generated by the normal pulse series of 10 V amplitude and 200 mV interval. (b) The zigzag pulse series setup and the corresponding I d–time sweeping curves. All the peaks correspond to the voltage pulses on the gate. (c) The zigzag pulsed measurement IV result, compared with normal pulse series mode. (d) The zigzag pulsed measurement with different sweeping scales. Drain voltages are all 1 V.

In summary, we have explored the interface states in a monolayer MoS2 transistor. We have shown that the hysteresis in the DC sweeps can be exploited to quantify the nature and density of the trap states that get created at the interface due to absorption of various contaminant molecules at the ambient conditions. Such trap states severely affects the device behavior such as the ON current and mobility. We have shown that by applying carefully designed pulses to the gate, the effect of the trap states can be removed, revealing the intrinsic properties of the channel material. The techniques shown here are applicable in general to all other emerging channel materials.
ACKNOWLEDGMENTS
This work was supported in part by the AFOSR YIP #FA9550-13-l-0114, the ARO YIP # W911 NF‐13‐1‐0224 and the NSF CAREER Award No. CCF‐1149804.