


Introduction
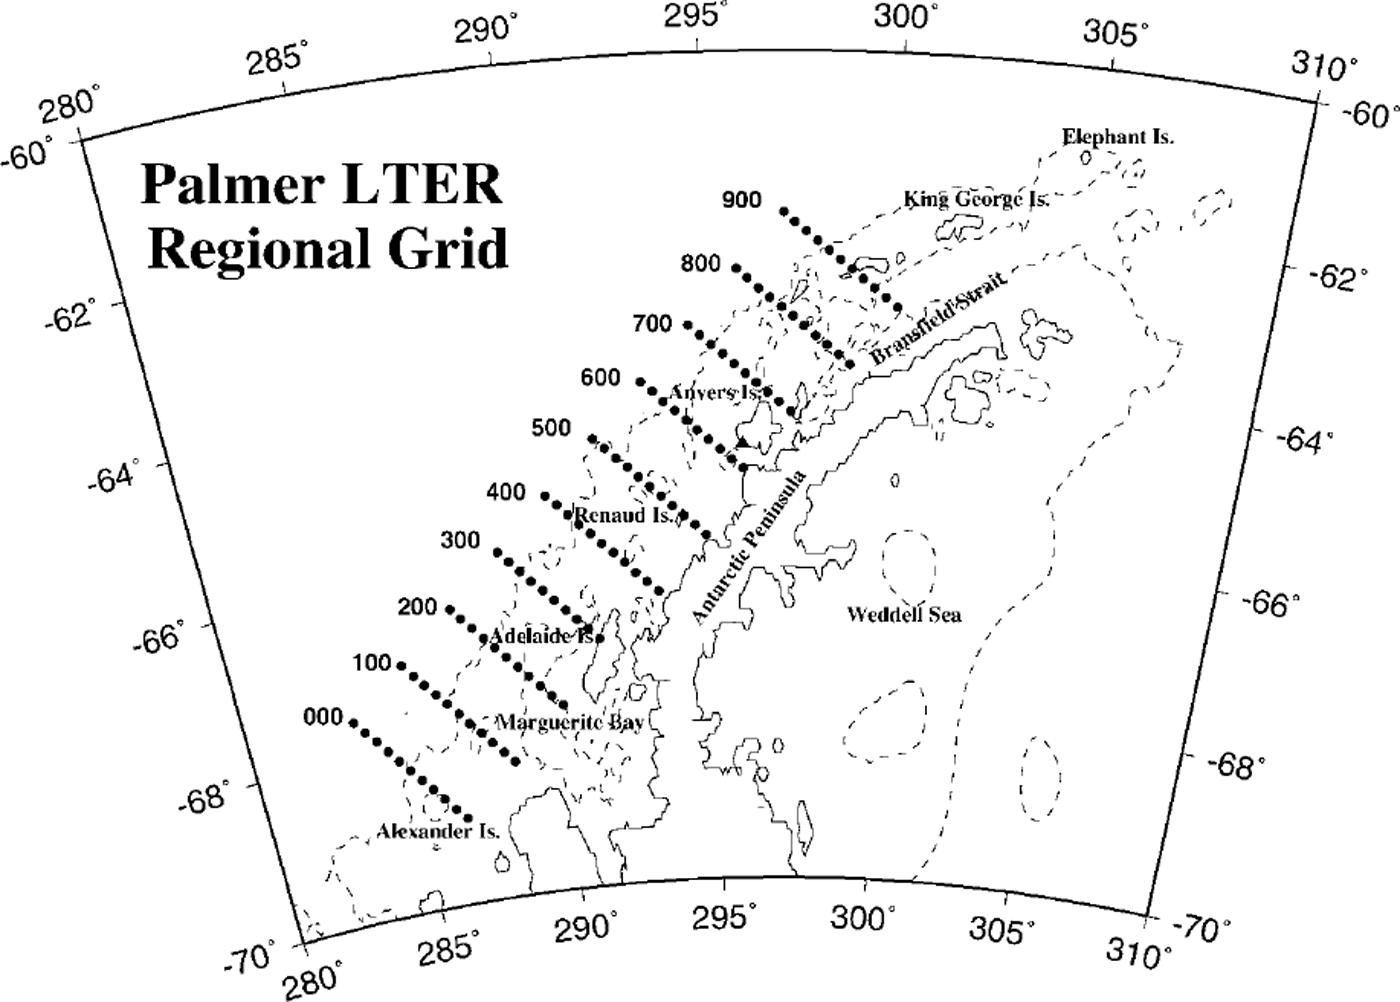
The western Antarctic Peninsula (WAP) region (Fig. 1), which is the location of the Palmer Long Term Ecological Research (Palmer LTER) project, is proving to be an exceptional area to study ecological response to climate variability (Reference Ross, Hofmann and QuetinRoss and others, 1996; Reference Smith, Stammerjohn, Baker, Ross, Hofmann and QuetinSmith and others, 1996, Reference Smith1999). Mounting evidence suggests that the Earth is experiencing a period of rapid climate change, and air-temperature records from the last half-century confirm the rapidity of change in the WAP area (Reference SansomSansom, 1989; Reference Weatherly, Walsh and ZwallyWeatherly and others, 1991; Reference KingKing, 1994; Reference StarkStark, 1994; Reference Ross, Hofmann and QuetinRoss and others, 1996; Reference Smith, Stammerjohn, Baker, Ross, Hofmann and QuetinSmith and others, 1996; Reference King and HarangozoKing and Harangozo, 1998; Reference Marshall and KingMarshall and King, 1998; Reference Van den BroekeVan den Broeke, 1998). Ecosystem research in (Reference Fraser, Trivelpiece, Ainley and TrivelpieceFraser and others, 1992; Reference Trivelpiece, Fraser, Ross, Hofmann and QuetinTrivelpiece and Fraser, 1996), and paleoecological records from (Reference EmslieEmslie, 1995; Reference Emslie, Fraser, Smith and WalkerEmslie and others, 1998), this area show ecological transitions that have occurred in response to this climate change. For example, populations of sea-ice-obligate Adéhe penguins have been declining in the WAP region in response to the warming trend observed over the last century; this warming trend is believed to be coincident with a decrease in the number of heavy sea-ice years (Reference Fraser, Trivelpiece, Ainley and TrivelpieceFraser and others, 1992; Reference SmithSmith and others, 1999). In contrast, these same studies show that populations of sea-ice-intolerant chinstrap penguins have been increasing.
Map of the wap region, showing the palmer LTER regional sampling grid. cardinal lines are spaced every 100 km along the peninsula, and stations every 20 km on-/offshore along a line. the dashed line is the 500 m contour, indicating the location of the shelf break.
Air-temperature-sea-ice linkages appear to be very strong in the WAP region (Reference JackaJacka, 1990; Reference Jacka, Budd, Weller, Wilson and SeverinJacka and Budd, 1991; Reference Weatherly, Walsh and ZwallyWeatherly and others, 1991; Reference KingKing, 1994; Reference Smith, Stammerjohn, Baker, Ross, Hofmann and QuetinSmith and others, 1996), and in turn the ecological influence of sea ice has been demonstrated at all trophic levels including: phytoplankton, the microbial community, the benthic community, krill, zooplankton and fish, sea birds and marine mammals (see Reference Ross, Hofmann and QuetinRoss and others, 1996, and references therein). Thus, the WAP region is ideally suited for studying the variability of ecosystem response to changes in physical forcing over a range of temporal scales. In the following we update both air-temperature and sea-ice records for the WAP region in order to place ecological and environmental observations from the past few seasons into a longer-term context. We show the long-term trends, the changes in variability and the increased influence of maritime, as contrasted with continental, influences on the WAP region and discuss the broad implications of these changes to the ecosystem. In particular, these observations provide the larger seasonal and regional context of temperature and sea-ice variability with which to consider snow and sea-ice observations from a recent early-winter (June-July 1999) Palmer LTER sea-ice cruise (those results will be published elsewhere).
Air Temperature
The British Antarctic Survey (BAS) has a long and distinguished history of scientific research in the Antarctic, and its meteorological observations are especially useful because of their length, consistency and quality control. Here we update and augment an earlier study (Reference Smith, Stammerjohn, Baker, Ross, Hofmann and QuetinSmith and others, 1996) with the addition of Faraday/Vernadsky data for the 1990s. Figure 2 shows the Faraday/Vernadsky annual average air temperatures from 1945 to 1999 (N = 55). The solid line is the least-squares regression line, which shows a statistically significant warming trend over the last 55 years. The dotted lines indicate the ±1 standard deviation (s.d.) from the regression line and have been used as a designator for defining "high" (>1 s.d.) or "low" (<1 s.d.) temperature years.
Faraday/vernadsky (65° 15 s, 64°15’W) annual average air temperatures, 1945−99 (N= 55). the solid line is the least-squares regression line with a gradient of 0.052˚c a−1, and the dotted lines indicate ±1 s.d. from this line. a linear regression model shows the warming trend over this period to be significant at greater than the 99 % confidence level. the shorter rothera (67°34’S, 68°08’ W) annual temperature is shown dotted. temperature data for faraday/vernadsky and rothera kindly supplied by the bas.
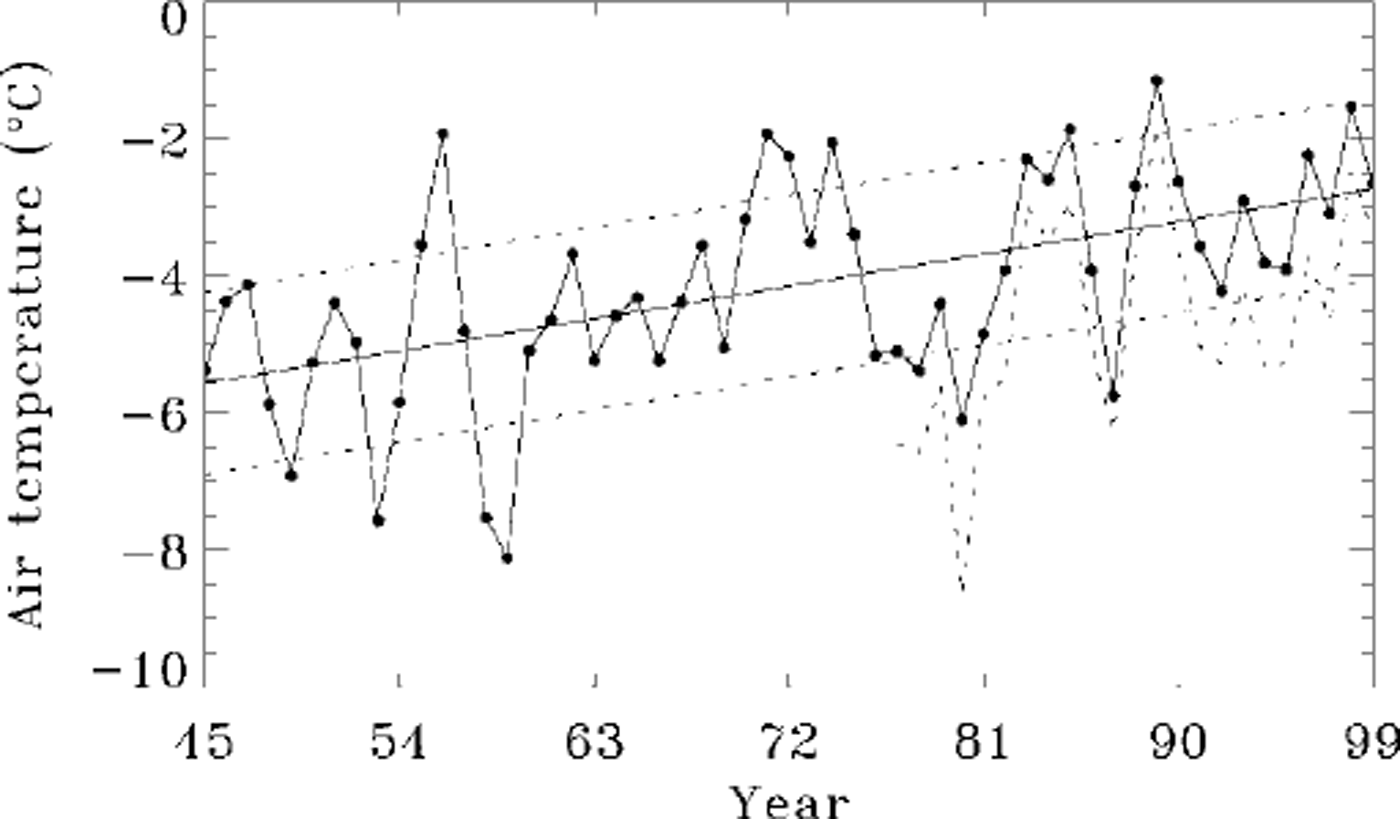
Accounting for serial correlation present in this 55 year record, we estimate the effective number of independent observations to be N* = 28.9 (for method, see Reference Smith, Stammerjohn, Baker, Ross, Hofmann and QuetinSmith and others, 1996), and the trend is statistically significant at a > 9 9% confidence level. These annual results are further supported by a monthly and seasonal analysis (see table 1 in Reference Smith, Stammerjohn, Baker, Ross, Hofmann and QuetinSmith and others, 1996) which shows that the warming trend in Faraday/Vernadsky air temperatures is strongest in mid-winter months, and peaks in June at 0.11 °C a−1, representing roughly a 6°C increase in June temperatures over the 55 year record. Spring and summer trends are smaller. The record from Rothera (further south on the WAP) shows a strong temporal coherence (Reference KingKing, 1994; Reference Smith, Stammerjohn, Baker, Ross, Hofmann and QuetinSmith and others, 1996), with mean annual temperatures averaging a few degrees cooler than Faraday/Vernadsky but displaying similar trends.
The annual progression of temperatures and the amount of variability associated with those temperatures have changed over the last half-century. Visual inspection of Figure 2 shows that the last two decades (1980s and 1990s) were warmer than the previous several decades. The seasonal variability of this change is illustrated in Figure 3a, where we have plotted the annual curves of monthly mean air temperature for Faraday/Vernadsky for: the full period of the instrument record March 1944−December 1999 (bold line with solid dots), the early period March 1944−December 1977 (thin solid line), the period January 1978− December 1989 (hereafter called the 1980s; dotted line), and the periodjanuary 1990−December 1999 (the 1990s; dashed line). The curves in Figure 3a also illustrate that the largest temperature changes have occurred in winter June-August), with relatively less change in spring (September-December).
(a) Annual curves of monthly mean surface air temperatures for faraday/vernadsky for: the total period of the instrument record (march 1944−december 1999; bold line with solid dots), the early decades (march 1944−december 1977; thin line), the decade of the 1980s (january 1978−december 1989; dotted line) and the decade of the 1990s (january 1990−december 1999; dashed line), ( b) annual curves of monthly mean sea-ice extent for the palmer lter region for: the full period of satellite passive-microwave data ( october 1978−december 1999; bold line with solid dots), the decade of the 1980s (october 1978−december 1989; dotted line) and the decade of the 1990s (january 1990−december 1999; dashed line). sea-ice data supplied by the U.S. .national snow and ice data center, (c) standard deviations of the monthly mean surface air temperatures for the same periods shown in (a), ( d) standard deviates of the monthly mean sea-ice extent for the periods shown in (b).
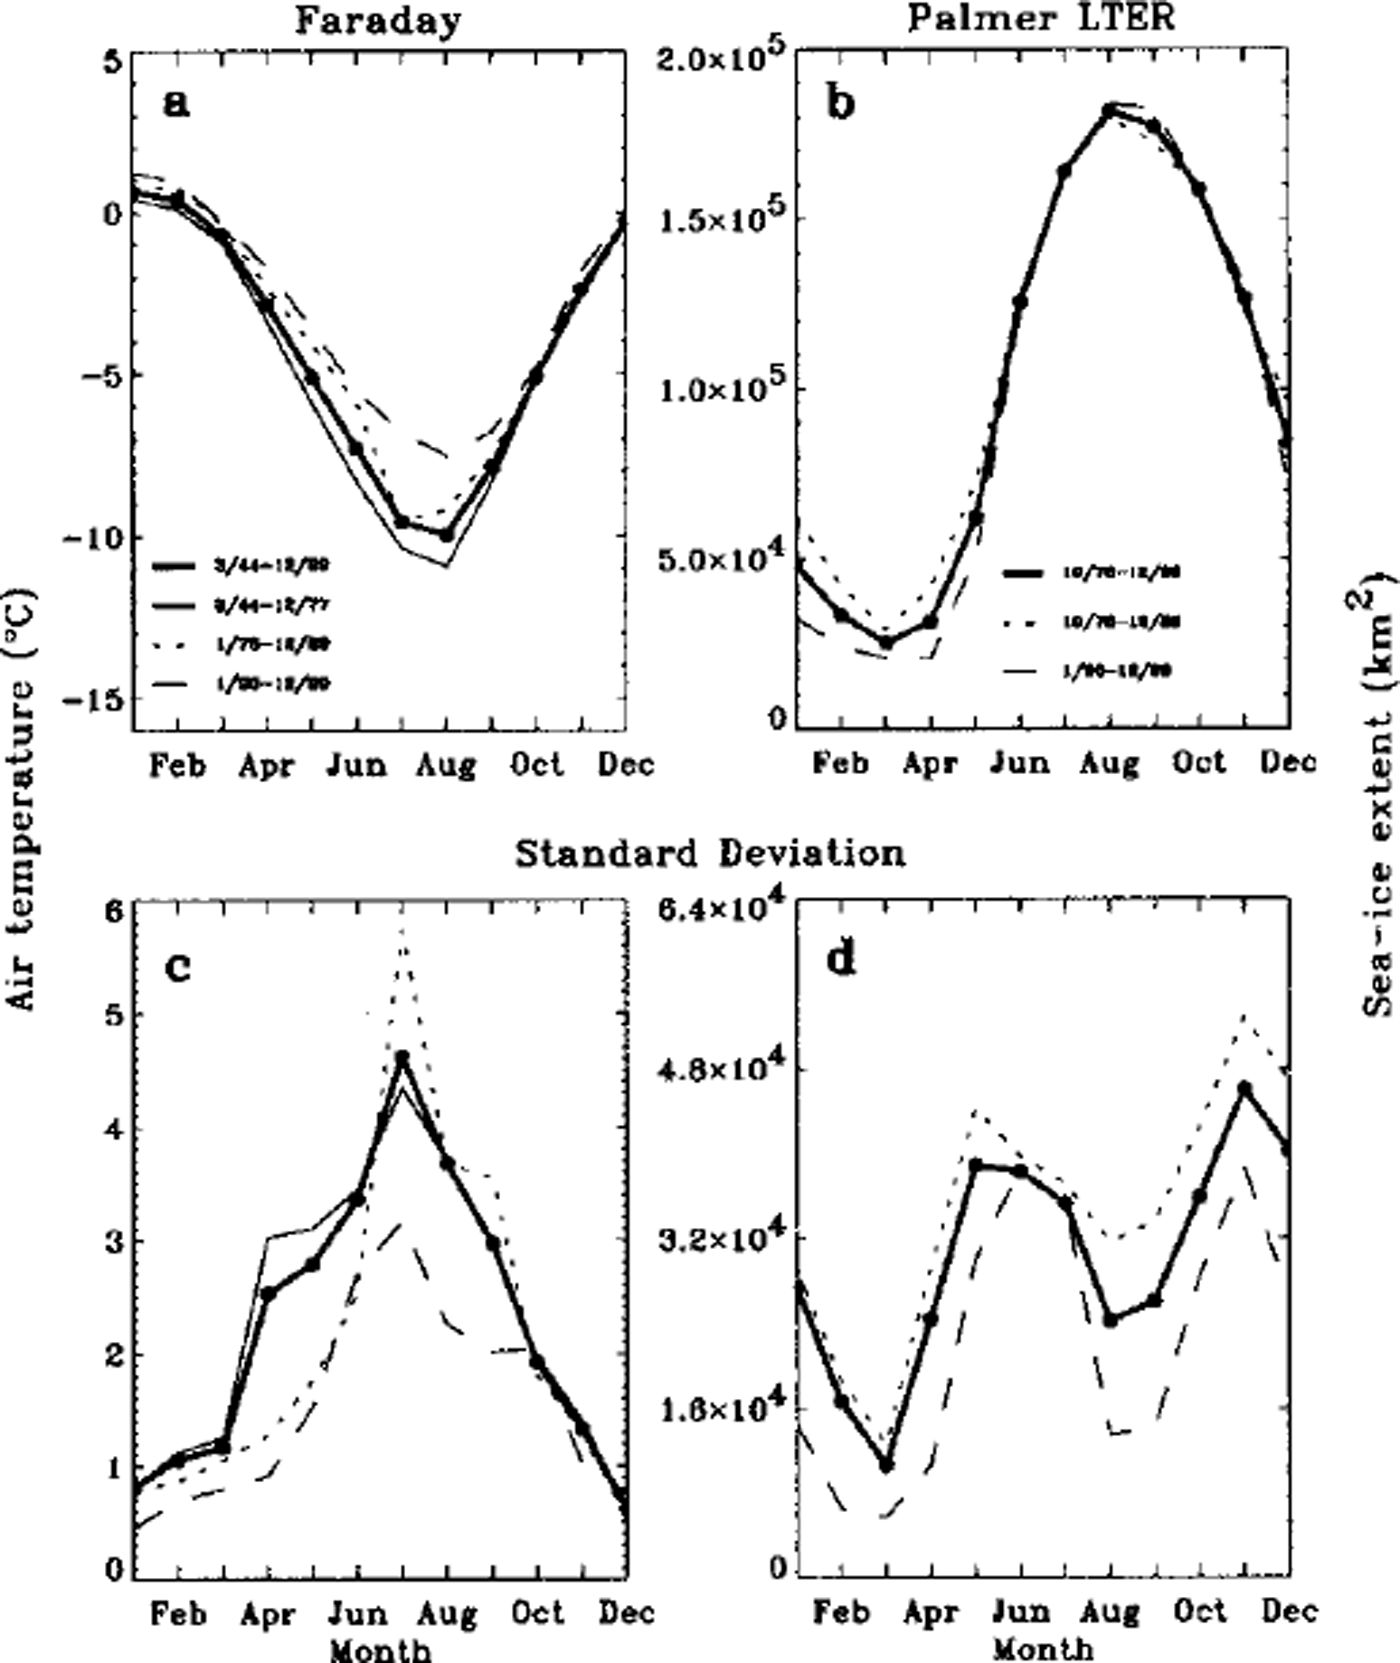
The Faraday/Vernadsky annual cycle is representative of annual temperature curves at this latitude (65° S): a maximum in January and a minimum in August. In contrast, for stations on the Antarctic plateau, Reference Van LoonVan Loon (1967) identified the"coreless winter", where the temperature minimum appears in early winter and remains at this minimum throughout the winter period. The coastal zone, however, is characterized by a delayed annual minimum (which typically appears in early spring), and Van Loon suggested that this seasonal temperature cycle is associated with enhanced meridional flow from middle to high latitudes during winter. Indeed, more recent work by Reference MeehlMeehl (1991) confirms that transient eddy heat flux likely contributes to this seasonal cycle in the Antarctic coastal zone. King and co-workers (Reference KingKing, 1994; Reference King and HarangozoKing and Harangozo, 1998; Reference Marshall and KingMarshall and King, 1998) also show a strong correlation between surface air temperature and meridional sea-level pressure indices calculated for the WAP area. Their results demonstrate that increased boundary-layer winds, flowing from the northwest sector toward the WAP, are associated with increased cyclonic activity and warm-air advection from lower latitudes. Consequently, the increase in surface temperatures associated with the increase in northerly winds produces a more maritime-like (warm, moist) environment, as opposed to colder temperatures from southerly winds that produce continental (cold, dry) conditions.
Figure 3c shows the standard deviations of the monthly mean surface air temperatures shown in Figure 3a. Several observations of air-temperature variability can be made about this figure. First, there is significantly higher variation from May through September during all periods. The increase in fall and winter variability has been attributed to the high variability of year-to-year sea-ice coverage and the corresponding increased continental influence when an extensive sea-ice cover exists (Reference Weatherly, Walsh and ZwallyWeatherly and others, 1991; Reference KingKing, 1994; Reference Smith, Stammerjohn, Baker, Ross, Hofmann and QuetinSmith and others, 1996). This is a consequence of the north-south gradient in both sea ice and temperature along the peninsula, which is linked to the shifting balance between maritime and continental climatic influences. Second, during the summer, when ice-free conditions are increasingly typical and maritime conditions prevail, there is relatively lower variability in air temperatures. Also, it has been shown (Reference Smith, Stammerjohn, Baker, Ross, Hofmann and QuetinSmith and others, 1996) that the variance at the more southerly stations along the WAP is larger than at more northerly stations, and this higher variance has been attributed to the more frequent influence of continental climatic conditions. Third, the high mid-winter (July) variation during the 1980s is caused by greater extremes between warm and cold winters. In fact, the 1980s was characterized by a several-year persistence in high and low anomalies, whereby several years of high temperatures (and sea ice as discussed below) were followed by several years of low temperatures. This persistence is not evident in the 1990s. Consequently, there is significantly lower variation (April-October) during the 1990s compared to either the 1980s or the earlier decades. This is consistent with an increasing maritime influence, where temperatures are moderated by the open ocean. Overall, these changes in the annual progression of temperature and the amount of variability associated with those temperatures suggest a climate shift, whereby continental influence is giving way to an increasing maritime influence along the WAP.
Sea Ice
Also shown in Figure 3 are the mean annual cycles of sea-ice extent (Fig. 3b) as well as the standard deviations of the monthly means (Fig. 3d). Means for the full period of the passive-microwave satellite record (1978−99, solid line) as well as for the periods of the 1980s (dotted line) and 1990s (dashed line) are included. Several observations can be made in reference to Figure 3. First, the winter seasonal cycle of air temperature (Fig. 3a) is inversely related to the winter seasonal cycle of sea-ice extent (Fig. 3b), but the summer sea-ice extent minimum lags the summer air-temperature maximum by 2−3 months. Second, summer (January-March) and fall (April-May) sea-ice extent in the 1990s is below that for the 1980s. Third, winter (August-September) follows an opposite pattern, with the 1990s showing slightly more sea ice on average than the 1980s. Fourth, the later advance and slightly earlier retreat of sea ice in the 1990s (as compared with the 1980s) translates into a shorter sea-ice season by roughly 2 weeks. The variance also changed (Fig. 3d): the 1980s, in contrast to the 1990s, have higher variance (due to the seasonal persistence of anomalies), especially from April to September.
Within the period of satellite multi-channel microwave records (1978 to present), anomalies in WAP air temperature and sea-ice extent (Reference Weatherly, Walsh and ZwallyWeatherly and others, 1991; Reference KingKing, 1994; Reference Smith, Stammerjohn, Baker, Ross, Hofmann and QuetinSmith and others, 1996) have been shown to be significantly anticorrelated. Figure 4a shows monthly standard deviates of Faraday/Vernadsky air temperature vs Palmer LTER sea-ice extent smoothed with a 5 month running average. Standard deviates are the normalized anomalies which were determined by dividing the anomaly (for the month and year in question) by the standard deviation of the anomaly (for the month in question). However complex the mechanisms linking air temperature and sea ice, these data show that within the WAP and during this period these two parameters behave almost as mirror images. During the 1980s, when anomalies in sea-ice extent showed strong persistence, so did air temperature, but during the 1990s this persistence gave way to greater month-to-month variability in both parameters.
Monthly standard deviates (smoothed by a 5 month running mean) from january 1979 to december 1999 of: (a) faraday/ vernadsky air temperature (dotted line) and palmer lter sea-ice extent (solid line); (b) palmer LTER sea-ice extent (solid line) and SOI (dotted line); and (c) faraday/ vernadsky air temperature (solid line) and SOI (dotted line ).the SOI data were obtained digitally ( http://www.cpc.ncep.noaa.gov/data/indices/soi) from the climate prediction center (department of commerce, U.S. national oceanic and atmospheric administration).
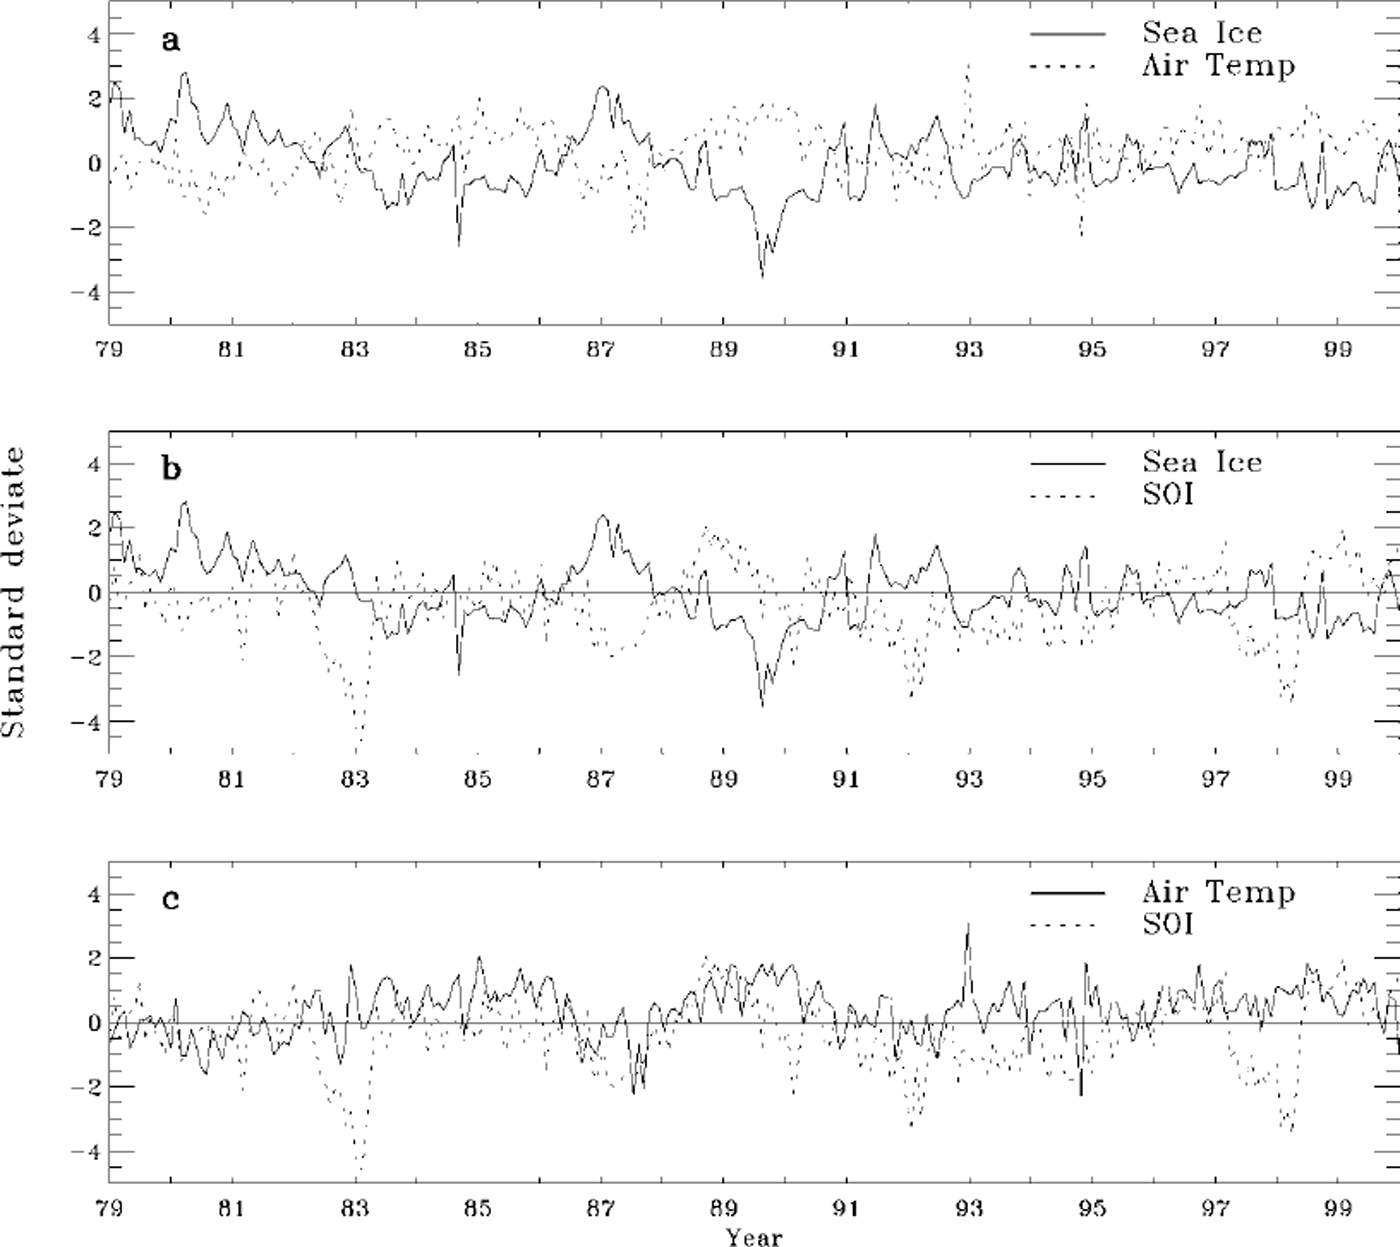
Monthly standard deviates of Palmer LTER sea-ice extent and Faraday/Vernadsky air temperature vs the Southern Oscillation index (SOI) (which is determined by the standardized sea-level pressure difference between Tahiti and Darwin, Australia) are shown in Figure 4b and c, respectively. Figure 4b shows an anticorrelation between Palmer LTER sea-ice extent and SOI, as expected based on the relationship shown in Figure 4a. Figure 4c shows a correlation between Faraday/Vernadsky air temperature and SOI. We have discussed this relationship previously (Reference Smith, Stammerjohn, Baker, Ross, Hofmann and QuetinSmith and others, 1996) and include an updated figure here to show that the relationships found earlier continue to hold throughout the 1990s. This is in contrast to relationships found between precipitation and SOI. Unlike the consistent relationship observed for air temperature and SOI, Reference Cullather, Bromwich and van WoertCullather and others (1996) first found a positive correlation between South Pacific precipitation (120−180 W) and SOI from 1980 to 1990, but after 1990 the correlation switches to negative. Nevertheless, these relationships in general support the idea of possible linkages between sea ice, cyclonic activity and global teleconnections (Reference Mo and WhiteMo and White, 1985; Reference Van Loon and SheaVan Loon and Shea, 1985a, Reference Van Loon and Sheab; Reference CarletonCarleton, 1988; Reference White and PetersonWhite and Peterson, 1996; Reference White, Chen and PetersonWhite and others, 1998; Reference Yuan and MartinsonYuan and Martinson, 2000). In particular, the semi-annual oscillation (SAO: the twice-yearly contraction and expansion of the atmospheric low-pressure trough around Antarctica) is an important component of the Southern Hemisphere climate and has been shown to be linked to variability in air temperature and cyclonic activity in the WAP as well as elsewhere in the Antarctic (Reference Van LoonVan Loon, 1967; Reference MeehlMeehl, 1991; Reference Van den BroekeVan den Broeke, 2000).
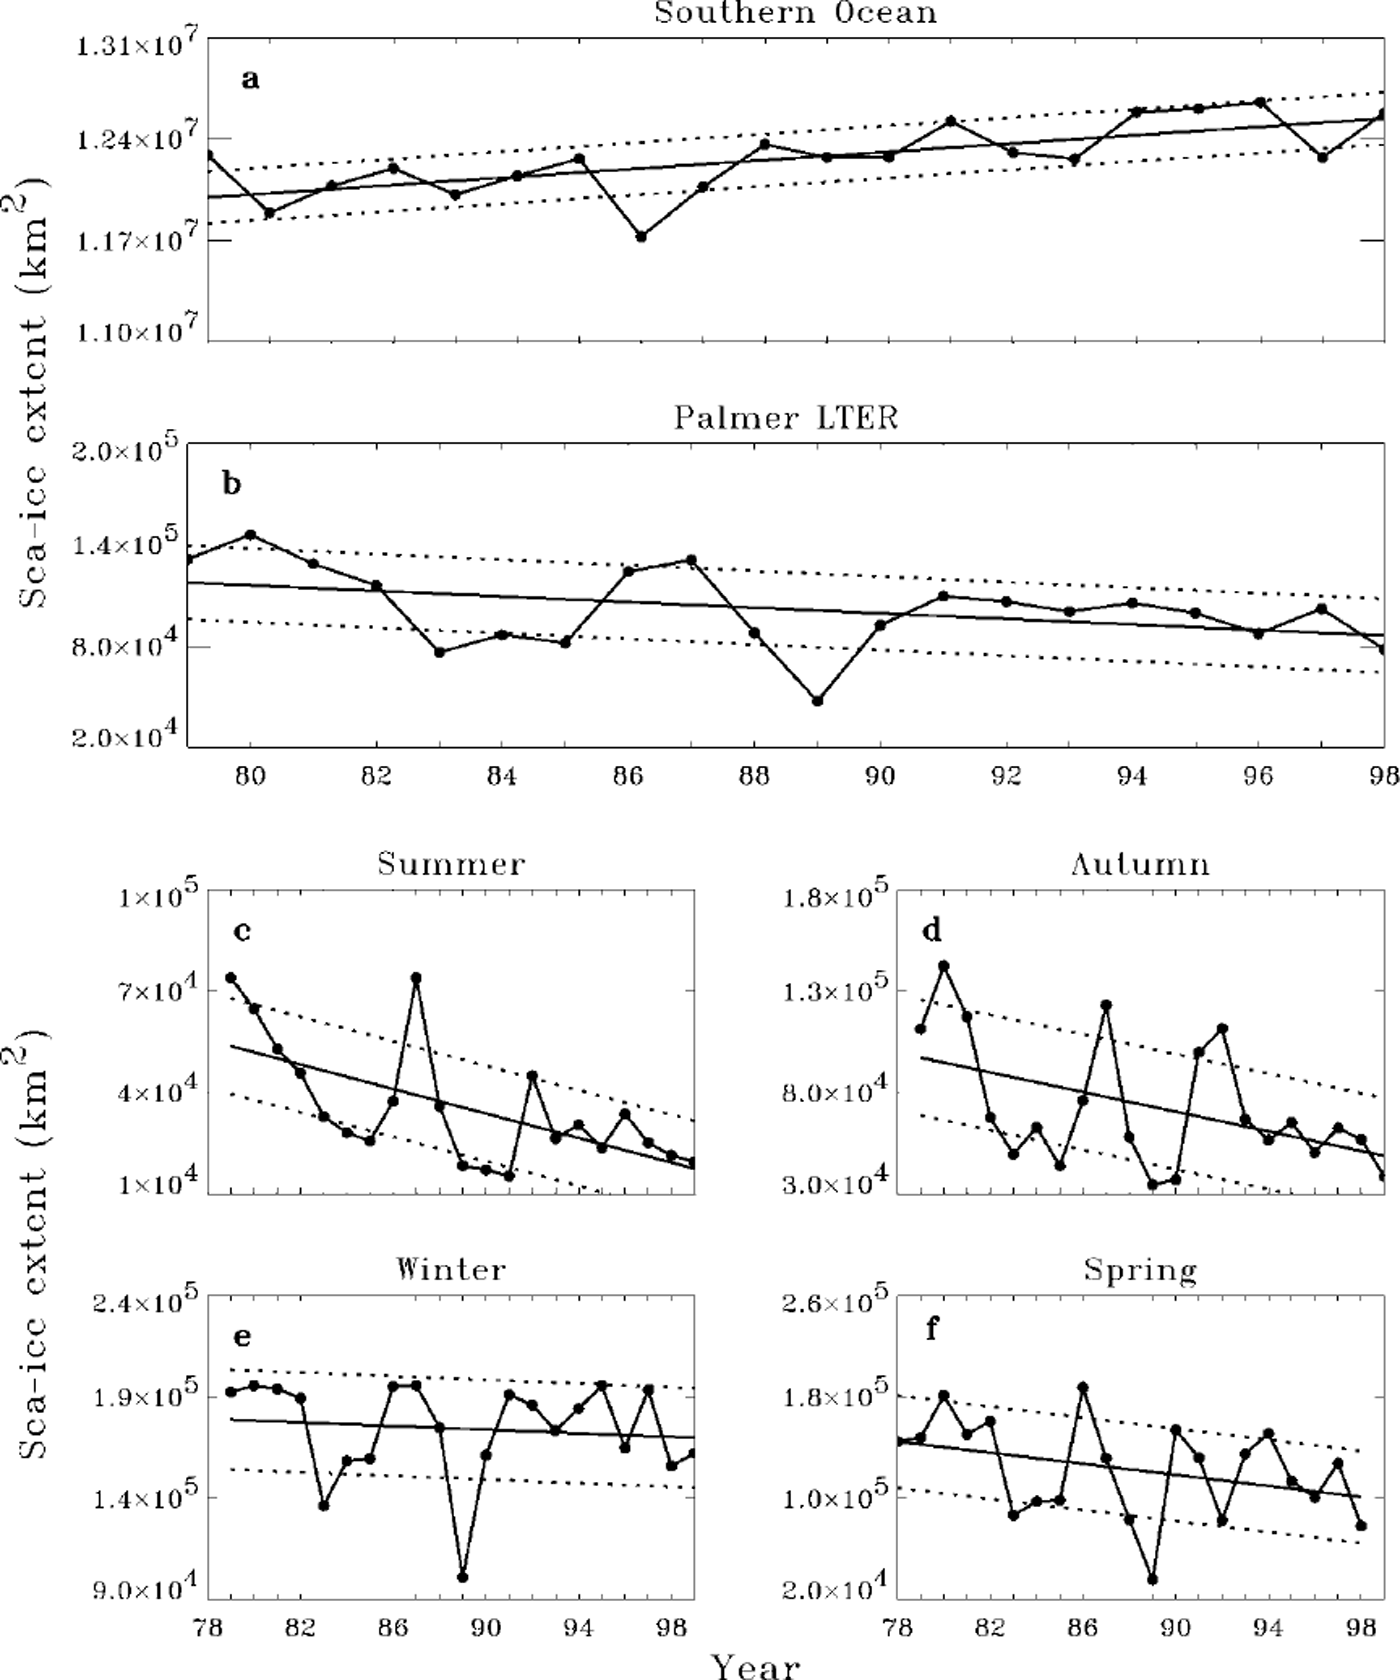
In contrast to the Southern Ocean as a whole (Fig. 5a), the annual mean sea-ice extent has trended down in the Palmer LTER region as shown in Figure 5b (Reference Stammerjohn and SmithStammerjohn and Smith, 1997). Figure 5c-f separate the annual mean into the four seasons to illustrate that the annual trend in Palmer LTER sea-ice extent is due mostly to the decreasing trend in summer sea ice (as was inferred from Figure 3). Given the relatively short satellite record and high interannual variability, these trends are not statistically significant. However, the trends are suggestive, and less summer sea ice is consistent with increased maritime influence (Fig. 3) in the WAP area. Figure 5b also illustrates the change in seasonal persistence when comparing the 1980s to the 1990s. First, note that during the 1980s over half the annual means are greater than ±1 s.d. from the regression line, in contrast to the 1990s where all the annual means are within ±1 s.d. Second, during the earlier decade the periods of anomalously high (1979−81 and 1986−87) and low (1983−85 and 1988−90) sea-ice extents stand out clearly. Ecosystems are sure to respond to these anomalies, and researchers have capitalized on the distinct ecological differences between high and low sea-ice years to test the interrelationships between organisms and sea ice (Reference Siegel and LoebSiegel and Loeb, 1995; Quetin and others, 1996; Trivelpiece and Fraser, 1996; Reference Smith, Baker and StammerjohnSmith and others, 1998). Third, during the 1990s, anomalies generally have been lower, and their timing more seasonally erratic, than in the earlier decade. Indeed, this shift in the broad anomaly pattern underscores, especially from the ecological perspective, the need to examine and quantitatively describe the seasonal variability of the sea-ice habitat (Reference Smith, Baker and StammerjohnSmith and others, 1998).
Mean annual sea-ice extent for the southern ocean (a) and the palmer LTER region (b). see stammerjohn and smith (1997) for details on the satellite data used. mean annual sea-ice extent for the palmer LTER region for summer (c), autumn (d), winter (e) and spring (f) are shown to illustrate that the annual trend in the palmer LTER region is due mostly to the decreasing sea-ice trend during summer.
Early Winter 1999
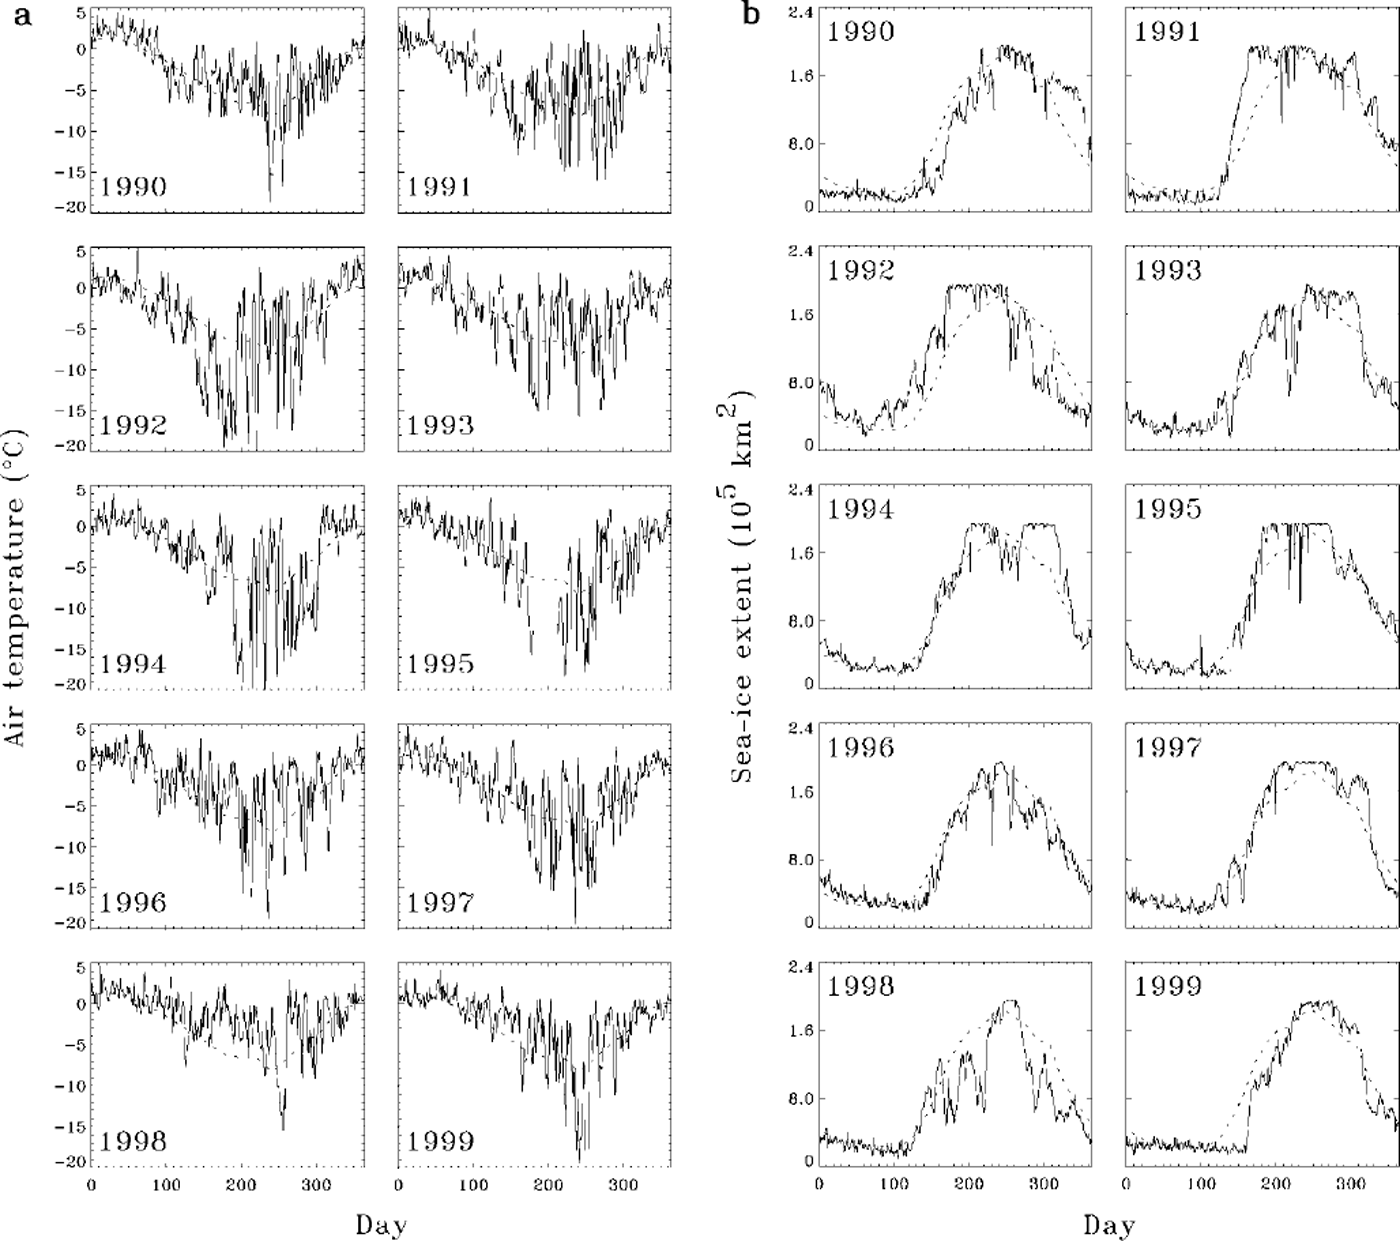
Observations from a single cruise can be significantly biased unless the interrelated space/time conditions surrounding these observations are considered. For example, the above discussion provides a broader context within which to examine observations from a recent sea-ice cruise along the WAP in June/July 1999 (NBP99−06) (Smith and Stammerjohn, in press). Palmer LTER sea-ice extent and Faraday/Vernadsky air temperature are plotted for the last decade in Figure 6. Palmer LTER sea-ice extent is determined for the area enclosed by the Palmer LTER regional grid shown in Figure 1. In winters, this entire study area can be covered by sea ice, which explains the flat maximum seen for some years in Figure 6b. The thin dashed lines represent the daily means, and the bold lines are the individual daily data. Several observations can be made with respect to temperature and sea ice during the 1990s. First, to place the more recent observations within the context of the past half-century, it is important to recall that this last decade is the warmest for the entire period of the instrument record (Fig. 2). Second, the strong inverse relationship between air temperature and sea-ice extent continues to be clearly evident, and as contrasted with earlier periods, departures from the mean during this decade are relatively low. Third, the last two winter seasons in the WAP have been distinguished by above-average temperatures throughout the summer, fall and early winter (January-July) with corresponding low sea ice. In both seasons sea-ice advance was late (August) followed by a late-winter maximum. In 1998, there followed a rapid retreat so that the winter maximum was short and spring sea-ice extent (OND) was well below average. In 1999, however, winter temperatures were colder and the late-winter maximum persisted longer into spring. Thus, the broader context presented above indicates that the Palmer LTER June-July 1999 sea-ice cruise occurred in a year that was distinguished by warm early-winter air temperatures and a late sea-ice advance. Though the sampling on this cruise took place during an early winter that had below mean sea-ice extent, after the cruise, there was above mean sea-ice extent from mid-August to early November. Therefore the physical, biological and chemical observations made during the Palmer LTER June-July 1999 cruise will have to acknowledge these contrasting early- and late-winter anomaly patterns before any conclusions are drawn about the state of the marine ecosystem in 1999.
Annual curve of daily faraday/vernadsky air temperature (a) and palmer LTER sea-ice extent (b) for the period 1990−99. the thin dashed line gives the 10 year monthly mean.
Discussion
Reference King and HarangozoKing and Harangozo (1998) have discussed the trends in climate change in the WAP and identified two possible causes for the interannual variability in the temperature record: changes in the atmospheric-ice-ocean interactions, and variability in maritime vs continental control on climate. The increased maritime influence during recent decades is relatively clear from the data, whereas the mechanisms underlying atmospheric-ice-ocean interactions and the causative factors involved remain to be elucidated. Nevertheless, it can be hypothesized that maritime conditions are an increasingly likely climatic regime for the WAP region and that the marine ecosystem has responded, and will continue to respond, accordingly.
The life histories of various polar marine species are synchronized with the seasonality of sea ice (Reference SmithSmith and others, 1995; Reference Ross, Hofmann and QuetinRoss and others, 1996). For example, Reference Ackley and SullivanAckley and Sullivan (1994) have proposed a conceptual model of the seasonal cycle of sea ice: with formation during autumn with the possible entrainment of phytoplankton as a seed population, possible growth during winter, and sea-ice decay during spring with potential bloom inoculum and sedimentation of particulate organic matter into the water column. Palmer LTER multi-year observations on phytoplankton biomass and production variability provide evidence for this hypothesis, in that several factors controlling abundance and distribution of phytoplankton biomass, often dominated by diatom blooms, have been shown to be modulated by sea ice (Reference Smith, Baker and StammerjohnSmith and others, 1998, Reference Smith, Baker, Dierssen, Stammerjohn and Vernet2001). Further up the food web, Antarctic krill (Euphausia superba), a major herbivore for the transfer of energy within the Antarctic marine ecosystem, is closely coupled to sea ice during various periods of its annual life cycle (Reference Ross, Hofmann and QuetinQuetin and others, 1996). Recent evidence supports the hypothesis that maximum krill-growth rates are only possible during diatom blooms and that production in Antarctic krill is limited by both food quantity and quality (Reference Ross, Quetin, Baker, Vernet and SmithRoss and others, 2000), thus showing linkages between sea ice, phytoplankton and krill. For higher trophic levels, variability in sea-ice concentrations can result in variability in habitat and foraging area, as well as distribution and abundance of food resources. Thus, the magnitude and timing of sea ice has both direct and indirect effects at all trophic levels.
Furthermore, sea ice is a complex habitat, exhibiting various physiochemical and biological characteristics, and sea-ice biological communities respond to distinct microenvironments and go through various stages of succession during the growth, evolution and decay of sea ice (Reference Dieckmann, Spindler, Lange, Ackley and EickenDieckmann and others, 1991; Reference AckleyAckley, 1996). In particular, these authors have noted that there is a strong interaction between physical sea-ice processes and sea-ice biota, and they describe the marked differences between various sea-ice habitats and the biological communities that develop within them. With respect to these various sea-ice habitats, one can infer that, with increasing maritime influence and a corresponding increase in atmospheric synoptic activity, the dynamical growth process (frazil-pancake) and thickening (rafting and ridging) of sea ice may become more prevalent and may form a distinct sea-ice habitat not previously described. Furthermore, given the trends discussed herein, this potential change in habitat may have profound long-term consequences for the marine ecosystem in the WAP region.
The observations discussed above lead to several conclusions:
Faraday/Vernadsky air temperature from 1945 to the present indicates a statistically significant warming trend in the WAP region. However, during the 1990s the variance of wintertime temperatures has decreased and the month-to-month persistence of high anomalies that was observed in the 1980s is less in the 1990s.
Increased air temperature within the WAP is associated (statistically) with decreased sea-ice extent, and, as with temperature, the persistence of high monthly anomalies in the 1980s has given way to less persistence, and therefore more season-to-season variability, in the 1990s.
These observations suggest that the balance between contrasting maritime and continental climatic regimes within the WAP region has tipped toward increased maritime influence during the 1990s. These changes are related to an increase in cyclonic activity and boundary-layer winds from the northwest, with associated warm, moist air advection from lower latitudes into the WAP region.
The consequences of this climatic shift on sea-ice growth processes, including the chemical and biological processes associated with the development of the sea-ice cover, may be profound for the marine ecology of the region.
Observations from a single cruise or field season need to consider the higher season-to-season variability in anomaly patterns that has been observed in sea-ice extent for the WAP region during the 1990s.
Acknowledgements
This work was supported by the U.S. National Science Foundation, Office of Polar Programs grant OPP-9632763 (R.C.S.) and by NASA grant NAG5−4126 (R.C.S.). This is Palmer LTER contribution No. 199.



