INTRODUCTION
Food insecurity and land degradation are intrinsically linked and necessitate that smallholder farmers in less developed countries, like Ethiopia, sacrifice long-term livelihood goals to meet immediate food production needs. However, farmers' decisions on choice of enterprise are constrained by poverty, limited access to technologies, lack of stable markets and weak institutional capacity to respond to environmental and market shocks.
The prevalence of stunting of children in Ethiopia is the third highest in the world after Bangladesh and Mauritania (UNICEF, 1999). The most important documented forms of malnutrition are protein, Vitamin A, calcium and zinc (Kaluski et al., Reference Kaluski, Einat-Ophir and Amede2002). This malnutrition could be reversed through application of micronutrients to food crops, selection of crop species and/or varieties with high micronutrient content or use of indigenous nutrient dense crops. Household nutrition could also be improved by enhancing soil fertility status and integrating germplasm with high nutrient acquisition or through changing the existing production systems (Amede et al., Reference Amede, Stroud and Aune2004; McIntyre et al., Reference McIntyre, Bouldin, Urey and Kizito2001).
Optimization and trade-off models have been used to identify alternative crop–livestock production options to achieve household food and nutrition security by changing crop combinations and reallocating land resources to high-yielding and nutritious crops (Zingore et al., Reference Zingore, Gonzalez-Estrada, Delve, Herrero, Dimes and Giller2007). This strategy demands a thorough analysis of system components, including understanding current practices, social preferences, identification of nutrients in excess or in deficit, and modification of the cropping strategy to fulfil the household nutritional demands. Earlier work in Uganda showed that improved nutrition of the banana cropping system could be achieved through a 69% decrease in land devoted to banana (Musa sapientum), with a 100% and 600% increase in maize (Zea mays) and common bean (Phaseolus vulgaris) areas respectively (McIntyre et al., Reference McIntyre, Bouldin, Urey and Kizito2001). Similarly, food security in barley-based systems of Ethiopia could be achieved by reducing the barley (Hordeum vulgare) area by 50% and expanding enset (Enset ventricosum), kale (Brassica oleracea) and faba beans (Vicia faba) by 25, 18 and 16% respectively (Amede et al., Reference Amede, Stroud and Aune2004). In situations where farmers are keen to exploit emerging market opportunities, while producing enough food, there is also a need to develop a responsive farm model that encompasses both nutrition and cash generation options and that can respond to trade-offs in terms of livestock feed availability and resource allocation.
As a system intensifies, objectives of environmental protection are commonly undermined, particularly in subsistence systems where expected financial returns do not necessarily lead to food security and improved livelihoods. Therefore, any apparent modification of land use, particularly a change in the current cropping system, should value its direct or indirect implications on other system components (Gregory et al., Reference Gregory, Ingram, Anderson, Betts and Brovkin2002). Without giving attention to rates of soil erosion, crop intensification will result in decline in land productivity over time. Moreover, changing the plot size of one crop and reallocating to another may also have a practical implication on soil erosion as the change in crop type may affect soil movement, soil water infiltration, run-off and evapo-transpiration (Roggero and Toderi, 2000). Similarly, in crop–livestock mixed farming systems of the Ethiopian highlands, farmers are considering both crop and livestock subsystems when selecting crop varieties and other interventions. Crop residue is an important input for the livestock subsystem, while the livestock subsector contributes to the crop sector in the form of draught power and nutrient recycling through manure production. Therefore, a change in proportions of the crop species or varieties will affect the amount and quality of animal feed, which will in turn affect crop–livestock integration. Intensification through crop reallocation is also likely to contribute to changes in the timing, frequency and duration of water flows at farm and higher scales (Gregory et al., Reference Gregory, Ingram, Anderson, Betts and Brovkin2002). Therefore, any attempt to modify a cropping system needs to monitor crop water requirements and its implication for water resources at farm and higher levels.
The objectives of this study were therefore to: (i) characterize the current production system of various social groups in terms of human nutrition and income; (ii) develop cropping strategies that can improve cash income and household nutritional quality; and (iii) establish the implications of the change in cropping systems on other system components including soil erosion, livestock feed and crop water use at farm and higher levels.
MATERIALS AND METHODS
Site description
The research site at Gununo is located in the southwestern Ethiopian highlands (37°39′E and 6°56′N) at 1880–1960 m asl. The farming system is characterized by a multiple-cropping system with diverse annual and perennial crops and is in one of the most populated districts in the country (>400 people km−2), with average landholdings <0.5 ha per household. Rainfall is bimodal, with a short rainy season (belg) from March to June and the main rainy season (meher) from July to October, with mean annual rainfall of 1300 mm and an average temperature of 19.5 °C. The dominant soils are deep Eutric Nitisols, phosphorus-fixing and acidic in nature (Amede et al., Reference Amede, Belachew and Geta2001) and are inherently low in nitrogen and phosphorus.
Data collection
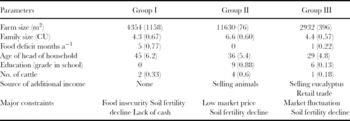
The African Highlands Initiative and the Areka research centre have been conducting participatory research on natural resource management and participatory technology development in Gununo since 1997. Three representative social groups were identified by the community (Table 1):
• Group I are currently food insecure and expect food aid to cover the food deficit period.
• Group II can produce enough food to cover household demands but lack cash.
• Group III are not producing enough food from their own farms but are food secure through off-farm activities.
Characterization of representative households in different production objective scenarios. Numbers in brackets indicate standard deviation.

CU: consumption unit.
A household survey was conducted over four years (2000–2003) covering eight farmers in each of the three groups. The major household data collected was: size of landholding, household family composition by age and sex, crop land allocation, household food consumption, household food allocation/distribution among family members, yield of crops and crop residue, and crop purchase or sale. Household food consumption was monitored in each household on a weekly basis by interviewing women. Input and product prices were averaged from local market surveys in February, June and October in 2002 and 2003. The consumption unit (CU) of each household was calculated by adding the CU value of each household member (FAO, 1990). Secondary data were collected on the nutritional composition of each crop (EHNRI, 1998).
As there are two crops per year land area per household was considered as the sum of land used for growing annual crops in both seasons, plus the area occupied by perennial crops. Therefore, the farm size presented here is larger than the actual farm area per household. Nutrient yields of annual crops were determined by measuring on-farm edible yield per area and multiplying yield by published nutrient contents of these products (EHNRI, 1998). This was further transformed by converting it to household nutrient supply, as the sum of all consumable crop products of the household in the respective groups. Besides the annuals, the system comprises perennial crops (e.g. enset) of various ages. Nutrient yield of perennial crops was determined by estimating harvestable crop yield per plant per year through measuring corm height and circumference of plants of various ages, as described by Shack and Ertiro (Reference Shack and Ertiro1995). The available household labour was calculated using adult equivalents (FAO, 1999) and used to estimate the implication of change in cropping systems on labour requirements. Only 25% of the family labour per year was considered to be available for farming activities.
Description of the models
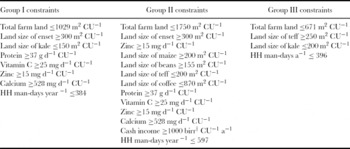
A multiple goal linear programming model was developed using Microsoft Excel (Amede et al., Reference Amede, Stroud and Aune2004) and used to analyse the different production objectives of cash income and/or human nutrition, through crop land allocation. Nutritional recommended daily allowance (RDA) according to the World Health Organization (WHO, 1999) was used to calculate household annual food demand. The objective functions used in the model were energy availability CU−1 day−1 (Group I and II) and cash income CU−1 a−1 (Group III). A complete list of constraints used in the calculations is given in Table 2.
Constraints used in the optimisation model for each of the three groups.

†1 USD = 8.6 Ethiopian birr.
CU: consumption unit.
HH: household.
For Group I and II the model is presented as follows:
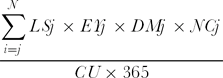
where:
LS = land allocated for crop i
EY = edible yield of crop i
DM = dry matter yield of crop i
NC = nutrient content of crop i
CU = consumption unit in the house hold (unit of people eating in the house)
For Group III the objective function for optimizing cash income is:
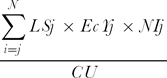
where:
EcY = economic yield of a particular crop i
NI = net cash income after production costs are deducted i
The possible effect of change in cropping system on soil erosion was calculated after Amede et al. (Reference Amede, Stroud and Aune2004) as farm erosivity index (FEI). The crop factor (C-factor) of each crop grown by the household of the representative farms per year was considered when calculating FEI. The FEI was calculated as follows:

where:
FEI = cumulative farm erosivity index
CF = crop factor of respective crop species
Farm level crop water use of the respective social groups was calculated after simulation of climatic date using New LocClim (FAO, 2005) and calculating seasonal water use of the cropping system using the CropWat model (FAO, 1998). Water use of current and optimized systems was calculated as a sum of crop water requirements of respective crops calculated through the K-value of individual crops and the crop area they occupy under the respective systems and seasons.
RESULTS
Food security status of current systems
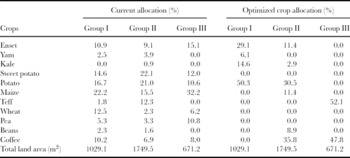
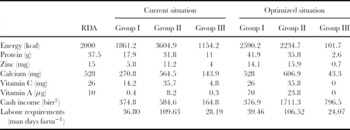
The current cropping system is highly diversified with maize, potato (Solanum tuberosum) and sweet potato (Ipomea batatas) dominating the annual crops, and enset and coffee (Coffee arabica) being the principal perennial crops. Current allocation of land to the main crops is given in Table 3. Despite the high crop diversity, Groups I and III are deficit in household nutritional requirements, with the deficit being larger in Group III (Table 4). On the other hand, most of the household nutritional demand is satisfied in Group II except for a moderate deficit in protein and zinc. Net cash income from crop production was 42, 65 and 19 USD CU−1 a−1 for Groups I, II and III respectively, obtained mainly from coffee, beans and teff plots.
Land allocation in the root-crop based systems for various field crops, currently and after optimization with priority for human nutrition (Group I), human nutrition and cash income (Group II) and cash income (Group III).

Nutrient budget, cash income and labour requirements of households in the current cropping systems and after the system was optimized primarily for human nutrition (Group I), human nutrition and cash income (Group II) and cash income (Group III).

RDA: recommended daily allowances
†1 USD = 8.6 Ethiopian birr.
Modelling results
Group I. The primary objective of these households was to fulfil the nutritional requirement of their family members. This can be achieved by replacing maize, sweet potato, coffee and wheat (Tritium sativum) and increasing the land area of potato, enset and kale from the current allocation of 16.7, 10.9 and 0% to 50.3, 29.1 and 14.6%, respectively (Table 3), whilst maintaining household food preferences of the group. By implementing this reallocation, the energy supply increases from 1861 to 2590 kilocalories CU−1, while the protein supply was improved from 18 to 42 g d−1 CU−1, significantly higher than the RDA (Table 4). The supply of vitamin A, zinc and calcium was also increased. The change towards the suggested cropping system did not increase household labour requirements (Table 4). However, this change towards fulfilling the household's nutritional demand did not improve the cash income for Group I (Table 4).
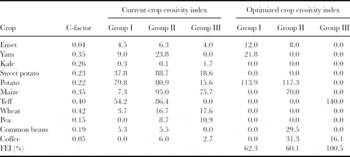
Effects of crop allocation on soil erosion; currently and after optimization with priority for human nutrition (Group I), human nutrition and cash income (Group II) and cash income (Group III) in Gununo, Southern Ethiopia. The C-factor of a bare soil is 1.0.

Group II. This household group is already fulfilling household food demand and wants to increase cash income. To achieve this a complete shift from growing sweet potato and teff to coffee, potato and beans is needed, by increasing their proportions by 29, 9.5 and 7.3%, respectively (Table 3). This shift towards a coffee/potato dominated system would triple the cash income (584.6 v. 1711 birr CU−1 a−1(1 USD = 8.6 Ethiopian birr); Table 4). The possible shift towards the suggested cropping system did not further increase household labour requirements (Table 4), although labour shortage is already apparent in this group.
Group III. They are already covering household food demand through off-farm income, particularly retail trading and selling skills and labour. The main objective of the households was to maximize the cash income regardless of its effect on household food production. Despite the existing small landholding in Group III the household income increased by about 500% (Table 4) through a complete shift towards coffee (48%) and teff (52%). However, total income did not satisfy their expectations due to their small landholdings. Unlike the other groups, the shift towards the suggested cropping system decreased household labour requirements by about 15% (Table 4).
Implication for soil erosion management
The current production system for all groups is allocation of perennial crops (enset, coffee) and planting materials (sweet potato and spices) around the homestead, and cereals and root crops in the midfields and outfields (Amede and Taboge, Reference Amede, Taboge and Bationo2007). In Groups I and II, the partial replacement of erosion-prone cereals and sweet potato by coffee and enset reduced the FEI by 38 and 40%, respectively (Table 5). In Group III, although there was a considerable expansion of the coffee plots, which have very high cover effects, the parallel expansion of the erosion-prone teff increased the vulnerability of the system to erosion meaning there was overall no effect on FEI.
Implication for livestock feed
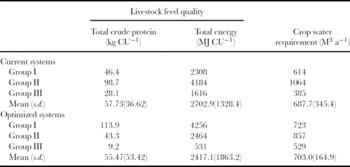
In Group I, the proposed changes in the cropping system would fulfil feed demand by tripling crude protein (46 v. 114 kg CU−1 a−1) and doubling livestock energy supply (2300 v. 4256 MJ CU−1 a−1) due to the expansion of high biomass crops like enset and kale (Table 6). On the other hand, the shift from cereals to high value crops like coffee in households of group II and III reduced the quality of the livestock feed by reducing the protein and energy supply.
The effect of change in crop reallocation on livestock feed quality and crop water use of systems in each of the three groups.

Implication for crop water requirements at farm level
The water use of the current cropping system varies from 385 to 1064 m3 a−1, depending on the group. Group III farms consumed the least while Group II farms consumed the most water (Table 6). In the suggested cropping systems, the water requirement of Group II farms would decrease by about 20% while the water demand from Group I and III would increase by 18% and 37%, respectively. The increase in water demand was strongly associated with the expansion of the land allocated for the perennial coffee and enset fields.
DISCUSSION
Satisfying household nutrition and income
Cropping systems which include enset are already supporting 10–13 million people in Ethiopia as a staple, or co-staple with cereals and root crops (Tsegaye and Struik, Reference Tsegaye and Struik2002). Communities in these systems prefer enset for its abiotic stress resistance, year round availability, soil protection and its very high productive capacity. The probability of adoption of the recommendation of increasing the land area of enset at the expense of other crops is high, particularly in areas where land shortage and food insecurity coexist. For instance, in Gedio, about 250 km away from the research site, farmers allocated about 90% of their land to enset/coffee mixtures and remained food self-sufficient for generations without external support (personal observation). The banana-based farming systems of Uganda are another example fulfilling the RDA of rural households (McIntyre et al., Reference McIntyre, Bouldin, Urey and Kizito2001).
Model solutions favoured a reduction in crop diversity and an expansion of few high-yielding and marketable crops like enset, potato and coffee. This shift to new market-linked crops will reduce system resilience due to increased mono-cropping and increase income risk due to market fluctuations and failures. Whilst this is the optimized model output resulting from many years of farmer discussions, further refinement is needed to include elements of risk (food security and market) in any future analysis. In addition, more dialogue with local communities is needed to investigate which option is attractive to them and what level of risk to include in the modelling.
As crop diversity is commonly a strategy for protecting the household from risk of climate and pests, an analysis was considered under sub-optimal farm productivity conditions, whereby the crop diversity is maintained at seven, 11 and four crops in Group I, II and III, respectively. While it was possible to satisfy the nutritional requirements in Group I and II, the financial income of Group II and Group III was reduced by about 30% with increasing crop diversity (data not shown).
Effect on other system components
Food security determines the degree to which the land-resource base is protected, with food-secured communities commonly willing to invest more on land, forest and water protection than poverty-stricken communities. Our assessment of the potential effects of change in crop reallocation on livestock feed, soil erosion and crop water use at farm level indicated mixed results. The shift to the suggested cropping system in Groups I and II will reduce soil erosion by up to 40% (Table 5) through the expansion of perennial crops, which have higher soil protection characteristics through increased canopy cover and below-ground effects. Similarly, Bornesmisza (Reference Bonesmisza1982) reported that well-managed coffee plantations could reduce soil erosion by up to 98% compared to unprotected plots.
The expansion of enset/coffee would affect the livestock system in multiple ways. Firstly, the suggested system would produce relatively low quality animal feed with a significant decline in the energy supply (Table 6) and reduced nutritional quality with increased supply of lignin, caffeine and tannin contents. Secondly, the expansion in area of perennial crops may inhibit free movement of animals and free grazing of stubble after crop harvest. It may also demand a complete shift to a cut-and-carry system, which may have a significant implication for labour and additional livestock feed. Thirdly, since manure availability is a prerequisite for growing enset and organic coffee (Tsegaye and Struik, Reference Tsegaye and Struik2002), the expansion of these crops could be constrained by the lack of sufficient animals in the system to produce enough manure. The direct use of crop residues of enset/coffee as an organic fertilizer could be also hindered by its slow decomposition rate. However, the reduced feed quality could be corrected by growing high-value legumes and grasses, as intercrops and cover crops in the expanded enset/coffee fields. These leguminous cover crops could produce a significant amount of high-quality feed with minimum effect on the perennial crops (Amede et al., Reference Amede, Belachew and Geta2001).
Although the model suggests an expansion of high-yielding and perennial crops in the system, it does not capture the very high demand of these crops for nutrients and water. The implications is that farms occupied by long-maturing annuals and perennial crops drain more water than those that could produce early maturing and yet high-yielding crops. For instance, maize is more water efficient, with a demand of about 710 l kg−1 of economic yield, while soyabean demands about 2860 l kg−1 (Renault and Wallender, Reference Renault and Wallender2000). However, the current rainfall amount and distribution, with an average annual rainfall of 1300 mm, mean temperature of 19.5 °C, and a growing season of seven months (Amede and Taboge, 2004) would fully support the water demand of the suggested cropping systems. Further intensification is possible if run-off is minimized and in situ water management technologies are adopted.
Moreover, expanding the fields of coffee and enset could be constrained by the low soil fertility status of outfields. Amede and Taboge (Reference Amede, Taboge and Bationo2007) reported that enset yield could be reduced by up to 70% when grown in the less fertile outfields. This is partly because the traditional homestead fields are very rich in organic matter content (about 6%), while the outfields are relatively poor (1.5%) due to preferential application of manure and household residue (Amede and Taboge, Reference Amede, Taboge and Bationo2007). Although expansion of these perennial crops will reduce soil erosion and nutrient loss, the expansion would cause nutrient mining through high biomass and tuber removal if it is not balanced by increased nutrient application, e.g. though chemical fertilizer application, mulching or inclusion of short-maturing legume cover crops in the system.
CONCLUSIONS
The current production system in the intensively cultivated Ethiopian highlands does not achieve food security or sufficient income for the households, particularly because of decreasing farm size and increasing resource degradation. This study has shown the potential to modify the cropping system, by considering crop adaptation and social preferences, to improve food security through reallocation of land and minimizing resource degradation. The modelling approach was also effective in quantifying the trade-offs and showing the implications of the change in land use on livestock feed, soil erosion and farm water use. Whilst changes in the production system are possible to achieve optimum outcomes, this study has shown that a deeper understanding of farmers' attitudes to risk, vulnerability and access to resources and labour is needed before any of these solutions can be promoted as potential options for addressing food insecurity, income generation and improving environmental services.
Acknowledgements
We appreciate the contributions of Gununo farmers while conducting the surveys and on-farm measurements. Thanks go to Mr Wondimu Walellu for collecting the data. We also appreciate the Swiss Development Centre (SDC) for financing the work through the African Highlands Initiative (AHI). Drs Don Peden and Amare Haileselassie are acknowledged for their useful comments.