Introduction
When Lieutenant Commander Richard E. Byrd flew north from Spitsbergen on 9 May 1926 and announced on his return that he had reached the North Pole, the event captured the public imagination and was a milestone in the history of aviation. In the decades following the flight, however, serious questions have arisen concerning whether he actually reached the pole, and the flight has become quite controversial.
The chief argument against Byrd's having reached his aim was the fact that Byrd (with Floyd O. Bennett as pilot) returned earlier than expected. In his report to the U.S. Navy, Byrd (Reference Byrd1926a) listed a take-off time from King's Bay (79° 0′ N, 11° 40′ E) of 0:37 GCT and arrival at the North Pole at 9:02, a duration of 8h25m, with a claimed return flight from 9:15 to 16:34, a remarkably short 7h 19m. The northbound leg was 1,224 km (661 nm, 761 statute m), and southbound was 1,246 km (673 nm, 774 statute m). The total time of 15h57m compares to the expected duration of 16 to 24 hours quoted in The New York Times on 9 May 1926 and 18 hours listed by Pickering (Reference Pickering2000). Most of the difference would have to result from changing winds. Byrd's (Reference Byrd1926a) report to the navy stated that the wind was a ‘light breeze from the east’ soon after taking off. After he passed Amsterdam Island the wind ‘continued from the East but did not retard speed of plane’ and Byrd's note to Bennett in his original diary notebook as they passed Amsterdam Island says ‘direction of wind from East’ (page headed MONDAY, JANUARY 5, 1925; Byrd Reference Byrd1926b). Byrd (Reference Byrd1926a) also noted the following winds. At 6:22 GCT there was still a ‘[l]ight wind from east.’ At 8:22 GCT (well before Byrd claimed to have reached the pole), the ‘wind had shifted towards the north and was freshening’ and when Byrd estimated he was still 50.7 km (27.4 nm, 31.5 statute m) short of the pole it ‘had gotten stronger and still shifting towards the north.’ He added ‘[t]he wind which had started freshening before we reached the pole was astern on the return trip and increased the speed considerably all the return flight.’ However, in a cable that Byrd sent to the United States on his return to Spitsbergen that he quoted two years later (Byrd Reference Byrd1928), he stated that on the return leg, ‘The wind began to freshen and change direction soon after we left the Pole . . .’ (italics added). The inconsistency over whether the wind shifted to the north before or after Byrd felt he had reached the pole certainly raises the strong suspicion that at least some of Byrd's reports were written from memory after the fact, and the memory was not always consistent. An entry in the 1925 diary (page headed CASH ACCOUNT NOVEMBER; Byrd Reference Byrd1926b) wrote ‘There is a very strong wind please steer very carefully,’ but with no notation as to when in the flight this was written. When he approached Amsterdam Island he ‘found a strong wind blowing white caps’ (Byrd Reference Byrd1926a). In this paper, I address two concerns: possible systematic errors in Byrd's measured ground speed (from which the winds were derived), and the chances that Byrd's reported winds could occur.
Ground speed
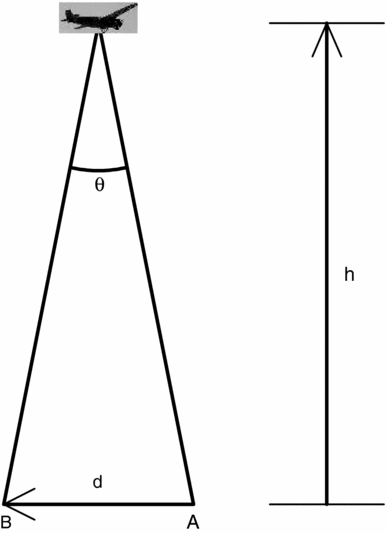
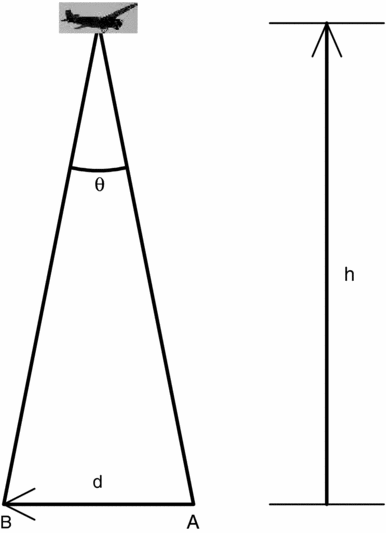
In addition to occasional sextant readings, Byrd's navigation relied on three instruments: sun compass, drift indicator, and barometer. The sun compass was a simple but ingenious device for use in polar regions, basically a 24-hour clock that rotated to track the azimuth of the sun when an aircraft flew along a line of constant meridian. The sun compass gave the direction the plane was pointing (heading). The drift indicator was used to correct for any crosswind and to obtain ground speed, from which Byrd derived his dead reckoning positions. The drift indicator was used to sight individual features on the sea ice through the floor of the aircraft. The direction a feature moved yielded the difference between the heading and the direction in which the aircraft was moving. The method of finding ground speed is illustrated in Fig. 1. The time it took a feature to cross between two marks in the drift indicator gave its angular speed, which was converted to ground speed by simple geometry, as long as one knew the aircraft's altitude above the ice. A model atmosphere combined with the barometer reading yielded altitude. Any error in the derived altitude led to an error in derived ground speed. Unfortunately no record has been found of Byrd's individual sightings with the drift indicator or his tracking of ground speed and accumulated distance traveled. We have no way of checking Byrd's angular speed measurements, but we can examine his conversion from atmospheric pressure to altitude.
Byrd's method of deriving ground speed. As viewed from an aircraft flying to the right, a feature on the ice appears to move by angle Ө, going from A to B, in a time t. If one knows angle Ө and height of the aircraft, h, it was simple geometry to find distance d. Ground speed was then d/t. Since d is directly proportional to h, any error in Byrd's derived altitude gave a proportional error in derived ground speed.
Recently the Twentieth Century Reanalysis Project, supported by the Earth System Research Laboratory Physical Sciences Division from the National Oceanic and Atmospheric Administration (NOAA) and the University of Colorado CIRES/Climate Diagnostics Center, has provided extensive computer models of wind and atmospheric pressure data for the entire earth. The NOAA-CIRES Twentieth Century Global Analysis Version II covered the time from 1871 to 2008 at six-hour intervals for a latitude/longitude 2×2 degree grid. Of relevance here are the data sets listing altitude for atmospheric pressures of 1000, 950, 900, and 850 mb, obtained from the mean of 56 separate computer models of atmospheric conditions during Byrd's flight. Since very few ground-truth data exist to constrain the models relevant for Byrd's flight, different models understandably display a considerable range of values. Nevertheless, this appears to be the only large scale unbiased data set of plausible atmospheric conditions during Byrd's flight, and I adopted the mean altitude versus pressure values for comparison with Byrd's calibration.
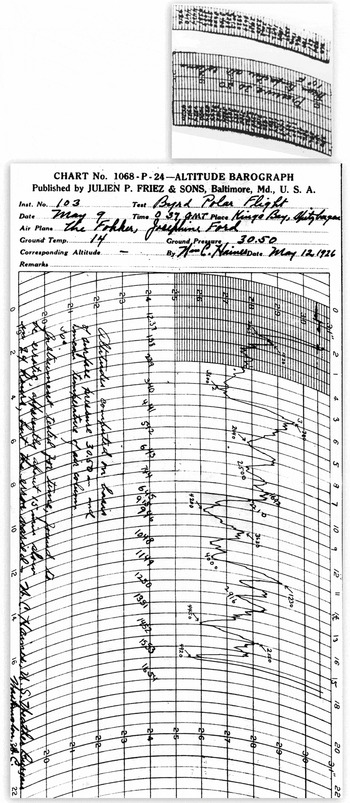
Fig. 2 shows the barograph record of Byrd's flight, along with two calibration strips (with altitudes written for various atmospheric pressures). The calibration strips, which could be placed on the barograph strip-chart paper quickly to convert pressure to altitude, were on the same page as the barograph recording on an unmarked photocopy in the archives of The Ohio State University Byrd Polar Research Center. We cannot be sure that Byrd used either of these calibration strips on his 1926 flight, although it is plausible. One strip carries a legend (but not apparently in Byrd's handwriting), ‘Pressure 30.50 Mean temperature air column 10° F.’ Altitudes are marked on the barograph itself for 16 instances; could these have been marked on the barograph recording by Byrd during the flight, thus telling us which calibration he used? Handwriting (apparently not Byrd's) on the recording says, ‘Altitudes computed on basis of surface pressure 30.50 in [inches of Hg] and mean temperature of air column 30°. Instrument tested for time, found to be erratic, apparently about 15 min slow in 24 hours, but the error varied. W. C. Haines, U. S. Weather Bureau. Washington, D.C.’ It thus seems likely that it was not Byrd but Haines (Byrd's weatherman at King's Bay) who marked the altitudes in the course of testing the barograph, although why he would do this is not obvious. (The notations have some errors; for example the time indicated 6:45 should be 8:45, and the altitude indicated 3630 should apparently be 2630.)
Barograph recording from Byrd's 1926 polar flight. At top are two calibration strips with altitudes written in for different pressures. It is unknown which, if either, was the one Byrd used on his flight.

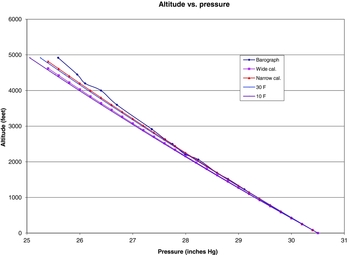
Fig. 3 shows a plot of altitude versus pressure for data marked on the barograph recording, for both calibration strips, and for isothermal atmospheres at 30° F (−1° C) and 10° F (−12° C). These temperatures were chosen since they are the two temperatures marked on the barograph and one of the calibration strips. Altitudes from the barograph recording show some oscillation, due at least in part to uncertainty concerning exactly what pressure each marked altitude refers to, but at higher altitudes they show a considerably higher pressure than the plot for 30° F. This clearly indicates that the altitudes marked on the barograph recording are implausible; the required scale heights imply temperatures warmer than 77° F (25° C) above altitudes of 885 m (2900 ft). How such values were obtained is one of many minor mysteries about Byrd's flight. In the unlikely event that these came from the calibration that Byrd used on his flight, then Byrd would have greatly overestimated his height when at higher altitudes, which in turn would have caused him to greatly overestimate his ground speed and his dead-reckoning distance traveled during the relatively brief periods when the plane was at pressures less than 27 inches Hg. It seems more likely, however, that Byrd used one or both of the calibration strips. Fig. 3 shows that the calibration strip marked as being for a ‘Mean temperature air column of 10° F’ (the wide calibration strip) closely fits an isothermal atmosphere at that temperature, while the other calibration strip, with no temperature indicated, fits an isothermal atmosphere at 30° F. If Byrd used one of these two, there is no indication concerning which.
Altitude (in ft) versus pressure (in inches of mercury) taken from (1) altitudes marked on barograph from Byrd's flight, (2) wide calibration strip labeled for 10° F, (3) narrow calibration strip, without temperature label, (4) isothermal atmosphere at 30° F, and (5) isothermal atmosphere at 10° F. Apparently the narrow calibration strip was calculated for a temperature of 30° F. Oscillations in the line from the barograph arise at least in part from uncertainty as to exactly which point on the barograph recording is being indicated.

I used three ways to derive an altitude from the atmospheric pressure recorded on the barograph, two from the two calibration strips and one from the mean data from the NOAA-CIRES data set. Since Byrd reported (Byrd Reference Byrd1926a) he ‘never let three minutes go by without getting the speed and drift,’ I used the atmospheric pressure on Byrd's barograph recording at three-minute intervals for the flight north from Amsterdam Island and converted each reading to an altitude using each of the calibration strips. (I did not do this for the return leg of the flight, since Byrd presumably was simply flying south until Spitsbergen came into view, without being too concerned about the distance traveled.) For the NOAA-CIRES data set, I used a linear interpolation between data points for latitude, longitude, and time, and an exponential interpolation in altitude.
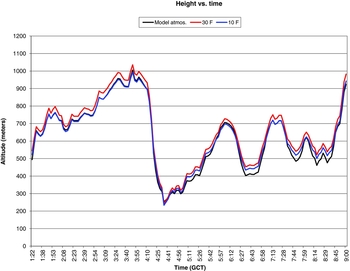
Plots of altitude versus time from the mean of the NOAA-CIRES models and from Byrd's ‘isothermal’ calibrations are shown in Fig. 4. Before about 4:50 GCT, the modern mean model gives altitudes very close to the 10° F isothermal calibration. After 4:50 GCT, the mean of the NOAA-CIRES models yields lower heights than the 10° F isothermal calibration for altitudes below 600 m and generally good agreement above 600 m. The 30° F calibration, on the other hand, consistently gives higher altitudes at each time during the northbound leg. This systematic effect would mean that, if Byrd used the 30° F calibration, then he would have computed an average height, and hence average distance flown, more than 6% greater than the best modern atmospheric model (the mean of the NOAA-CIRES models). If he used the 10° F calibration, then he overestimated distance traveled compared to NOAA-CIRES by only 2%. If there were no errors in the mean NOAA-CIRES model or in Byrd's equipment or measurements, for the distance from Amsterdam Island to the Pole (1,133 km, 612 nm, 704 statute m) the 6% and 2% discrepancies correspond to a systematic shortfall in Byrd's dead reckoning of 70 km and 22 km (38 and 12 nm, 43 and 14 statute m) respectively.
Altitude versus time derived from the mean of the NOAA-CIRES model atmospheres (black) and isothermal atmospheres at 30° F (red) and 10° F (blue).

The National Geographic Society committee (NGS) report on the flight noted that the derived altitudes depended on the atmospheric pressure at sea level not changing along the course and what variation actually occurred was unknown, and it was the committee's ‘belief, therefore, that estimates of speed may be subject to large errors.’ (NGS 1926). Based on his navigation experience, Portney (Reference Portney2000) estimated an uncertainty in Byrd's ground speed of 5% in the measured ground speed. Assuming that Byrd did his dead reckoning exactly as he described with no clerical errors and combining the possible systematic effect from the altitude calibration with Portney's 5% random error (corresponding to 56 km, 30 nm, 35 statute m), a worst case scenario would indicate that Byrd turned around while still 126 km (68 nm, 78 statute m) short of the pole (56 km from random and 70 km from systematic errors), while in the most optimistic case Byrd may have overshot the pole by about 34 km (18 nm, 21 statute m) (56 km random minus 22 systematic). Unless further information appears to determine what calibration Byrd used to convert atmospheric pressure to altitude, this type of analysis by itself will not resolve any controversy over whether Byrd reached the pole. But it does indicate he was considerably more likely to have ended up short of his goal than to have exceeded it.
Byrd (Reference Byrd1928) described how, after believing he had reached the pole, he took two sun sights, turned and took two more, took some moving and still pictures, then continued several miles in the direction they had come, then made another larger circle to be sure to ‘take in’ the pole. I can see two ways to interpret this description. Firstly in the 13 minutes before they started the return leg, the sun sights, photography, and flying ‘several miles’ would take at least 5 minutes, leaving 8 minutes at most for his larger circle. This would make the radius of the circle less than two miles, less than the ‘several miles’ he said he flew beyond the pole, so even by Byrd's own navigation the circle did not ‘take in’ the pole. The radius is also much less than the 56 km random error Portney (Reference Portney2000) found reasonable. Hence, even without any systematic errors, it is highly unlikely that Byrd actually flew around the pole as claimed, and Byrd seems to have lacked an appreciation for the errors inherent in his navigation.
Secondly Byrd's larger circle may have had a radius of at least several miles, in which case he spent considerably longer than 13 minutes near what he believed to be the pole. In this case, some of the navigation he reported should be considered at best to be reconstructed from memory.
A semantic question is, what does it mean to have ‘reached’ the pole? The barograph record shows the plane reached an altitude of 1,100 m (3600 feet) during the 13 minutes Byrd claimed to be circling the pole. Could Byrd see the pole from his turn around point? The National Geographic Society report noted that one could see 97 km (52 nm, 60 statute m) away from an altitude of 915 m (3000 feet). Rawlins (Reference Rawlins2000) calculates that, from an altitude of 1,310 m (4300 feet), the horizon would be 143 km (77 nm, 89 statute m) away. So the pole would probably have been within Byrd's sight except in the worst case of combining random and systematic errors. Here Portney's (Reference Portney1973) comment appears realistic: ‘Whether he was thirty, forty, or even sixty miles short [of the pole] cannot be determined with absolute certainty. To expect that he was at the actual pole is to expect too much from dead-reckoning aided by sunlines in the polar region.’
Air speed
Did Byrd's Fokker F.VIIa/3m trimotor, with three 200 hp engines (although Glines (Reference Glines1999) reported that the aircraft actually had 220 hp engines), have sufficient air speed to have plausibly reached the pole in the time interval that Byrd reported? This point is controversial (see, for example Liljequist Reference Liljequist1960). Reports of the cruising air speed of a fully loaded Fokker trimotor vary considerably; examples are 150 km/hr (81 knots, 93 mph) with 220 hp engines (aerofavourites 2011), 161 km/hr (87 knots, 100 mph) with 200 hp engines (airminded 2011), and 145–160 km/hr (78–86 knots, 90–99 mph) with 200 hp engines (Demas Reference Demas1976). References that did not include engine power were 165 km/hr (89 knots, 102 mph) (Jane's All the World's Aircraft for 1927, quoted by Liljequist Reference Liljequist1960), and ‘about 75 knots [139 km/hr, 86 mph]’ (Pickering Reference Pickering2000). The aircraft was normally equipped with non-retractable wheels, but Byrd replaced the wheels with skis. Waite (Reference Waite1982) wrote in the margin of Ronne's book that Byrd's plane with skis had an airspeed of 176 km/hr (95 knots, 109 mph). Rose (Reference Rose2008) estimates that the speed was faster with skis, while Ronne (Reference Ronne1979) claimed the aircraft was slowed by the skis to an average speed for the entire flight of no more than 130 km/hr (70 knots, 81 mph). Liljequist (Reference Liljequist1960) estimates the average cruising speed with skis of about 130 or 133 km/hr (70 or 72 knots, 81 or 83 mph). Both Liljequist (Reference Liljequist1960) and Montague (Reference Montague1971) claim that the skis caused a modest slowing of about 5 to 7 km/hr (3 to 4 knots, 3 to 5 mph). Liljequist based his value on increased parasite drag estimated by a ‘technical expert’ from photos of the plane with wheels and with skis. I repeated these admittedly crude measurements, from both technical drawings and photos, and derived a frontal area of the skis of 60% of the frontal area of the wheels. While cross-bracings on the skis produced additional drag, this should be compensated for by the lower frontal area, leading to the conclusion that replacing wheels with skis had a negligible effect on drag.
If we accept Byrd's report that he was at the north end of Amsterdam Island at 1:22 GCT (Byrd Reference Byrd1926a), ended his northward flight at 9:02, began his southward leg at 9:15, and arrived back at King's Bay, Spitsbergen, at 16:34, the 1,133 km (612 nm, 704 statute m) flight north from Amsterdam Island took 7.67 hours, and the southward 1,246 km (673 nm, 774 statute m) flight back to King's Bay was 7.32 hours. (The New York Times reported on 11 May 1926 that Byrd circled the base at King's Bay three times before landing. I assume the 16:34 arrival time is when he arrived over Kings Bay, not when he landed some time later.) If he turned around right at the pole, he needed an average ground speed north of 148 km/hr (80 knots, 92 mph) versus 170 km/hr (92 knots, 106 mph) when flying south. If he turned around 70 km (38 nm, 43 statute m) short of the pole, the speeds become 139 and 161 km/hr (75 and 87 knots, 86 and 100 mph) respectively, and in the more extreme case of turning around when 126 km (68 nm, 78 statute m) short of the pole, the ground speeds become 131 and 154 km/hr (71 and 83 knots, 81 and 96 mph) respectively.
Whether these speeds are plausible of course depends greatly on the winds. Byrd (Reference Byrd1926a) said that for each of the first six hours of the return flight he had ground speeds of 146.4, 143, 150.5, 149, 148, and 152 km/hr (79, 77, 81, 80.4, 80, and 82 knots; 91, 89, 93.5, 92.5, 92, and 94.5 mph). He later reported (Byrd Reference Byrd1928) that on the return leg, ‘The wind began to freshen and change direction soon after we left the Pole, and soon we were making over 100 [statute] miles an hour [161 km/hr, 87 knots].’ But how plausible is Byrd's claim to have had a strong tailwind on the return leg when the wind was weaker and from the east on most of the northbound leg?
Winds
Some commentators have claimed that winds had little effect on Byrd's flight. The clear skies enjoyed on the flight imply a high pressure system in the area, and Liljequist (Reference Liljequist1960) concluded that a high pressure ridge was stationary between Spitsbergen and the North Pole which would have produced almost no wind during the flight, a conclusion shared by Ronne (Reference Ronne1979). Portney (Reference Portney2000), on the other hand, argued that the winds Byrd reported were explained by the center of a high pressure clockwise circulation pattern moving from east to west across the flight path during Byrd's flight, giving tailwinds on both legs. Clearly, independent estimates of the weather patterns during Byrd's flight would be desirable.
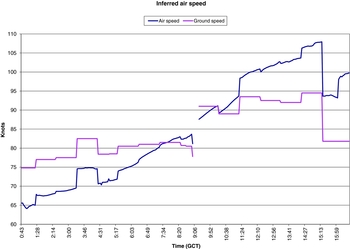
The NOAA-CIRES simulations used for atmospheric pressure versus altitude also include winds with the same grid pattern as the pressure (six-hour intervals, latitude/longitude 2×2 degree grid, and atmospheric pressures of 1000, 950, 900, and 850 mb). These simulations appear to be the most unbiased estimates available of plausible wind speeds. Using the mean of the 56 simulations, I interpolated for each three-minute interval of the flight to obtain the wind speed and direction. Subtracting the wind vector from Byrd's average ground speed for each interval between his reported dead reckoning positions gave the inferred air speed versus time, as shown in Fig. 5. The question under consideration was why Byrd's southward flight had a higher ground speed than the northward flight, and we see from Fig. 5 that using the mean wind from the NOAA-CIRES simulations makes the problem considerably worse. The mean of the simulations shows a tailwind for most of the northward flight and a headwind on the return. The results are so strongly at odds with Byrd's reported winds that closer scrutiny is needed.
Comparison of the average ground speed for each interval for which Byrd reported dead reckoning positions and the inferred air speed, based on the mean of the NOAA-CIRES model atmospheres.

Since NOAA-CIRES actually ran 56 simulations to obtain their mean, it was worth computing the effect of the winds on Byrd's flight for each of the 56 simulations. To simplify the computations, I treated each of the four tabulated altitudes separately, taking the mean wind speed at each altitude for each of Byrd's dead reckoning time intervals. I then subtracted the wind vector from the mean ground speed vector Byrd reported for each time interval, which yielded a mean air speed for each time interval. Weighting each such air speed by the length of the corresponding time interval, I obtained a weighted mean overall air speed for both the northbound and southbound legs for each of the 56 simulations for each altitude (1000, 950, 900, and 850 mb). On the northbound leg of Byrd's flight, the winds in the simulations varied between 72 km/hr (39 knots, 45 mph) blowing from the north to 39 km/hr (21 knots, 24 mph) from the south. On the return leg, they showed a range from 83 km/hr (45 knots, 52 mph) from the north to 44 km/hr (24 knots, 27 mph) from the south (these numbers are averaged over the four different altitudes). Claims that winds could not have played a significant role in Byrd's flight are not supported.
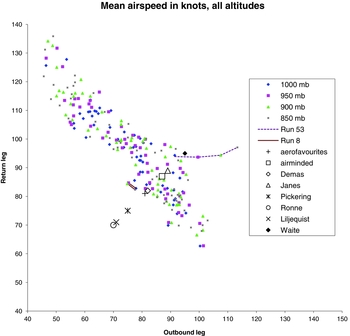
Fig. 6 shows the mean airspeed on the return leg plotted against the speed on the outbound leg for all 56 simulations and all 4 altitudes. The trend in the figure is strong and obvious; a strong tailwind on the southbound leg correlates with a strong headwind when northbound (that is, the wind generally does not change speed and direction by a large amount over the interval of Byrd's flight).
Weighted mean air speed for the southbound and northbound legs for each of the 56 simulations of the NOAA-CIRES models, calculated for four different altitudes. The fairly tight correlation shows that a headwind on a northbound leg tended to correlate with a tailwind on the return flight. Simulations 8 and 53 were of particular interest, as discussed in the text. The eight symbols in black show different estimates of the airspeed of the Fokker trimotor, as explained in the text.

Of the 56 simulations in the NOAA-CIRES data, two are of particular interest, shown in Fig. 6 with lines connecting the four altitudes. Run 53 was a real outlier (dashed line in Fig. 6). Near sea level, at 1000 mb, the point is not unusual, but at progressively higher altitudes the points move to the right, requiring a faster air speed on the northbound leg; this corresponds to a strong headwind (averaging 39 km/hr, 21 knots, 24 mpg) at higher altitudes on the northbound leg, nearly dying away on the return leg (dropping to an average of 9 km/hr, 5 knots, 6 mph). This demonstrates that a fairly dramatic change in wind speed can occur, at least in simulations, but the change is in the opposite direction from what Byrd claimed had happened. The most favorable simulation for Byrd is number 8, with the four altitudes connected with the solid line in Fig. 6. It would require Byrd to average about 141 km/hr (76 knots, 88 mph) airspeed when headed north, and 156 km/hr (84 knots, 97 mph) on the return. Simulation 9 is nearly as favourable.
A referee of an initial draft of this paper suggested adding marks on Fig. 6 to show what airspeed the plane was capable of. The location of such marks on the plot, of course, depends on claimed cruising speed with wheels, plus the effect of skis and changing fuel load on speed. As discussed above, based on my measurements of frontal area of skis versus wheels, I made no correction for any change in drag caused by skis. The effect of the fuel load on airspeed is more complex, and requires more background. The web page aerofavourites (2011) lists the aircraft's empty weight as 2,100 kg (4,630 lb) and maximum takeoff weight as 3,600 kg (7,950 lb). Byrd (Reference Byrd1928) claimed the initially planned weight of the aircraft with fuel was about 4,540 kg (10,000 lb) but he removed ‘hundreds of pounds’ of fuel when he found that the actual fuel consumption was remarkably low. I estimate his actual takeoff weight was about 4,300 kg (9,500 lb), greatly exceeding the nominal maximum takeoff weight. Since it was designed to carry passengers, the nominal maximum takeoff weight must include a sizeable safety margin, but still in the early part of the flight the plane was heavily overloaded. Byrd (Reference Byrd1928) said they carried a radio, sledge, clothing, food for ten weeks, a rubber boat, tent, and miscellaneous tools and arms. I estimate the weight of these items, plus people and engine oil, came to 540 kg (1,200 lb). This plus the empty weight of the aircraft allows for a total fuel weight of 1,660 kg (3,660 lb). The aircraft would have reached its nominal maximum weight about the time Byrd believed he had reached the pole so the return flight would have been more typical of a normal flight.
To remain airborne with such a load, the aircraft initially would have required an uncomfortably high angle of attack. To overcome associated drag, Bennett would have needed close to 100% engine power for the first part of the flight, and fuel consumption would have been higher than nominal values. Given the risk of engine failure from running at high power for a long period, as the plane became lighter the prudent course would be to slowly throttle back the engines and lower the nose, maintaining a nearly constant airspeed. Although Byrd (Reference Byrd1926a) stated after listing the faster speeds on his return flight that ‘[O]f course the plane was much lighter than when we started and was getting lighter all the time,’ it seems more likely that any speed increase was minimal and reducing engine power was the primary result of the decreasing weight.
When Byrd selected the Fokker trimotor, he said it had a fuel consumption of ‘27 or 28 gallons per hour [73.5 or 76.2 kg/hr]’ (Byrd Reference Byrd1928), presumably when carrying a nominal maximum load. When Byrd measured the fuel consumption and found it remarkably low (Byrd Reference Byrd1928), one can infer the nominal fuel consumption was less than 75 kg/hr, but the initial high power setting for the engines implies higher consumption in the first hours of the flight. If there was an average 76 kg fuel use per hour for the entire flight, 1,215 kg of fuel would have been burned, the final weight of the aircraft would then have been 3,085 kg, and 445 kg of fuel would have remained aboard. The New York Times on 11 May 1926 reported that on landing sufficient fuel remained for five and a half hours of flying, corresponding to 385 kg of fuel at 70 kg/hr for the lighter aircraft. Differences in these two estimates of remaining fuel are well within the uncertainty in the adopted numbers.
With some confidence in this flight description, I assumed the quoted airspeeds from various sources listed above would apply for the entire flight in placing the eight symbols in black in Fig. 6. I used the average of the two values quoted by both Demas (Reference Demas1976) and Liljequist (Reference Liljequist1960). Fig. 6 shows that if any of the cruising speeds for Byrd's aircraft quoted by Pickering (Reference Pickering2000), Liljequist (Reference Liljequist1960), or Ronne (Reference Ronne1979) are correct, Byrd would have fallen well short of the pole for any of the computed winds. The plotted point from aerofavourites (2011) is for 220 hp engines instead of the 200 hp used by Byrd, so the airspeed is likely to be somewhat lower than shown, implying that Byrd would have not quite reached the pole. The cruising speeds listed by airminded (2011), Demas (Reference Demas1976), Janes (quoted by Liljequist Reference Liljequist1960), or Waite (Reference Waite1982) were quite adequate to allow Byrd to have reached the pole in the available time and with plausible winds.
Other considerations
Other aspects of Byrd's flight are outside the mathematical realm of navigation. As noted by Molett (Reference Molett1998), Byrd was highly fatigued. Byrd (Reference Byrd1928) reported that he and Bennett ‘had had almost no sleep for 36 hours’ prior to take-off. The New York Times (9 May 1926) reported that Byrd arose at midnight after a short nap, while Bennett had slept for one and a half hours next to the plane. The oil leak discovered about an hour before the turn around point (Byrd Reference Byrd1928) made their safe return doubtful. Byrd must also have felt responsible for Bennett's safe return, in addition to his own. The world's leading polar explorer, Roald Amundsen, was poised at King's Bay to fly in an airship over the pole to Alaska (which he did less than a week after Byrd's flight), and there was tremendous pressure on Byrd to reward his backers and the U.S. Navy by beating Amundsen to the pole. If he had failed on 9 May, the accolades for the first person to reach the pole through the air would very likely go to a Norwegian.
Between making frequent measurements of the lateral drift of the plane and angular speed of features on the ice passing below, converting pressure readings to altitude and finding ground speed, checking on the sun compass to make sure that Bennett was steering a proper course, making and reducing occasional sextant readings, sometimes steering the plane, and staring at the oil leak, Byrd was very busy for a long, cold, noisy flight in a very fatigued condition. He later wrote that after taking the wheel, ‘I kept my eyes glued on that oil leak and the oil-pressure indicator. . . It fascinated me.’ (Byrd Reference Byrd1928), while also claiming that when he was navigating he ‘never let three minutes go by without getting the speed and drift.’ It is plausible that at least some of the navigation was reconstructed as best he could remember it after he returned and had a chance to rest. But to have done all the things he claimed he was doing is not credible. It has all the marks of relying on a non-infallible memory.
However, not all the navigational questions can be ascribed to fatigue. An example is Byrd's check that his return flight was along the 15th east meridian. As seen from that meridian at 10:56 GCT on 9 May, the sun would be due south. If you know a priori that you are on the 15th meridian, then the direction of the sun at that moment tells you which direction is due south. Alternatively, if you know a priori which direction is due south and see the sun is directly south of you at that moment, then you know you are on the 15th meridian. However, if you have no a priori knowledge of either your longitude or cardinal directions, the sun compass cannot unambiguously tell either one. Yet Byrd concluded that since the sun was directly ahead when the aircraft was pointed directly toward the sun at that time, he must be on the 15th meridian (Byrd Reference Byrd1926a). This remarkable fallacy was pointed out by Rawlins (Reference Rawlins2000); anyone, anywhere, who pointed the aircraft directly at the sun would see the sun directly ahead. That's what it means to point the aircraft directly at the sun. It tells you nothing about your position. The fact that the National Geographic committee that examined Byrd's report, with the inventor of the sun compass on the committee, endorsed Byrd's claim (NGS 1926) indicates they did not look critically at the navigation. That Byrd repeated this spurious claim on other occasions (for example Byrd Reference Byrd1928) does not lend support to his understanding of navigation. The fact that the plane made landfall at Spitsbergen as intended after such a long flight does show, however, that the sun compass worked accurately and Byrd knew how to use it correctly.
Unless more information about Byrd's flight comes to light, I do not believe that an ironclad conclusion can be reached as to whether he reached the North Pole in May 1926. It does seem safe to conclude, however, that if he did, it was the result of quite unusual and fortuitous circumstances.
Acknowledgements
The data for this study are from the Research Data Archive (RDA) which is maintained by the Computational and Information Systems Laboratory (CISL) at the National Center for Atmospheric Research (NCAR). NCAR is sponsored by the National Science Foundation (NSF). The original data are available from the RDA (http://dss.ucar.edu) in dataset number ds131.1.
Many people offered useful comments and guidance for this work, primarily Rai Goerler (who initially asked me to look into Byrd's navigation) and Julien Nicholas (who obtained the 56 separate data sets and their mean from the Research Data Archive at NCAR). Michael Lannon carefully digitised the barograph recording from Byrd's flight. I also wish to thank Bruce Atwood, Candi Roby, and especially Tom O'Brien for their comments on aircraft and David Bromwich for advice on Byrd's flight. David Will provided technical support. My wife, Ann Newsom, provided useful comments on the paper. Staff members of the Byrd Polar Research Center at The Ohio State University, including Lynn Everett, Lynn Lay, and especially Laura Kissel, were always most helpful in providing material from their archives, and Laura Kissel also offered useful advice on Byrd's handwriting. The two referees, E.M. Standish and an anonymous reviewer, did a very thorough and careful evaluation, and many of their suggestions are incorporated in the final version of the paper.