INTRODUCTION
To understand the early human occupation of Warner Valley, Oregon (USA) we needed to know more about the late Pleistocene to early Holocene history of Lake Warner. Our goal was to reconstruct the lake’s history to predict where the earliest occupations might be located, to find archaeological evidence in relation to dated shorelines, and to synthesize this information to better understand how these people adapted to the changing conditions as the lake receded. We constructed the lake history using diagnostic artifact distributions, radiocarbon-dated shoreline features, tephrochronology, and regional paleoenvironmental data.
Pluvial lakes of North America’s Great Basin offer information about past climate and are particularly good indicators of past precipitation and temperature (Benson and Thompson, Reference Benson and Thompson1987; Benson et al., Reference Benson, Currey, Dorn, Lajoie, Oviatt, Robinson, Smith and Stine1990; Morrison, Reference Morrison1991; Oviatt et al., Reference Oviatt, Currey and Sack1992). Additionally, they are rich sources of information about the potential adaptive opportunities available to prehistoric peoples. Researchers working in the Great Basin (e.g., Campbell et al., Reference Campbell, Campbell, Antevs, Amsden, Barbieri and Bode1937; Bedwell, Reference Bedwell1973; Willig, Reference Willig1988; Adams et al., Reference Adams, Goebel, Graf, Smith, Camp, Briggs and Rhode2008; Smith and Barker, Reference Smith and Barker2017) have long recognized a relationship between these lake systems and early human populations. Sites containing Clovis and Western Stemmed Tradition (WST) projectile points are often found on relict lakeshores (Jones and Beck, Reference Jones and Beck2012; Duke and King, Reference Duke and King2014), but with few stratified open-air sites dating to the late Pleistocene and early Holocene, our understanding of Paleoindian chronology, adaptation, and land use relies heavily on our understanding of lake histories (Adams et al., Reference Adams, Goebel, Graf, Smith, Camp, Briggs and Rhode2008). Knowing lake levels during specific periods elucidates which landforms were available for occupation and the likely distribution patterns of plants, animals, and critical marsh resources, which require particular water depth and bathymetry.
In this paper, we report the geoarchaeological results from an interdisciplinary research program in Oregon’s Warner Valley conducted by the University of Nevada’s Great Basin Paleoindian Research Unit in conjunction with the Bureau of Land Management (BLM). The combination of a rich archaeological and lacustrine record focused our attention on dating shoreline features in northern Warner Valley and characterizing any associated Paleoindian sites. Our results improve the understanding of Lake Warner’s latest Pleistocene and Holocene history, prehistoric adaptation in Warner Valley, and the environmental and archaeological record of the northern Great Basin.
PHYSICAL SETTING AND PREVIOUS RESEARCH
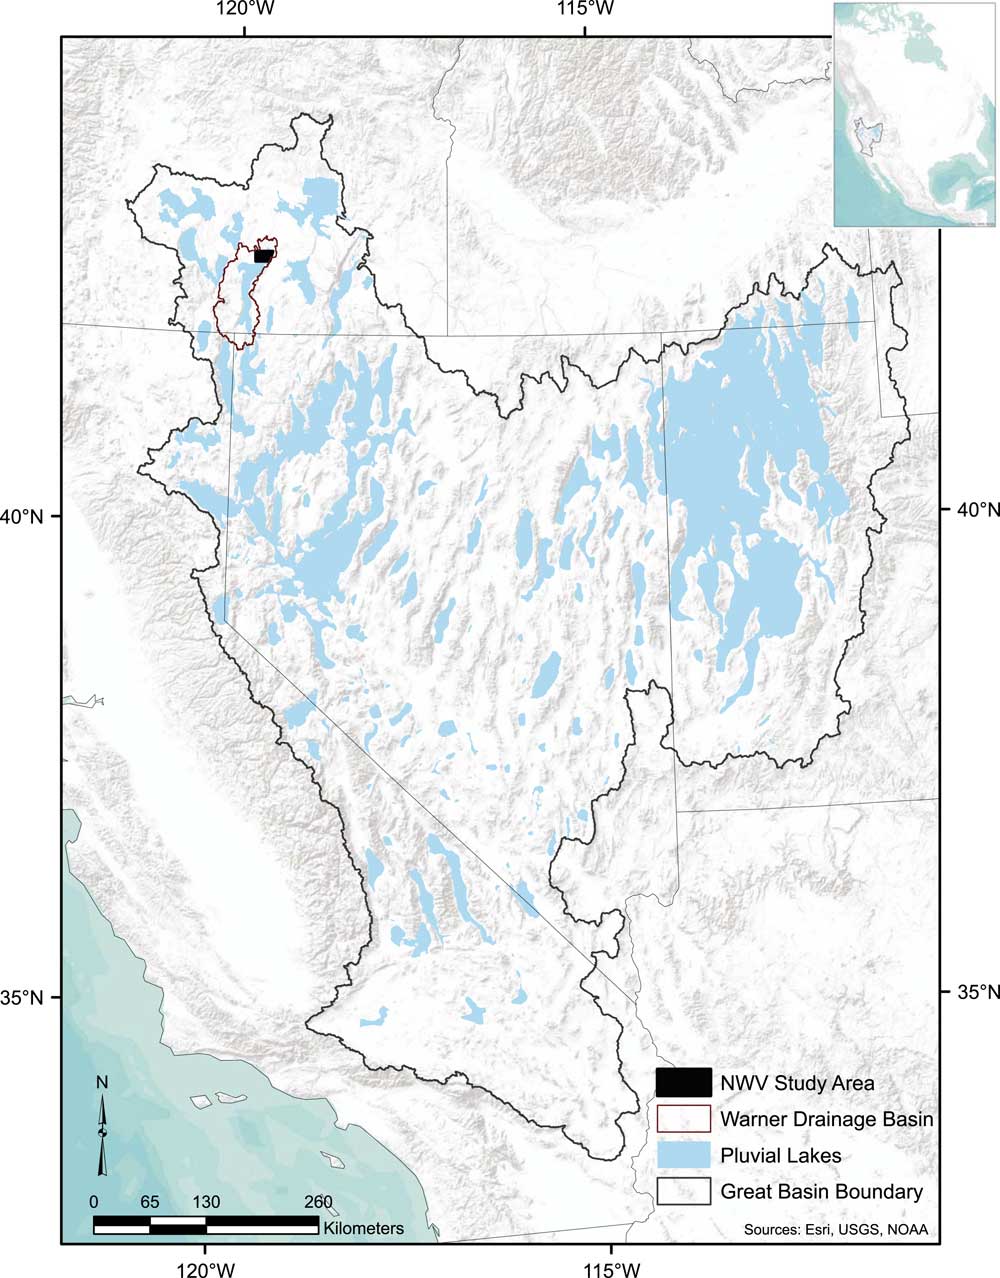
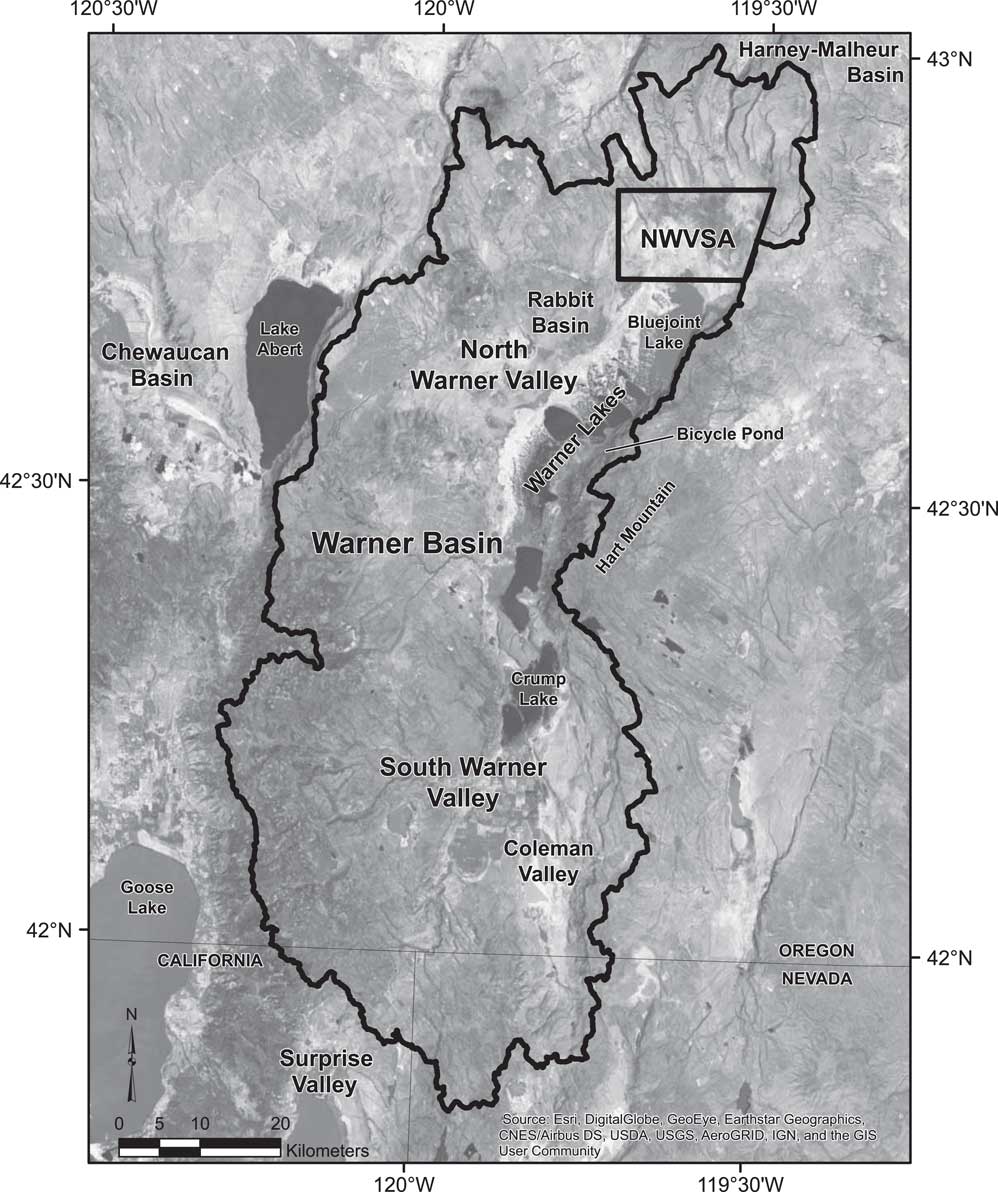
Warner Valley is near the intersection of Oregon, California, and Nevada (Fig. 1). It measures ~135 km north-south by ~50 km east-west and is segmented into Rabbit Basin, North Warner Valley, South Warner Valley, and Coleman Valley (Fig. 2). Warner Basin is confined by a complex graben system formed by north-trending normal faults through volcanic rocks (Personius and Sawyer, Reference Personius and Sawyer2002) that was likely initiated during the middle Miocene (Pezzopane and Weldon, Reference Pezzopane and Weldon1993). Although no fault scarps are known to cut through Quaternary deposits, some Pleistocene shorelines, particularly in Rabbit Basin, exhibit several meters of deformation. Coupled with lineaments across the floor of the basin, this suggests some Quaternary movement along the basin’s western margin (Weide, Reference Weide1975; Craven, Reference Craven1991; Pezzopane, Reference Pezzopane1993; Pezzopane and Weldon, Reference Pezzopane and Weldon1993; Personius and Sawyer, Reference Personius and Sawyer2002; Weldon et al., Reference Weldon, Fletcher, Weldon, Scharer and McCrory2002). Warner Lakes, a chain of small lakes and ponds separated by dunes, straddles the divide between South Warner Valley and North Warner Valley below Hart Mountain. Crump Lake in South Warner Valley (Fig. 2) generally maintains a 1364 m asl water elevation, but water levels decrease northward over the series of lakes, eventually reaching 1360 m asl at Bluejoint Lake in North Warner Valley. This northernmost lake is now often a dry playa.
Overview of the Great Basin with its Pleistocene lakes. Our north Warner Valley study area (NWVSA) is solid black within the outline of the Warner Basin.

Warner Basin with NWVSA outlined and place names discussed in text. Imagery source: ESRI World basemap collected in Terracolor 1/15/1999.

Today, a sagebrush and perennial grass-dominated shrub-steppe environment, with big sagebrush (Artemisia tridentata) and rabbitbrush (Ericameria sp.), covers much of North Warner Valley. At the lowest elevations (~1,360 m asl), greasewood (Sarcobatus sp.) and saltbush (Atriplex sp.) are commonly interspersed between hard pans. In wetter years, these low-lying areas hold water and, as recently as the mid-nineteenth century, shallow marshes north and west of Bluejoint Lake (Fig. 2) supported stands of tule (Schoenoplectus acutus; Whistler and Lewis, Reference Whistler and Lewis1916:32).
As is typical in the Basin and Range, most precipitation and groundwater storage occurs in the mountains, with water flowing toward the basin floor and escaping via evaporation from the lakes and pans (Harrill and Prudic, Reference Harrill and Prudic1989; Oviatt et al., Reference Oviatt, Madsen, Miller, Thompson and McGeehin2015). However, increased precipitation is generally more important than evaporation in lake-level rise (Enzel et al., Reference Enzel, Cayan, Anderson and Wells1989; Mohammed and Tarboton, Reference Mohammed and Tarboton2012; Reheis et al., Reference Reheis, Adams, Oviatt and Bacon2014); therefore, the record of a high lake level may be interpreted as a precipitation and runoff proxy (Oviatt et al., Reference Oviatt, Madsen, Miller, Thompson and McGeehin2015) while maintenance at that level or recession reflects the net balance of precipitation, runoff, and evaporation.
The changing lake depth and its effect on marsh distribution and productivity had an especially important role in the lives of the basin’s prehistoric occupants. Marshes are a good source of foodstuffs for both people and animals (Wheat, Reference Wheat1967; Raymond and Parks, Reference Raymond and Parks1990; Fowler, Reference Fowler1990, Reference Fowler1992; Young, Reference Young1998; Kelly, Reference Kelly2001; Madsen and Kelly, Reference Madsen and Kelly2008) and they require quiet water that is not too shallow or too deep (Raymond and Parks, Reference Raymond and Parks1990; Young, Reference Young1998). Young (Reference Young1998) studied the topography of Warner Basin to identify where the best potential for marshes at various lake depths exists. He found that protected embayments up to 1.5 m deep likely fostered productive marshlands on gradual emerged slopes.
Previous efforts to understand the hydrologic history of Warner Basin have been sporadic and incomplete. Russell (Reference Russell1884) reported that Lake Warner never topped its sill (1464 m asl) across its low northern divide, but Van Winkle (Reference Van Winkle1914) suggested that water may have escaped the basin here. In support of the latter, Stewart (cited in Grover et al., Reference Grover, Parker, Lamb, Baldwin and Henshaw1917: 111) reported that a basaltic dike north of Mule Springs Canyon was waterworn; however, Weide (Reference Weide1975) revisited this feature and describes it as a shallow, narrow channel at an elevation of 1464 m asl that was unlikely to have ever had significant flow.
Weide (Reference Weide1975) conducted one of the earliest and most in-depth studies of Lake Warner’s history, but relied on comparisons with Lake Bonneville and Lake Lahontan histories for temporal control, assuming that the last highstand occurred during the late glacial maximum (LGM) based on information available at that time. Using a constant sediment/peat accumulation rate, Weide (Reference Weide1975) also calculated when marshes were established in the floor of Warner Basin from Hansen’s (Reference Hansen1947) 3.5-m-deep pollen core into Crump Lake. This core revealed well-established peats interbedded with Mazama tephra at a depth of 2.6 m. If Weide’s (Reference Weide1975) calculations are replicated using the calibrated radiocarbon age for Mazama tephra (7600 cal yr BP; Davis, Reference Davis1985; Hallet et al., Reference Dugas1997), then marshes had developed on the basin floor by ca. 10,300 cal yr BP. Given that Crump Lake usually hovers around 1364 m asl, this suggests similar or slightly lower water levels at that time. Other pollen cores spanning 9000 yr from Bicycle Pond (Fig. 2), pooled above the valley in a landslide impoundment below Hart Mountain, show locally wetter conditions during the early Holocene due to increased spring discharge (Wigand and Rhode, Reference Wigand and Rhode2002) even as drier conditions are signaled by the climax of saltbush pollen in Hansen’s (Reference Hansen1947) Crump Lake core and elsewhere in the northwestern Great Basin. The driest period during the Holocene occurred between 8800 and 5600 cal yr BP according to plant macrofossil and pollen evidence from the region (Wigand and Rhode, Reference Wigand and Rhode2002).
More recently, Young (Reference Young1998, Reference Young2000) conducted geoarchaeological investigations within Warner Basin that focused on environmental conditions that effected land use patterns and adaptive strategies of late Holocene Archaic populations. He identified two prominent late Holocene lake highstands in the basin interior: (1) a pre-2000 cal yr BP level of ~1,365.5 m asl, a level that would have merged Warner Lakes into one; and (2) a post-2000 cal yr BP level of ~1,361 m asl that was near the modern level of many of the Warner Lakes. This age separation is based on temporally diagnostic artifacts below 1365.5 m asl, most which are types that post-date ca. 2100 cal yr BP (Young, Reference Young2000). Young (Reference Young1998, Reference Young2000) also described a tephra at approximately 1364.5 m asl as characteristically similar to Mazama, from which he interprets a dry early Holocene (pre-Mazama) based on an underlying unconformity, and a relatively wet middle Holocene.
While work by Weide (Reference Weide1975) and Young (Reference Young1998, Reference Young2000) has greatly contributed to our understanding of the history of Lake Warner, prior to our research no radiocarbon ages or geochemical tephra identifications were available to anchor the late Pleistocene and early Holocene history of the basin. In addition, even though ongoing research in nearby basins has revealed extensive records of Paleoindian occupation (e.g., Willig, Reference Willig1988; Jenkins et al., Reference Jenkins, Davis, Stafford, Campos, Hockett, Jones and Cummings2012), little was known about when and how people first occupied Warner Valley. Here, we present the results of our geoarchaeological and archaeological investigations in North Warner Valley, focusing on both data collected from backhoe trenches (BTs) and the spatial distribution of temporally diagnostic artifacts (i.e., projectile points) at archaeological sites.
METHODS
Our northern Warner Valley study area (NWVSA) covers ~221 km2 of BLM-managed lands (Fig. 2) that encompass multiple physiographic features, including basalt and tuff uplands, relict beach ridges, and the valley floor. We conducted geoarchaeological and archaeological investigations concurrently and, although shoreline features associated with archaeological sites received the most attention, we also studied areas with the potential to help document lake transgressions and regressions within our study area. Over three field seasons, we excavated 37 BTs into various shoreline features, usually targeting the upslope portion of each to increase the likelihood of preserved dateable remains. While we described most trenches unless they were deemed unsafe, not all trenches contained dateable remains or materials important to our interpretations; therefore, we discuss here only those that offered temporal control. Profiles were cleaned to provide a fresh vertical exposure, photographed, sketched, measured, and described using standard geological and soil analyses methods (cf., Birkeland Reference Birkeland1999; Birkeland et al., Reference Birkeland, Machette and Haller1991; Schoeneberger et al., Reference Schoeneberger, Wysocki, Benham and Broderson2002). These methods include: identification, measurement, and characterization of stratigraphic layers (depositional history), soil horizon development, sediment texture, any internal pedogenic structure, ped coatings, Munsell color (dry and moist), reaction to 10% hydrochloric acid (HCl), degree of sorting/roundness, amount and type of organic material and disturbance, and contacts between adjacent horizons or layers. The USDA Guide to Texture by Feel (https://www.nrcs.usda.gov/wps/portal/nrcs/detail/soils/edu/?cid=nrcs142p2_054311) was used to consistently describe field-based soil textures. We interpreted the depositional environment based on observations of grain size, sorting, color, soil development, and context. We gathered trench UTM coordinates using Trimble and Garmin GPS units and established elevation control by tying trench data to nearby USGS benchmarks using a Sokia total station when possible.
We collected tephra, shell, and sediment samples for laboratory analyses, geochemical identification, and accelerator mass spectrometry (AMS) radiocarbon dating. F. Foit of Washington State University’s Geoanalytical Laboratory identified the tephras. Beta Analytic, Inc., and the University of Arizona’s Accelerator Mass Spectrometry Laboratory processed the AMS samples. We used the online Calib 7.1 program (http://calib.org/calib/; Stuiver et al., Reference Stuiver and Reimer1993, Reference Stuiver, Reimer and Reimer2016) to calibrate radiocarbon ages, including those reported by previous researchers from Warner and nearby basins; these are listed in Supplementary Table 1. In the text, we report the median probability calibrated age provided by Calib 7.1 for each date in lieu of calibrated age ranges and report optically stimulated luminescence (OSL) ages as thousands of years ago (ka). The first author (Wriston) classified shells, ostracods, and diatoms using a Hitachi TM-1000 tabletop microscope (20–10,000×), comparative online databases (http://www.personal.kent.edu/~alisonjs/nanode/ [Forester et al., Reference Forester, Smith, Palmer and Curry2015]; https://westerndiatoms.colorado.edu/ [Spaulding et al., Reference Spaulding, Lubinski and Potapova2010]), and other references (Herrington, Reference Herrington1962; Burch, Reference Burch1972, Reference Burch1982; Burch and Tottenham, Reference Burch and Tottenham1980; Delorme, Reference Delorme2001; Schmid and Crawford, Reference Schmid and Crawford2001; Taylor, Reference Taylor1981). We examined selected shell samples for secondary carbonates before submission for radiocarbon dating. All selected shells were aggressively pre-treated with acid to dissolve over 50% of their weight before dating. Given that no carbonate-rich geologic deposits are found within Warner Valley, we do not anticipate a hard water effect on radiocarbon ages obtained from aquatic shells.
We derived contours and cross section profiles using ESRI’s ArcGIS contour and 3-D Analyst line/profile tools applied to the 10-m National Elevation Dataset (NED) data (http://viewer.nationalmap.gov/basic/). We did not apply any correction for rebound or tectonic movement given that the contours trace shoreline features on aerial imagery within an acceptable range of error (within a few meters in northern and southern Warner Valley) for the goals of our study. We used USGS and USDA hydrological data sets (http://viewer.nationalmap.gov/viewer/nhd.html?p=nhd) in drainage basin area calculations with modification to represent Warner Basin’s hydrology during the lake’s maximum extent. We calculated changes in surface area and lake volume in ArcGIS using the 10-m NED dataset. We did not apply any corrections for sediment fill and dune-and-slough topographic development or sediment displacement from the floor of the basin via wind activity, although these factors may affect volume calculation accuracy (Currey, Reference Currey1990).
We coupled topographic maps and aerial imagery with cross section profiles to analyze shoreline feature location and elevation. Given that constructional features (e.g., beach ridges and bars) can form very quickly (Adams and Wesnousky, Reference Adams and Wesnousky1998; Oviatt et al., Reference Oviatt, Madsen, Miller, Thompson and McGeehin2015), we used wave-cuts or cross section nickpoints to represent still stands. Although we recognize that some of these features may be remnants from previous lake cycles, wave-cuts take time to form and are presumably more representative of long-term lake levels than beach ridges created by storms, which reflect wave height (Taylor and Stone, Reference Taylor and Stone1996). A sample of cross section profiles around the lake aided in determining which nickpoints were most common. Following Adams and Wesnousky (Reference Adams and Wesnousky1998) and Reheis et al. (Reference Reheis, Adams, Oviatt and Bacon2014), we assume that shoreline elevation can be expected to vary at least 1 m below and up to 3 m above these still stands due to differences in substrate, sediment supply, fetch, and topographic location; therefore, these shore zones encompass 4 m around each still stand.
RESULTS AND DISCUSSION
Lake Warner
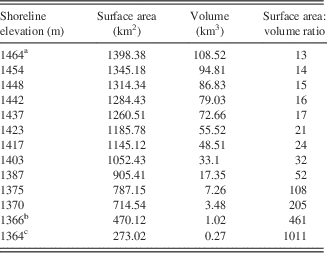
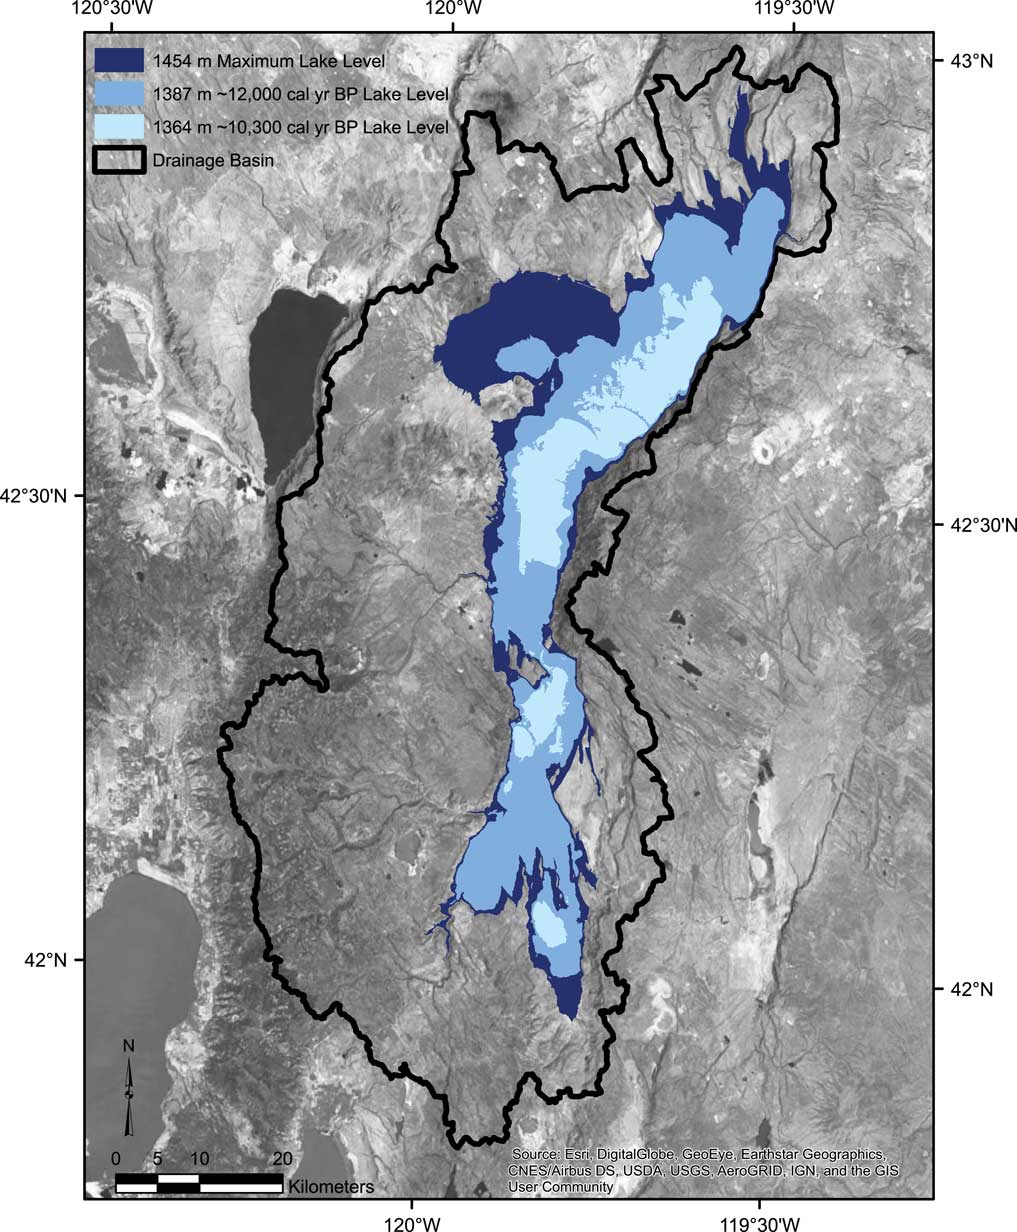
The drainage basin that fed Lake Warner covers 4,912 km2 (Figs. 1 and 2). Based on field visits and examination of aerial imagery and topographic maps, the sill separating Warner Basin from the Harney-Malheur Basin (Fig. 2) is at 1464 m asl, while the highest shoreline features (constructional gravel beach ridges) are at 1454 m asl (with one exception discussed below), with more regular occurrence at 1452–1453 m asl. The highest wave-cut shoreline straddles 1448 m asl, suggesting only brief transgression(s) to higher elevations even though the 1454 m asl constructional shoreline features occur on all shores. At 1454 m asl, Lake Warner would have covered 1,345 km2 and had a volume of 95 km3 (Table 1). We found no evidence that Lake Warner topped its 1464 m asl sill and emptied into the Harney-Malheur Basin during the late Pleistocene.
Lake Warner surface area and volume changes at selected elevations. The surface area to volume ratio provides a simple illustration of how quickly the lake would have responded to changes in precipitation and/or evaporation at different elevations, with higher ratios having quicker response

a, sill level; b, basin floor filled; c, near modern.
On the northern shore of Rabbit Basin, there is an anomalously high (1461 m asl), very weathered gravel beach ridge visible for a limited extent above the distinct, relatively unweathered gravel beach ridge at 1454 m asl that corresponds to the highest shoreline features elsewhere in Warner Valley. This old weathered beach ridge predates the latest highstand and, given its limited extent and lack of shoreline features at similar elevation throughout the remainder of the basin, suggests that 7+ m of tectonic deformation has occurred in this area between the lake’s previous highstand and the most recent one. Below Rabbit Basin and within the floor of Warner Valley, historic large earthquakes (Patton, Reference Patton1985; Pezzopane and Weldon, Reference Pezzopane and Weldon1993; Weldon et al., Reference Weldon, Fletcher, Weldon, Scharer and McCrory2002) show continued activity but minimal deformation.
Shore zones
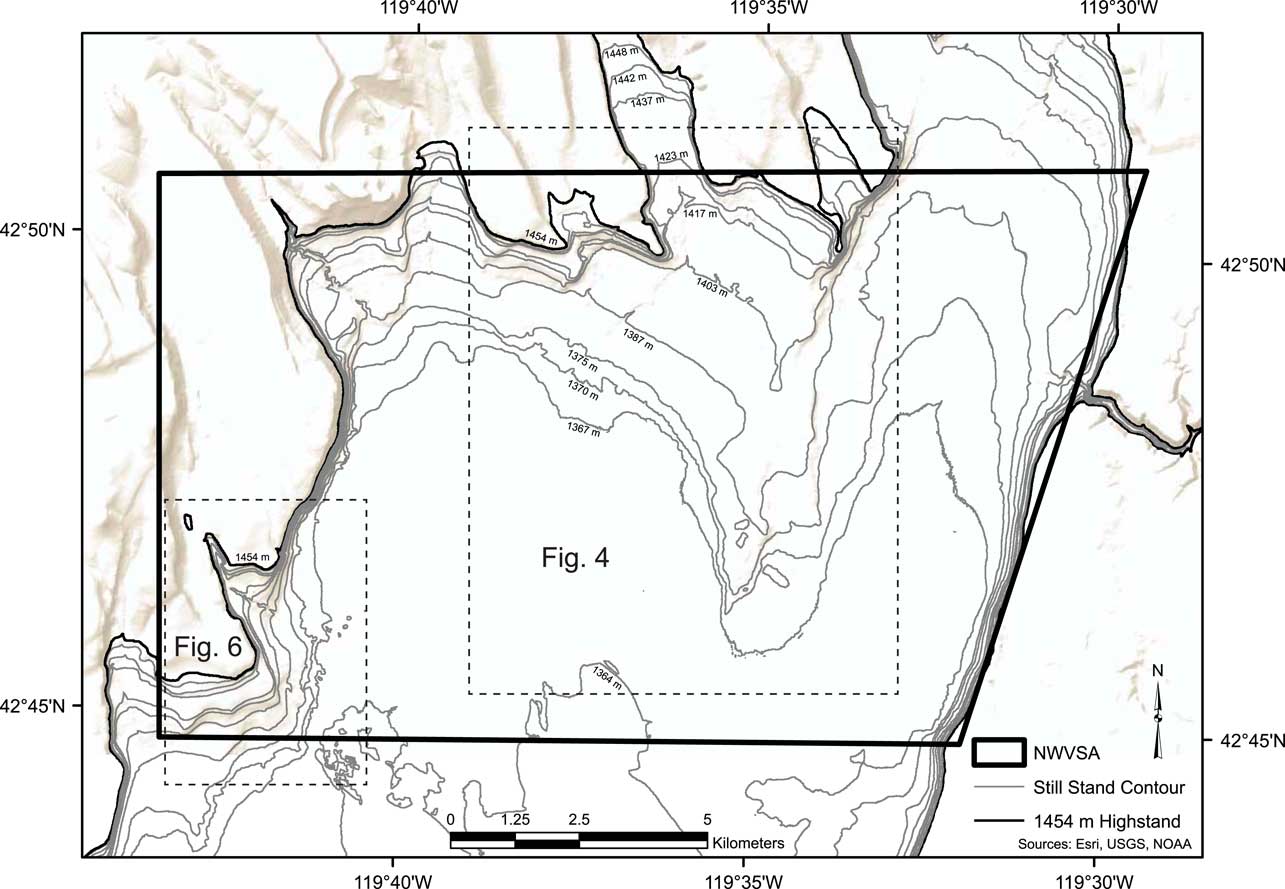
At least nine erosional wave-cut terraces mark still stands of sufficient duration to erode bedrock steps in the tuff and basalt shorelines and construct beach ridges. These shore zones can be traced around the basin margin and are, from highest to lowest, at 1448, 1442, 1437, 1423, 1417, 1403, 1387, 1375, and 1370 m asl (Fig. 3, Table 1). Over 20 constructional shoreline features (e.g., gravel beach ridges) are discernable on windward gradual slopes with abundant sediment supply, but as noted above, wave-cuts take longer to form and are presumably better indicators of relatively stable lake levels useful for regional comparisons. Although we determined these still stand levels independently, they generally correspond to those identified by Weide (Reference Weide1975). One important difference is that Weide (Reference Weide1975) postulated that up to 12 m of south-to-north tectonic displacement has occurred since the last highstand. He cited the anomalously high 1461 m shoreline at the north end of Rabbit Basin discussed above as support for that possibility, which accounts for 7 of the 12 m of displacement. Otherwise, based on examination of aerial imagery and 1-m digital elevation models, we found good correspondence of shorelines throughout the basin, which suggests that, contrary to Weide’s (Reference Weide1975) suggestion, no major tectonic deformation has occurred since the latest highstand of Lake Warner.

Two of the nine shore zones may relate more to changes in basin bathymetry than environmental conditions. As water rises from the floor, it begins to spread into Coleman Valley at just above 1368 m asl; water expands into Rabbit Basin above 1384 m asl. As Table 1 shows, these shore zones represent major changes in volume and surface area. As surface area increases relative to depth/volume, evaporative potential increases. Here, we use a simplified surface area to volume ratio to represent the lake’s responsiveness to changes in precipitation, temperature, cloud cover, wind, and seasonality. The higher the ratio of surface area to volume, the more reactive lake levels should be in response to changing environmental conditions unless there is a substantial groundwater contributor. This is especially true for areas with shallow slope basin bathymetry (Weide, Reference Weide1975) such as the NWVSA.
Stratigraphic evidence
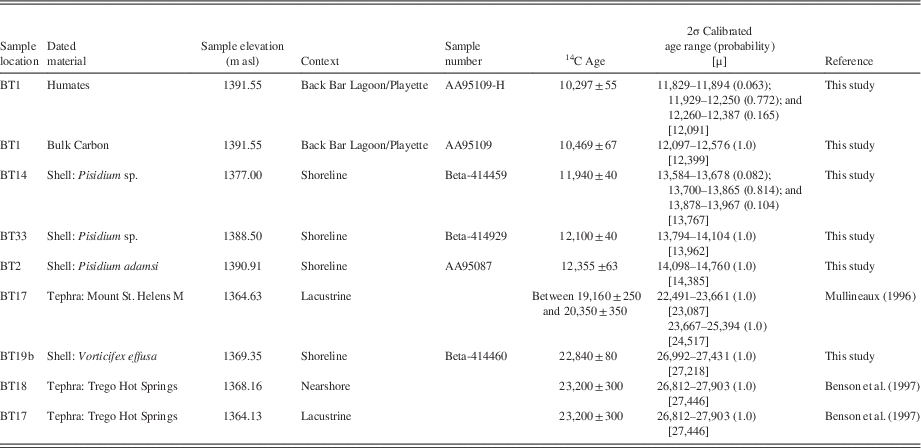
Of the 37 BTs excavated for our research, only seven offer temporal control relevant to our lake level reconstructions (Table 2). These include BT1, BT2, BT14, BT17, BT18, BT19b, and BT33, each of which is described below.
North Warner Valley study area (NWVSA) geochronological data

Northern Shore trenches
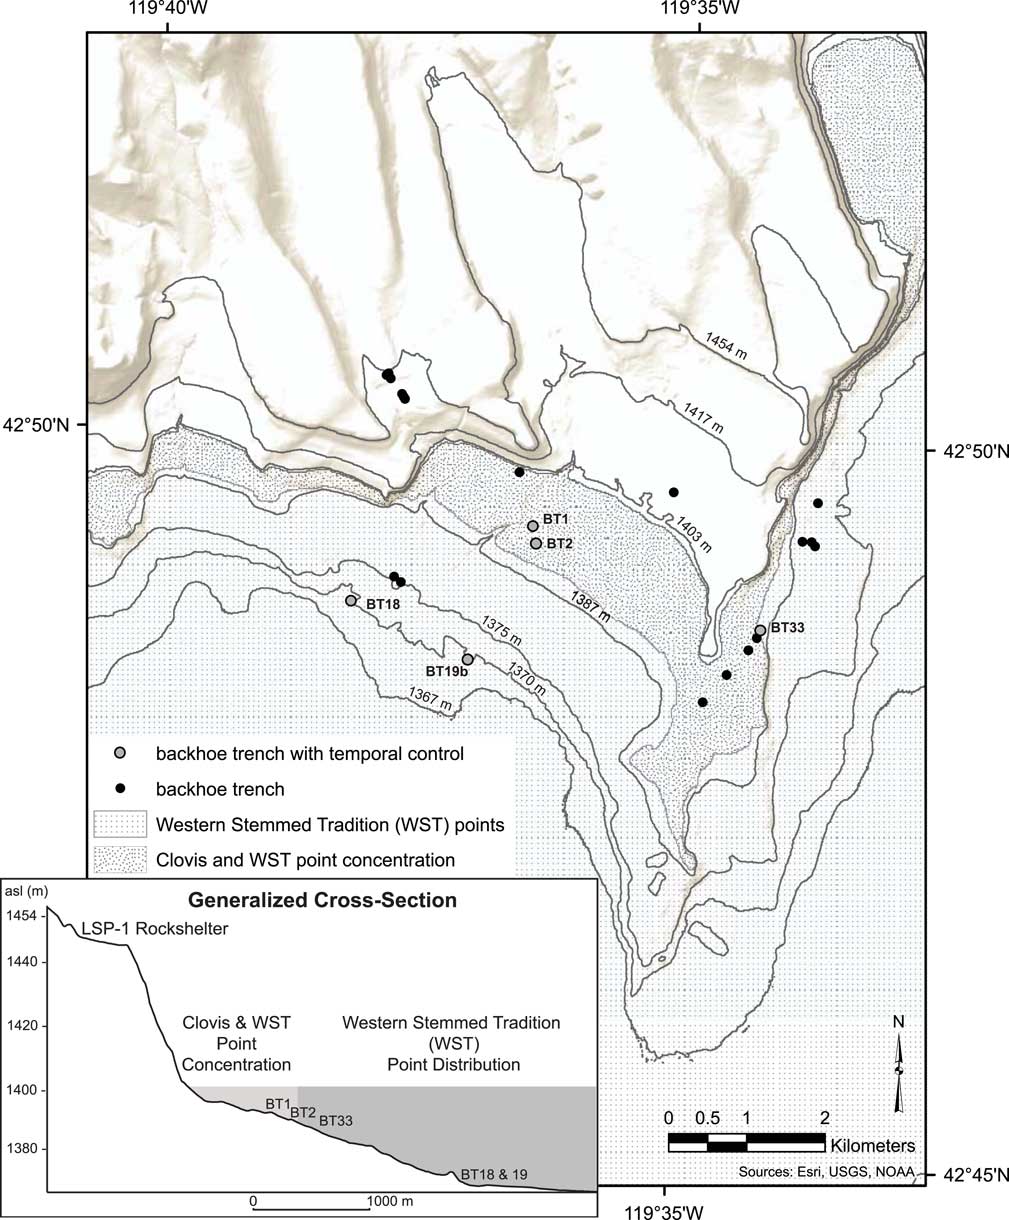
BT1, BT2, BT18, BT19b, and BT33 were excavated into the gradual slope on the northern margin of the lake (Fig. 4). This shore has a series of gravel beach ridges created during Lake Warner’s regression. BT1 and BT2 were excavated on the mid-to-lower slope, and we determined after archaeological survey that they are closely associated with the elevation of archaeological sites containing WST and Clovis projectile points (Smith et al., Reference Smith, Felling, Wriston and Pattee2015).
Northern shore of NWVSA with excavated trench locations. Those discussed in text are numbered and included on a generalized cross section to show their relative shoreline elevation and the relatively gradual slope on this side of the basin. The vertical distribution of Clovis and Western Stemmed Tradition (WST) point types shows that Clovis types are restricted to the moderately high shorezones, while WST types are there and continue lower into the basin.

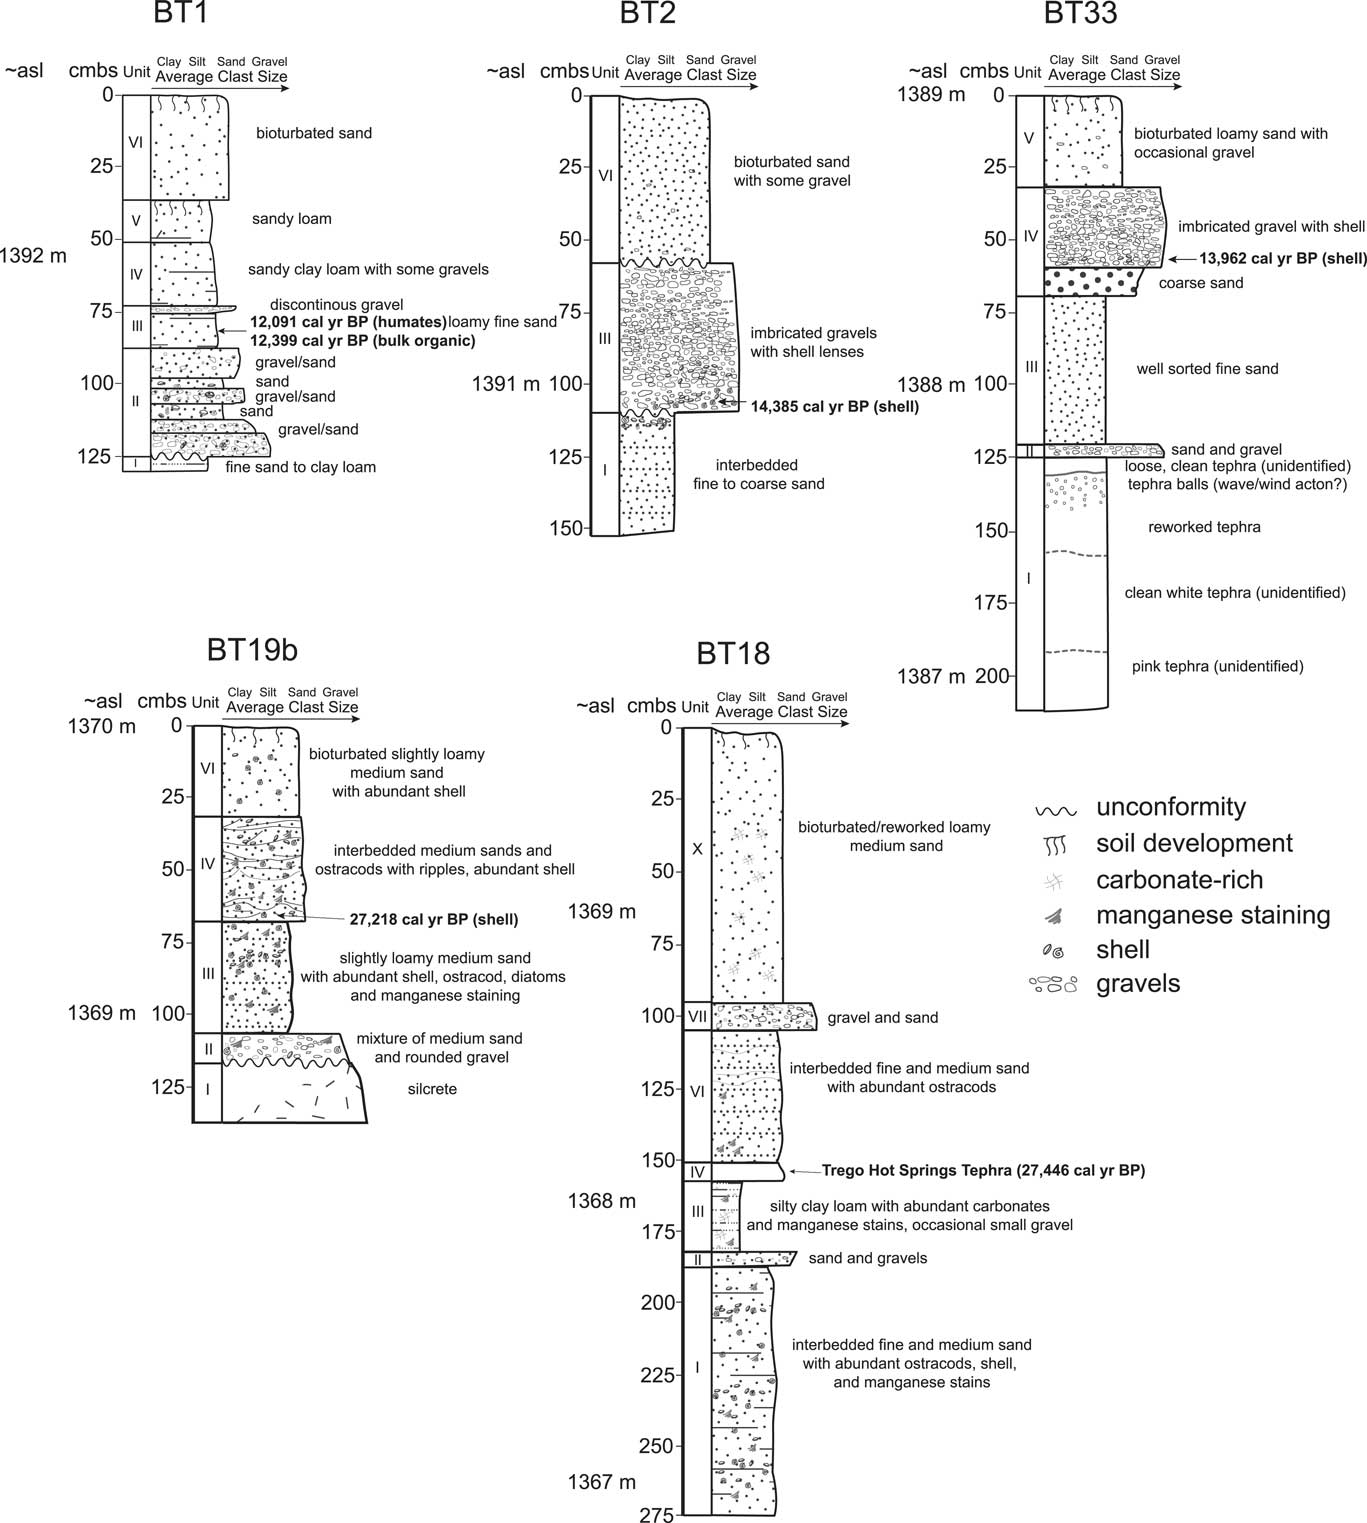
BT1 (Fig. 4 and 5) was excavated into the upper slope of a beach ridge at 1394 m asl. It exposed lacustrine fine-grained sediments at its base topped by lakeward dipping gravels. In the trough between the upslope and downslope beach ridges, loamy fine sands accumulated as overwash while the lake level was at 1392 m asl and continued to accumulate in lagoon conditions with the protection of the lakeward gravel beach ridge. The deposits are relatively organic-rich, with reduction features suggesting emergent marsh conditions. The marsh was probably short-lived and formed a ring around the northern shore while the lake remained high; however, it may have persisted in some form (e.g., a playette) after the lake receded with seasonal input from a nearby drainage, at least until floodwaters were of sufficient strength to cut through the impounding bar gravels and sediments. Sediment from this layer was dated to 12,399 cal yr BP (10,469±67 14C yr BP, bulk organic, AA95109 [Smith et al., Reference Smith, Felling, Wriston and Pattee2015]) and 12,091 cal yr BP (10,297±55 14C yr BP, humates, AA95109-H [Smith et al., Reference Smith, Felling, Wriston and Pattee2015]). As a soil date, we expect this age reflects when the sediments were sufficiently buried to limit younger carbon input. Based on this age and the character of overlying deposits, the lake level stayed below 1392 m asl after ca. 12,000 cal yr BP.
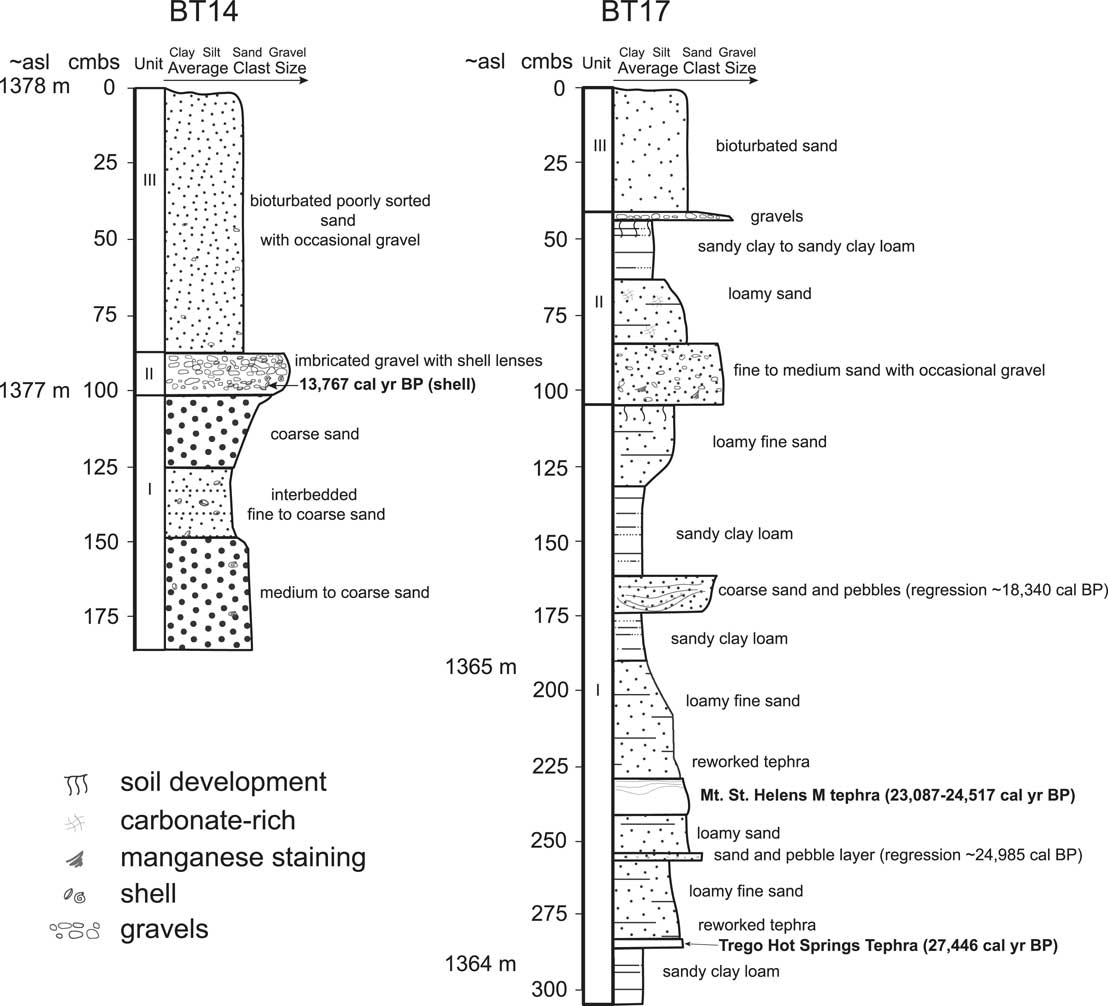
Northern shore backhoe trench logs. Elevations shown in meters above mean sea level (asl) and in cm below surface (cmbs).

Lakeward, the beach ridge exposed in BT1, is comprised of imbricated gravel layers separated by sand lenses. The top of the trench exposed aeolian sands and sandy loams with extensive bioturbation. A weak soil separates these sands into lower and upper strata. The basin floor is the probable sediment supply for the aeolian deposits, indicating that it was dry when the sand was transported. The soil separating the two packages reflects a period of stability and perhaps a lake transgression sufficient to cover the basin floor (~1367 m) below the trench, limiting sediment supply. After the lake regressed again, aeolian transport of basin sediments resumed, depositing the upper sands.
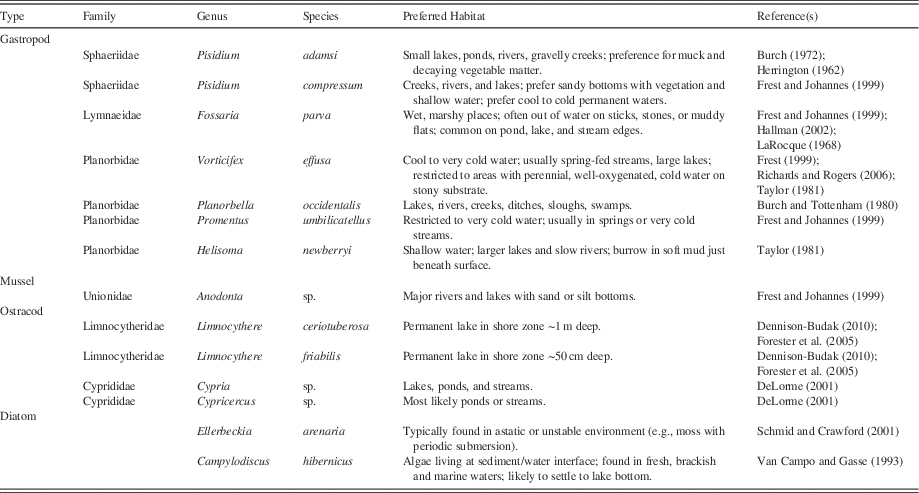
BT2 (Figs. 4 and 5) was excavated in the trough between the beach ridge profiled in BT1 and the one downslope at 1392 m asl. The base of the trough, which is not portrayed in Fig. 5, has dense gravels covered by clean, coarse beach sands with abundant shells, including those of Adam Peaclam (Pisidium adamsi), Pygmy Fossaria (Fossaria parva), and Artemesian Rams-horn (Vorticifex effusa), all typically found in shoreline environments (Table 3). Further towards the beach ridge crest (Fig. 5), fine sand interbedded with occasional lenses of pebbles or coarse sand is preserved but is abruptly truncated at an oblique angle towards the trough. The bulk of these fine sands were deposited horizontally and below storm wave turbulence, suggesting a lake level exceeding 1394 m asl; however, lenses of small gravels and pebbles with abundant P. adamsi shells suggest periodic lake recessions as the top of the stratum was laid down. The truncation of these sands was likely by back bar channel activity that drained westward. This truncation marks an unconformity that extends across the trench and it is covered by overwash gravels of the most recent beach ridge. Continued channel activity in the trough is suggested by alluvial reworking of gravels and sands into channel swales cutting parallel into the beach ridge.
Identified invertebrate environmental preferences

Within imbricated gravels near the beach ridge crest, two areas with dense shell lenses were sampled. These contained V. effusa, P. adamsi, Great Basin Rams-horn (Helisoma newberryi), F. parva, Ridgedbeak Peaclam (Pisidium compressum), and Promentus umbiliatellus, all typical of lakeshore environments in the region. A P. adamsi shell from the beach gravels at 1390.91 m asl was AMS dated to 14,385 cal yr BP (12,355±63 14C yr BP, AA95087). Gravels continued to accumulate on top of this shell, reaching 1391.4 m asl before the lake receded and aeolian accumulation of sand began. The sand is poorly sorted due to extensive bioturbation by plants and animals, with numerous beach gravels worked upwards into the stratum; however, in the northern portion of the trench (not portrayed in Fig. 5) two sand strata can be differentiated due to the presence of reworked tephra (unidentified) in the lower package. As in BT1, these aeolian sands were likely deposited during periods of low lake levels that freed basin floor sediments for transport.
BT18 was excavated into the landward slope of the lowest (1370 m asl) gravel beach ridge on the northern shore (Figs. 4 and 5). The base of the trench contains lacustrine nearshore deposits of alternating well-sorted fine and medium sand with manganese staining. Dense ostracod layers of Limnocythere ceriotuberosa, Limnocythere friabilis, and possible Cypria sp. or Cypricercus sp. are found among the sands that are also rich in bivalve and snail shells, including P. compressum, P. adamsi, F. parva, and V. effusa. A single diatom was identified as Ellerbeckia arenaria. Taken together, these corroborate a shallow water depositional context near the lake margin (Table 3), which would have been ~1368.5 m asl. This is topped by a thin 5 cm layer of clean coarse sand with gravel and pebbles deposited along a beach front during a brief lake regression before silty clay loam deposits began accumulating. These fine-grained deposits likely formed in a relatively large back bar lagoon, with many vertical in-filled root casts, manganese stains, and abundant calcium carbonate. Occasional pebbles were also noted. Trego Hot Springs tephra fell into these waters ca. 27,446 cal yr BP (Benson et al., Reference Benson, Smoot, Kashgarian, Sarna Wojcicki and Burdett1997, but see Benson et al., Reference Benson, Smoot, Lund, Mensing, Foit and Rye2013; we prefer the 1997 radiocarbon age constrained curve to the 2013 GISP2 comparison given that we are comparing radiocarbon dates), depositing a clean, white, 5–10-cm thick horizontal bed of tephra on the lagoon’s floor. The water was sufficiently deep to protect the tephra layer while manganese-rich interbedded fine and medium sands containing dense ostracod layers were deposited atop it. The ostracods are dominated by L. ceriotuberosa and wave ripples are evident in the sand. Together, this information suggests that the lagoon and the adjacent lake were between ~1369 to 1370 m asl. Over 50 cm of alternating fine and medium sand layers with lenses of ostracods accumulated before a layer of gravel and sand was deposited by lake waters transgressing over the gravel beach ridge protecting the lagoon. These gravels increase in size and abundance on the lakeward side of the trench. Loamy medium sand continued to accumulate for another 70 cm. This sand is extensively bioturbated, is rich in calcium carbonate, and topped by very loose aeolian sand with a weakly developed modern soil.
We excavated BT19b (Figs. 4 and 5) into the lakeward slope of the lowest gravel beach ridge remnant at 1370 m asl. The base of the trench is nearly silcrete with abundant manganese staining on its fine-grained, hard platy surfaces. The deposit’s abundant ostracods include L. ceriotuberosa, L. friablis, and either Cypria sp. or Cypricercus sp. Three types of diatoms were noted but only Campylodiscus hibernicus was positively identified. These fine-grained deposits relate to an older lake cycle and are overlain unconformably at 1368.9 m asl by medium sand with occasional gravel and shells. Above the unconformity a nearly complete 5-cm-long freshwater mussel (Anodonta sp.) bivalve was noted within a burrowed trail. Ostracods from the overlying slightly loamy medium sands were identified as L. ceriotuberosa and either Cypria sp. or Cypricercus sp. The only diatom type present is C. hibernicus. The top of this stratum is manganese stained, loose, and has abundant shell and ostracod beds.
At 1369.35 m asl, the sands transition to wave ripples formed in a shallow nearshore environment. A V. effusa shell was extracted from these deposits and AMS dated to 27,218 cal yr BP (22,840±80 14C yr BP, Beta 414460). Other identified shells include P. compressum and F. parva. Ostracods include L. ceriotuberosa and L. friabilis, and the single diatom type C. hibernicus. The wave forms are covered by 5–10 cm of massive medium sand, suggesting a change in lake level before wave ripples again form in medium sand deposits interbedded with ostracod lenses to 1369.65 m asl. These upper ripples include beds of L. ceriotuberosa and either Cypria sp. or Cypricercus sp. ostracods. Medium sands continued to accumulate to the trench’s surface at 1370 m asl, but the upper 40 cm is loamier and extensively bioturbated due to subaerial exposure of these relict nearshore deposits. These sands contain many shells, including examples of F. parva and V. effusa, ostracods L. ceriotuberosa and either Cypria sp. or Cypricercus sp., and C. hibernicus diatoms. A weakly developed soil is formed on the modern surface.
BT33 (Figs. 4 and 5) was excavated at 1389 m asl into the leeward slope of bedrock jutting into the lake’s northern shore. Over 80 cm of tephra with secondary alteration is present at the base of BT33. The lowest tephra is pink in color before transitioning to clean white tephra mid-deposit. In its top 30 cm, the lower tephra stratum has abundant 0.5–1.0 cm-diameter silica-coated tephra balls created by rolling in wind or water. Another 7 cm of clean white tephra was deposited on top of the lower tephra. These tephras remain unidentified but are surprisingly thick, spanning 1386.9–1387.7 m asl. We used a tabletop scanning electron microscope (SEM) to verify that diatoms are not a contributing component of these strata. These tephras are likely aeolian accumulations of the Trego Hot Springs and/or Mount St. Helens M tephras identified in the BT17 and BT18 trenches. A large infilled root cast indicates that the tephra was at the surface for some time before a thin bed of poorly sorted sand and gravels was deposited on top of it. This sand and gravel layer was laid down during a rise in the lake given that it is topped by clean fine sand that gives way to well-sorted coarse beach sand and then imbricated beach ridge gravels. A Pisidium sp. bivalve shell found at 1388.5 m asl within the imbricated beach gravels was AMS dated to 13,962 cal yr BP (12,100±40 14C yr BP, Beta 414929). Poorly sorted loamy alluvial sands with gravels characterize the top of the section deposited after the lake receded.
Western Shore trenches
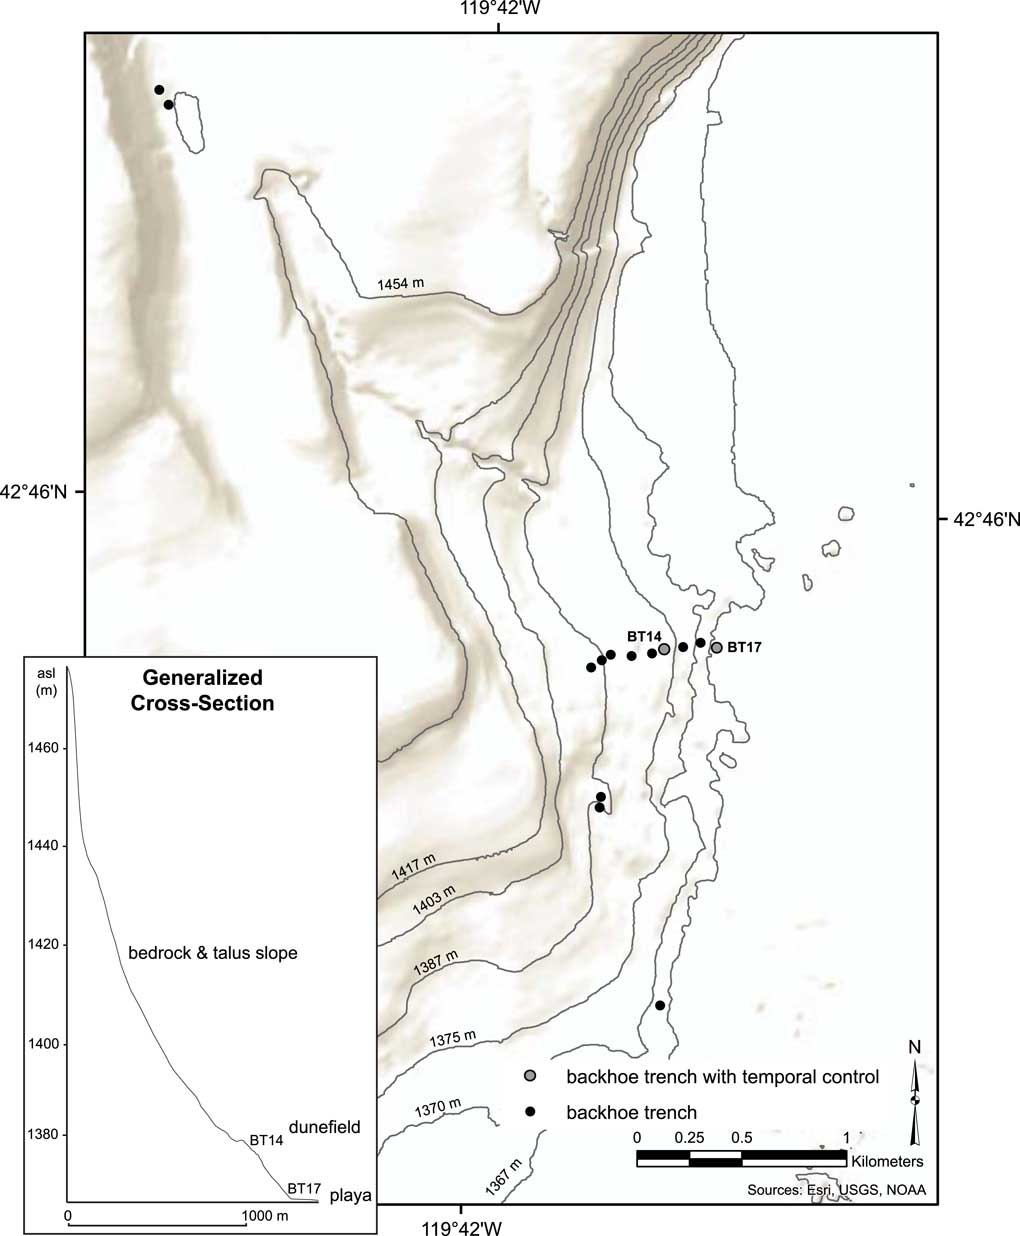
We excavated 12 trenches on the lake’s western shoreline (Fig. 6). There, a bedrock ridge extends into the basin and separates Rabbit Basin from North Warner Valley. The ridge blocks winds from the south and forms a slight embayment. A series of trenches excavated into this embayment’s northeast-facing slope exposed large cobbles and boulders in its upper shores, reworked sand and gravels topped by dunes mid-slope, and relict lacustrine fine-grained deposits near the basin floor. The western shore is steeper than the northern shore and water would have quickly deepened over a relatively short distance when the lake rose (Fig. 6). We describe the most relevant trenches, BT14 and BT17, below.
Western shore of NWVSA with excavated trench locations. Those discussed in text are numbered and included on a generalized cross section to show their relative shoreline elevation and the relatively steep slope on this side of the basin.

BT14 (Figs. 6 and 7) was excavated into an interdunal swale at 1378 m asl. The base of BT14 is medium to coarse beach sand with an occasional Pisidium sp. shell. A fine crusty sand layer separates it and the overlying sand. These sands, which alternate between fine- and medium-grained, contain occasional bivalve shells and were deposited in nearshore context. Clean, coarse and loose beach sand covers them before 12 cm of small beach gravels were deposited on the shore. A Pisidium sp. bivalve shell was retrieved from the base of these gravels and AMS dated to 13,767 cal yr BP (11,940±40 14C yr BP, Beta-414459). On top of the gravels are bioturbated, poorly sorted sands with occasional gravels. These are primarily reworked beach and nearshore sand, but with inputs of aeolian and alluvial fine sand and silt, and occasional gravels either worked up from below or deposited during a later transgression and subsequently bioturbated.
Western shore backhoe trench logs. Elevations shown in meters above mean sea level (m asl) and in cm below surface (cmbs).

We placed BT17 (Figs. 6 and 7) lakeward of the western shore dunes at 1367 m asl. Sandy clay loam laid down in deep quiet water is at the base of BT17. These lake muds are topped with a 5-cm-thick horizontal layer of clean white Trego Hot Springs tephra (27,446 cal yr BP; 23,200±300 14C yr BP [Benson et al., Reference Benson, Smoot, Kashgarian, Sarna Wojcicki and Burdett1997]) at 1364.23 m asl. Reworked tephra and loamy fine sand continued to be deposited until lenses of sand and small pebbles became frequent, indicating that the lake regressed sufficiently to introduce turbulent flow. The lake later transgressed and deposited loamy fine sand before a 12-cm-thick horizontal layer of clean white tephra was deposited at 1364.63 m asl. This tephra was identified as Mount St. Helens M, dated to between 23,087 and 24,517 cal yr BP (19,160±250 and 20,350±350 14C yr BP [Mullineaux, Reference Mullineaux1996]). Atop the Mount St. Helens M tephra, reworked tephra and loamy fine sand transition to sandy clay loam, again suggesting that the lake deepened. These lake bottom muds are interrupted by 15 cm of wave ripple deposits of coarse sand and pebbles at 1365.3 m asl before sandy clay loam deposits were again deposited in deeper water. This deposition continued but was truncated by an unconformity at 1365.9 m. These relict lake deposits weathered for some time, with weak platy soil structure developing at its surface. Poorly sorted gray sand containing occasional manganese-coated subrounded gravel covered the old lake deposits. These are probably beach sands deposited during a lake transgression, but grade to calcium carbonate-rich loamy sand topped by sandy-clay to sandy-clay-loam playette (a miniature playa where fine-grained material accumulates during seasonal inundation in vegetation-free swales) deposits. This playette has a single coarse gravel layer on its weathered surface at 1366.5 m asl that was covered over by an aeolian sand sheet. This sand sheet has been bioturbated by many plants and animal burrows. Unfortunately, except for the identified tephras, no dateable material was recovered from BT17; however, these quiet, deep-water deposits suggest that the lake stayed above ~1367 m (filling the valley floor) for a long period of time. Further support of this scenario was observed in nearby and upslope BT16, which contained reworked tephra that is likely Trego Hot Springs and/or Mount St. Helens M in beach sands at 1368.5 m asl.
Although imprecise, if we use the deposits between the dated tephras to calculate a general sediment accumulation rate, then 40 cm of deposits accounts for an average of 91 years per cm of deposition between 27,446 and 23,802 cal yr BP (mean age of Mount St. Helens M tephra). If we then assume that this rate was relatively constant and subtract the width of the tephras, it suggests that the lake remained above 1367 m asl for 11,375 years above the highest tephra to deposit another 125 cm of lacustrine sediments before water levels permanently receded. This would mean that the lake level remained above 1367 m asl until at least ca. 12,427 cal yr BP with two exceptions. Assuming the same sedimentation rate, the nearshore wave ripples and pebbles above the Mount St. Helens M tephra would approximate 18,340 cal yr BP, while those between the tephras would approximate 24,985 cal yr BP, signaling recessions to around 1365–1366 m asl before quickly rebounding.
Stratigraphic summary
In sum, the stratigraphic evidence has shown that Lake Warner filled the basin floor by ca. 30,000 cal yr BP, before Trego Hot Springs tephra (27,446 cal yr BP) fell into waters that reached around 1370 m asl. This estimation is based on a 27,218 cal yr BP age on shell in nearshore deposits at 1369.35 m asl (BT19b), and Trego Hot Springs tephra that tops lacustrine sandy clay loam at 1364.23 m asl (BT17) and that is within lagoonal deposits at ~1368.15 m asl (BT18). In each case, water-laid sediments underlie and overlie these temporally constrained deposits. A slight regression ca. 24,985 cal BP to ~1365 m asl is evidenced by a sand and pebble layer intruding in lacustrine loamy fine sands at ~1364.4 m asl (BT17). The lake deepened again and Mount St. Helens M tephra (23,087–24,517 cal yr BP) fell into lacustrine sediments at 1364.63 m asl (BT17). Another regression to approximately 1366 m asl at ca. 18,340 cal BP is suggested by nearshore coarse sand and pebbles in wave forms at ~1365.3 m asl (BT17). The lake transgressed after this time, and deep water is suggested by the lacustrine muds being deposited at ~1365.5 m asl (BT17). Between ~18,340 and 14,385 cal yr BP, the maximum highstand of Lake Warner occurred when its waters reached 1454 m asl briefly before beginning a step-wise recession. By 14,385 cal yr BP, the lake was depositing gravel beach ridges just above 1391 m asl (BT2) and, by 13,962 cal yr BP, it was depositing similar gravel beach ridges at ~1388.5 m asl (BT33). The water was down to 1377 m asl by 13,767 cal yr BP (BT14), but likely transgressed to around 1391 m asl once more. A soil developed on lagoonal sediments (BT1) dates to ~12,250 cal yr BP, and its context reveals that the waters of Lake Warner never again exceeded 1391 m asl. Based on the previous work of Weide (Reference Weide1975) and Hansen (Reference Hansen1947), we know that marsh began to thrive around 1364 m asl ca. 10,300 cal yr BP after the waters of Lake Warner had receded into the valley floor. Beginning around this time and continuing throughout the Holocene, subaerial erosion and reworking of the old lake deposits transformed the study area and swept away much of its Holocene record.
Archaeological evidence
The distribution of temporally diagnostic projectile points discovered along relict shorelines and within the basin, as well as radiocarbon ages and sediment types from nearby rockshelter excavations, provide archaeological evidence of where the lake may have been when people occupied the area (c.f., Adams et al., Reference Adams, Goebel, Graf, Smith, Camp, Briggs and Rhode2008). Such artifacts offer minimum ages of the shoreline features upon which they rest and maximum ages for associated lake levels if the artifacts are not waterworn. For instance, we found the oldest point types in the Great Basin, WST and Clovis projectile points (ca. 14,000–8900 cal yr BP [Jenkins et al., Reference Jenkins, Davis, Stafford, Campos, Hockett, Jones and Cummings2012; Jones and Beck, Reference Jones and Beck2012]), clustered along or just above shorelines that postdate ca. 14,385 cal yr BP (Fig. 4). In order to protect the archaeological sites from looting and vandalism, we do not show the precise locations of the sites, but rather illustrate their elevation range.
Given that the earliest well-accepted evidence of human occupation (ca. 14,000 cal yr BP) in the Great Basin was found at the Paisley Five Mile Point Caves in the nearby Chewaucan Basin (Jenkins et al., Reference Jenkins, Davis, Stafford, Campos, Connoly, Cummings and Hofreiter2013), the Lake Warner shorelines dated to between 14,385 and 12,091 cal yr BP were likely targets of early groups moving through the region. These shorelines would have provided critical resources, including waterfowl, fish, small mammals, and cattail or tule in a ring of emergent marsh growing in protected back bar lagoons. A nearby drainage and lake waters would have also attracted larger game such as pronghorn, mule deer, bison, and possibly camel and horse. Paleoindians probably visited on a seasonal or annual basis much like groups did during historic times (Kelly, Reference Kelly1932; Couture et al., Reference Couture, Ricks and Housley1986; Cannon et al., Reference Cannon, Creger, Fowler, Hattori and Ricks1990), following the lake’s downward trend year-to-year. Nevertheless, groups using Clovis points stopped visiting the NWVSA before the lake reached its modern levels (Smith et al., Reference Smith, Felling, Wriston and Pattee2015). Evidence for their visits is restricted to above 1369 m, when the lake covered the basin floor, and most are between 1390 and 1400 m asl (Smith et al., Reference Smith, Felling, Wriston and Pattee2015). Clovis points fell out of use ca. 12,800 cal yr BP elsewhere in North America (Waters and Stafford, Reference Waters and Stafford2007) and, presumably, in the Great Basin. People continued to occupy the NWVSA, discarding WST points on the basin floor and along the shores of the small remnant lakes well into the early Holocene before those points fell out of use ca. 8,900 cal yr BP (Jones and Beck, Reference Jones and Beck2012). In short, the vertical distribution of these diagnostic artifact types suggest that Lake Warner receded from the northern shorelines (above 1369 m asl) to the modern lakeshores (~1364 m asl) between ca. 12,800 and 8900 cal yr BP, an estimate that is in-line with the geomorphic evidence outlined above. Also of interest, WST points are found at higher and lower elevations than Clovis points along the shoreline of Lake Warner. Coupled with mounting evidence of the greater antiquity of WST from Paisley Caves (Jenkins et al., Reference Jenkins, Davis, Stafford, Campos, Connoly, Cummings and Hofreiter2013), this supports that people using WST points may have preceded those using Clovis in their visits to Lake Warner.
Previous archaeological work in Warner Valley (e.g., Weide, Reference Weide1968; Fowler et al., Reference Fowler, Eugene and Cliff Creger1989; Cannon et al., Reference Cannon, Creger, Fowler, Hattori and Ricks1990; Eiselt, Reference Eiselt1997; Tipps, Reference Tipps1997; Young, Reference Young1998, Reference Young2000) primarily focused on sites in the dunes and sloughs around Warner Lakes to the south of the NWVSA (Fig. 2). The only late Pleistocene/early Holocene artifacts present at those sites are occasional WST points. Early and middle Holocene artifact types are more common and include Concave Base (likely Humboldt variety), Cascade, Northern Side-notched, Pinto, and Elko points. Late Holocene types are also common and include Rosegate, Desert Side-notched, and Cottonwood points (Weide, Reference Weide1968; Cannon et al., Reference Cannon, Creger, Fowler, Hattori and Ricks1990; Eiselt, Reference Eiselt1997; Tipps, Reference Tipps1997). Except for Clovis points, which are again restricted to higher (and older) lakeshore features, virtually the entire Great Basin projectile point sequence is found at lower-elevation dune and slough sites in Warner Valley. This indicates that groups relied on the marsh resources found there, either episodically or continuously, throughout the Holocene, much as Cannon et al. (Reference Cannon, Creger, Fowler, Hattori and Ricks1990) and Weide (Reference Weide1968) described. Furthermore, it suggests that Weide’s (Reference Weide1968) and Weide’s (Reference Weide1975) assertions that the dune-and-slough topography began to build during the early Holocene are correct.
Recent archaeological excavations at the LSP-1 rockshelter (Smith et al., Reference Smith, Carey, Middleton and Kielhofer2012, Reference Smith, Pattee, Finley, Fagan and Pellegrini2014, Reference Smith, Felling, Wriston and Pattee2015, Reference Smith, Cherkinsky, Hadden and Ollivier2016a, Reference Smith, Ollivier, Barker, Camp, Harvey and Jones2016b; Kennedy and Smith, Reference Kennedy and Smith2016), which formed at 1449 m asl (Fig. 4) when the lake cut into the relatively soft Rattlesnake Tuff Formation (Walker, Reference Walker1979), also provide important evidence regarding the lake’s history and human use of the NWVSA. After Lake Warner receded below the newly formed shelter, alternating layers of gravel and sand were deposited as the shelter walls unloaded (Smith et al., Reference Smith, Pattee, Finley, Fagan and Pellegrini2014). A leporid bone from one of these layers dated to 10,242 cal yr BP (9100±30 14C yr BP, bioapatite, UGA-15259 [Smith et al., Reference Smith, Pattee, Finley, Fagan and Pellegrini2014]). Minimal exogenous sediment was deposited within the shelter until shortly before humans first occupied LSP-1 ca. 9650 cal yr BP (Smith et al., Reference Smith, Pattee, Finley, Fagan and Pellegrini2014). Thereafter, fine-grained aeolian sediment associated with an AMS date of 9433 cal yr BP (8670±40 14C yr BP, Beta-306419) accumulated until at least 9305 cal yr BP (8290±40 14C yr BP, Beta-282809 [Smith et al., Reference Smith, Carey, Middleton and Kielhofer2012]). Afterwards, fine-grained aeolian sediments contributed to alluvial deposits and roof fall throughout the middle Holocene (Smith et al., Reference Smith, Pattee, Finley, Fagan and Pellegrini2014). The basin floor’s relict lacustrine deposits provided the sediment supply for the fine sands and silts that accumulated in LSP-1. As such, we know that the lake had receded to near-modern levels (1364 m asl) and south of the NWVSA by this time, exposing the basin floor and providing a source of sediment that was ultimately entrained and accumulated in depositional catchments such as LSP-1 and other nearby shelters. LSP-1 was largely abandoned between ca. 9300 and ca. 4500 cal yr BP based on gaps in the radiocarbon dates and the projectile point sequence (Kennedy and Smith, Reference Kennedy and Smith2016). This interval encompasses the middle Holocene drought (Wriston, Reference Wriston2009), or Altithermal (Antevs, Reference Antevs1948) and, coupled with a paucity of Northern Side-notched points at surface sites in the NWVSA (Smith et al., in press), suggests that groups followed the marshes and lakes south during these hyper-arid conditions and largely abandoned North Warner Valley. During the late Holocene, charred tule and cattail seeds from LSP-1’s upper deposits reflect use of marsh resources in addition to a broad spectrum of other plants. Tule seeds from these deposits have been AMS dated to 2585 cal yr BP (2490±25 14C yr BP [Kennedy and Smith, Reference Kennedy and Smith2016]) while cattail seeds have been AMS dated to 935 cal yr BP (1013±29 14C yr BP [Kennedy and Smith, Reference Kennedy and Smith2016]). At these times, marsh resources may have been more accessible from the shelter (i.e., located farther north in Warner Valley) during relatively mesic periods when lake levels rose and filled the basin floor.
Regional lake level histories
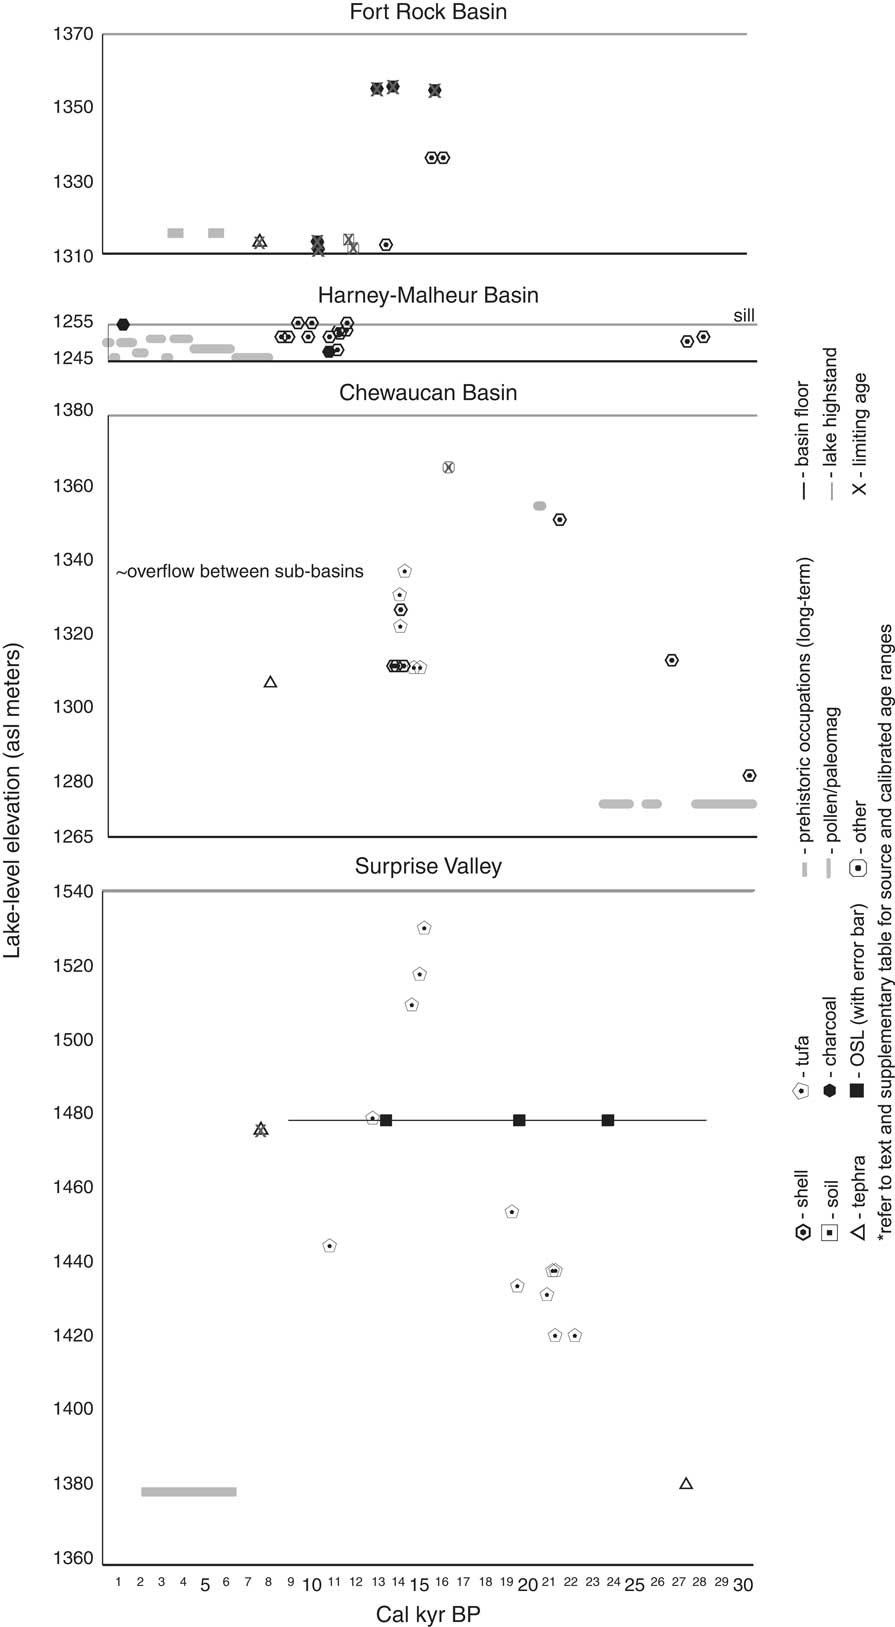
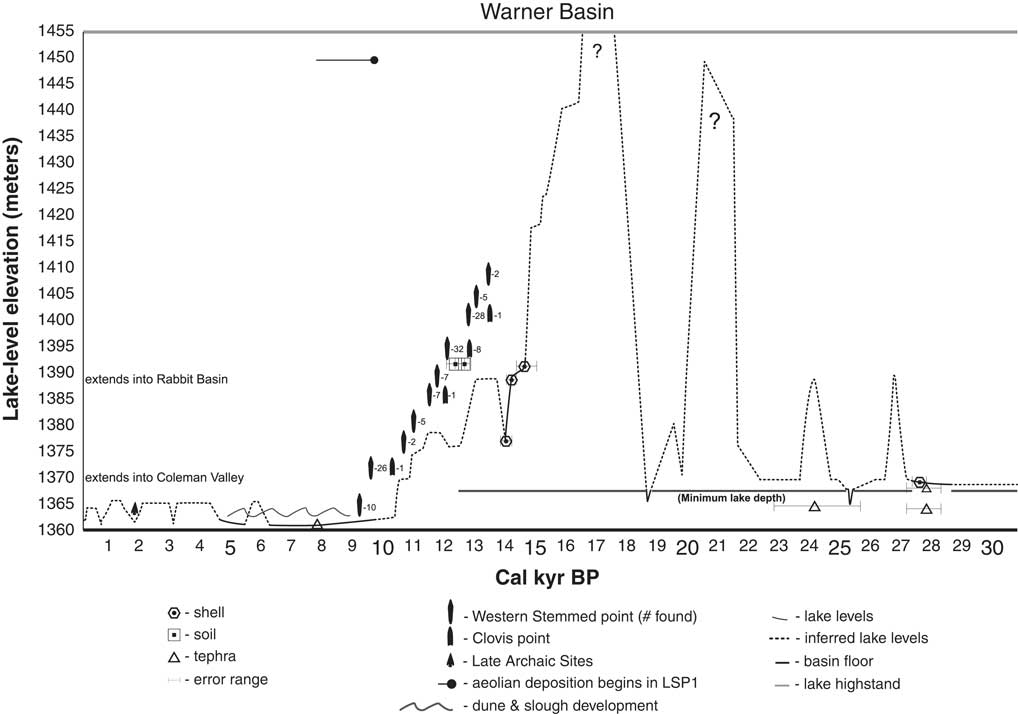
Using the data presented above, information collected by other researchers working in the area, and data from nearby basins (Fig. 8 and Supplementary Table 1), we created a lake level curve for Lake Warner (Fig. 9). There is still much to learn and many of the levels are speculative given their reliance on different proxy data types and the problematic assumption that the lake inputs and histories of adjacent basins are like those of Warner Basin. As such, this framework is meant to provide a curve to be tested and refined as data accumulates for the basin.
Lake level chronological evidence from nearby basins. Elevations are reported in meters above mean sea level (asl). The upper elevation for each basin is either the maximum shoreline elevation reported or the sill level. Refer to Supplementary Table 1 for detailed data and source information.

Late Pleistocene to Holocene lake level reconstruction for Lake Warner.

Pre-LGM (>24,000 cal yr BP)
Based on our lake level reconstruction for Lake Warner (Fig. 9), the lake was between 1369.5 and 1370 m asl when Trego Hot Springs tephra fell ca. 27,450 cal yr BP (Benson et al., Reference Benson, Smoot, Kashgarian, Sarna Wojcicki and Burdett1997). This is confirmed by a shell date of 27,220 cal yr BP in nearshore wave ripples at 1369.35 m asl and supported by unconformities in paleomagnetic core data suggesting low lake levels in nearby Lake Chewaucan (Negrini and Davis, Reference Negrini and Davis1992). However, Lake Chewaucan rose ca. 26,380 cal yr BP to moderately high levels based on a shell date reported in Allison (Reference Allison1982). Lake Warner likely mirrored this rise, afterward maintaining a minimum elevation of 1367 m asl based on the lacustrine fine-grained deposition in the BT17 profile. This level was maintained until ca. 24,990 cal yr BP, when sedimentation rates and changes in clast size deposition show that the lake receded to 1365 m asl before quickly rebounding to a minimum elevation of 1367 m asl. In the Chewaucan Basin, an unconformity in paleomagnetic core data also points to low lake levels near this time (Negrini and Davis, Reference Negrini and Davis1992).
Early LGM (24,000–21,000 cal yr BP)
Recent OSL ages on delta deposits in nearby Surprise Valley indicate a rise in lake level there ca. 23.8 ka (ca. 23,800 cal yr BP; Personius et al., Reference Personius, Crone, Machette, Mahan and Lidke2009), around the time that Mount St. Helens M tephra fell into a moderately deep Lake Warner. Lake Warner continued to maintain a minimum elevation of 1367 m asl for the subsequent 5,000 years, while evidence from Chewaucan Basin and Surprise Valley reveals at least two moderate oscillations. In Surprise Valley, tufa formed above the valley floor and is directly dated to 22,140 cal yr BP, before the lake rose ~20 m to deposit tufa dated to 21,240 cal yr BP. The lake receded to the previous level by 21,220 cal yr BP and rebounded again before 21,130 cal yr BP (Ibbara et al., 2014). Meanwhile, in the Chewaucan Basin shell dated to 21,160 cal yr BP from high shorelines suggests that the lake was ~75% of its maximum (Allison, Reference Allison1982).
Late LGM (21,000–17,000 cal yr BP)
Paleomagnetic core data suggest that the Lake Chewaucan highstand occurred after 20,260 cal yr BP (Negrini and Davis, Reference Negrini and Davis1992). Allison (Reference Allison1982) and Freidel (Reference Freidel1993) have suggested that Lake Chewaucan reached its highstand between ca. 20,000 and 18,000 cal yr BP. In Surprise Valley, tufa studies show that the lake was at moderate levels ca. 20,840 and ca. 19,470 cal yr BP but then rose ~20 m before ca. 19,210 cal yr BP (Ibarra et al., Reference Ibarra, Egger, Weaver, Harris and Maher2014). Pluvial deltas were also forming in Surprise Valley at moderately high lake levels ca. 19.6 ka based on OSL ages (ca. 19,600 cal yr BP; Personius et al., Reference Personius, Crone, Machette, Mahan and Lidke2009). Lake Warner was above 1367 m asl until ca. 18,340 cal yr BP when, based on sedimentation rates and changes in clast size of deposits, the lake had receded to around 1365 m asl before quickly rebounding.
Post-LGM (17,000–16,100 cal yr BP)
No evidence has been published for any of lakes in the northwestern Great Basin for the period between ca. 18,000 and ca. 16,100 cal yr BP outside of a single radiocarbon date recently reported for the Lake Surprise highstand at ca. 16, 200 cal yr BP (Egger et al., Reference Egger, Weldon, Langridge, Ibarra, Marion and Hall2016). We do know that Lake Warner continued to exceed 1367 m asl and rose to its maximum highstand between ca. 18,340 and 14,385 cal yr BP, and most likely between ca. 17,000 and ca. 16,100 cal yr BP, based on lake level correspondence to adjacent Surprise Valley (Ibarra et al., Reference Ibarra, Egger, Weaver, Harris and Maher2014; Egger et al., Reference Egger, Weldon, Langridge, Ibarra, Marion and Hall2016) and better studied lakes in northern Nevada (i.e., Lake Franklin [Munroe and Laabs, Reference Munroe and Laabs2013]).
A shell date from Fort Rock Basin to the northwest suggests that Lake Fort Rock receded from its highstand and was down to mid-slope ca. 16,100 cal yr BP (Bedwell, Reference Bedwell1973) and charcoal on top of gravels in the previously submerged Fort Rock Cave was dated to ca. 15,760 cal yr BP (Bedwell, Reference Bedwell1973). In the Chewaucan Basin, the lake had receded from its highstand before ca. 15,940 cal yr BP based on duck bone dates in the basal stratum of Paisley Caves (Jenkins et al., Reference Jenkins, Davis, Stafford, Campos, Connoly, Cummings and Hofreiter2013). Both caves are at high shorelines that were never inundated by lake waters again. These data suggest that, in the Fort Rock and Chewaucan basins, the maximum highstands had to precede ca. 16,100 cal yr BP.
Late Pleistocene regression (16,100–13,700 cal yr BP)
Lake Surprise had dropped ~30 m by ca. 14,940 cal yr BP and another ~8 m by ca. 14,530 cal yr BP (Ibarra et al., Reference Ibarra, Egger, Weaver, Harris and Maher2014; Egger et al., Reference Egger, Weldon, Langridge, Ibarra, Marion and Hall2016). In the northern Chewaucan Basin, tufa dates suggest that the lake was still at moderately high levels ca. 14,700 cal yr BP and ca. 14,390 cal yr BP (Freidel, Reference Freidel2001), but rose nearly 30 m by 13,910 cal yr BP with overlapping age ranges suggesting rise and falls within a 10 m range until ca. 13,740 cal yr BP (Freidel, Reference Freidel2001). Similar shell dates are reported from the southern portion of Chewaucan Basin by Licciardi (Reference Licciardi2001), who details a highstand at ca. 13,760 cal yr BP with overflow across the large alluvial fan that separates Summer Lake from the Chewaucan Marshes and Abert Basin. Both Freidel (Reference Freidel2001) and Licciardi’s (Reference Licciardi2001) data agree that Lake Winter and Lake ZX had merged into a highstand of Lake Chewaucan around this time (also see Hudson et al., Reference Hudson, Quade, Ali, Bassett, Boyle and Huntington2015; Egger et al., Reference Egger, Weldon, Langridge, Ibarra, Marion and Hall2016). Bracketing tufa dates 15 m lower are interpreted by Licciardi (Reference Licciardi2001) as indication of a rapid transgression and regression between ca. 13,890 cal yr BP and ca. 13,390 cal yr BP. However, significant tectonic deformation of latest Pleistocene shorelines in the Chewaucan Basin has been recently documented by Hall and Egger (Reference Hall and Egger2016), so these lake levels may reflect tectonic controls rather than shifting environmental conditions. Shell dates from within gravel beach ridges show that Lake Warner was moderately high (1391 m asl) between ca. 14,390 cal yr BP and ca. 13,960 cal yr BP before a regression to 1377 m asl occurred ca. 13,770 cal yr BP.
Terminal Pleistocene transgression (13,700–11,300 cal yr BP)
During this interval, people began occupying northern Warner Valley, leaving WST and Clovis points and associated debris along its shorelines (Fig. 10). Surprise Valley tufa dates show that its lake was still moderately high ca. 12,710 cal yr BP (Ibarra et al., Reference Ibarra, Egger, Weaver, Harris and Maher2014) and OSL ages show deltas were building in Surprise Valley at moderately high levels ca. 13.4 ka (ca. 13,400 cal yr BP; Personius et al., Reference Personius, Crone, Machette, Mahan and Lidke2009). Lake Warner rebounded to ~1391 m asl before depositing lagoon sediments that then developed a soil dated to between ca. 12,400 and ca. 12,090 cal yr BP. In the Harney-Malheur Basin, the lake overtopped its low sill until ca. 11,290 cal yr BP (Wriston, Reference Wriston2003) before beginning a slow recession that supported lush freshwater marshes in its broad and shallow basin (Dugas, Reference Dugas1998).
Selected reconstructed lake levels of Lake Warner, including its maximum level at 1454 m, its approximate level when people first occupied its shores, and its approximate level at the beginning of the Holocene. Image source: ESRI World basemap imagery collected in Terracolor 1/15/1999.

Terminal Pleistocene regression (11,300–10,300 cal yr BP)
Surprise Valley tufa dates show that its lake had receded to moderate levels by ca. 10,710 cal yr BP (Ibarra et al., Reference Ibarra, Egger, Weaver, Harris and Maher2014). Lake Warner had receded to the basin floor ca. 10,300 cal yr BP based on peat accumulation rates in Hansen’s (Reference Hansen1947) core near Crump Lake (Weide, Reference Weide1975), reaching near-modern lake elevation. People using WST points continued visiting Warner Valley, following the lake’s recession down to the valley floor and modern lakeshores after dunes and sloughs separated the once large lake into a series of small ones. However, based on an absence of Clovis points at lower elevations, groups using that technology did not follow the lake’s southward recession (Smith et al., Reference Smith, Felling, Wriston and Pattee2015) since they had fallen from use before the lake receded into the valley.
Early Holocene to middle Holocene drought (10,300–5,700 cal yr BP)
Marsh peats began accumulating below 1364 m asl in Warner Valley 10,300 cal yr BP and continued even as the surrounding basin dried out and relict lacustrine sediments began blowing from the valley floor into dunes and nearby catchments, including the LSP-1 rockshelter. Fine-grained aeolian deposits began accumulating in LSP-1 shortly after its initial occupation ca. 9650 cal yr BP (Smith et al., Reference Smith, Pattee, Finley, Fagan and Pellegrini2014). The shelter was largely abandoned between ca. 9300 and ca. 4500 cal yr BP (Kennedy and Smith, Reference Kennedy and Smith2016), presumably due to harsh conditions during the middle Holocene. Although conditions were much drier than in the past, wetlands, lakes, and/or springs persisted on the floors of most valleys in the northwestern Great Basin even as dunes accumulated around them. Mazama tephra fell 7600 cal yr BP on top of dunes and into small lakes and wetlands (e.g., Crump Lake and Upper Chewaucan Marsh; Hansen, Reference Hansen1947). People continued visiting Warner Basin’s relatively lush wetlands on the valley floor, leaving projectile points types that collectively span the entire Holocene along lake margins (Fowler et al., Reference Fowler, Eugene and Cliff Creger1989; Cannon et al., Reference Cannon, Creger, Fowler, Hattori and Ricks1990; Eiselt, Reference Eiselt1997; Tipps, Reference Tipps1997; Young, Reference Young1998). Pollen cores in Harney Basin show that conditions were very dry before ca. 6210 cal yr BP but began improving after this time (Wigand, Reference Wigand1987).
Middle to late Holocene (post-5,700 cal yr BP)
In the Fort Rock Basin, long-term residential settlements dated to between ca. 5700 and ca. 5400 cal yr BP and again between ca. 3900 and ca. 3500 cal yr BP are thought to correlate with mesic intervals (Jenkins et al., Reference Jenkins, Connolly and Aikens2004). This possibility is supported by pollen data in the Harney-Malheur Basin suggesting that greater effective moisture resulted in rising water levels between ca. 4040 cal yr BP and ca. 1960 cal yr BP, with a punctuated drought ca. 2960 cal yr BP (Wigand, Reference Wigand1987). Tule seeds discovered in LSP-1 that date to 2585 cal yr BP (Kennedy and Smith, Reference Kennedy and Smith2016) suggest that marshlands expanded northward in Warner Valley at this time. However, after ca. 2000 cal yr BP, lower effective moisture is signaled in Harney-Malheur Basin, while in Warner Basin increasing artifact density is recorded in dunes and around lakes on the valley bottom (Tipps, Reference Tipps1997; Young, Reference Young1998). Wetter conditions followed and, in Harney-Malheur Basin, the lake came close to or even overtopped its shallow sill ca. 960 cal yr BP (Dugas and Bullock, Reference Dugas and Bullock1994); pollen records indicate relatively mesic conditions (Wigand, Reference Wigand1987). In LSP-1, Cattail seeds dated to 935 cal yr BP (Kennedy and Smith, Reference Kennedy and Smith2016) support wetter conditions and marsh expansion into North Warner Valley. These records point to greater effective moisture during the Medieval Climatic Anomaly, as has been recognized to the south in the Lahontan Basin (Adams, Reference Adams2003), that may have led to a weak lake transgression in Warner Basin. Based on the mesic pollen signal in Harney Basin (Wigand, Reference Wigand1987), it follows that another slight transgression may have occurred between 380 and 150 cal yr BP. These weak transgressions may have been slightly higher than the one recorded in the late 1860s that filled the northern portion of Warner Valley with tule (Whistler and Lewis, Reference Whistler and Lewis1916).
CONCLUSIONS
As Reheis et al. (Reference Reheis, Adams, Oviatt and Bacon2014) lament, too few ages from nearshore deposits constrain the highstands of the northwestern Great Basin’s pluvial lakes. This study provides new shoreline ages for Lake Warner and a summary of what is currently known about other lakes in the region, including Lake Chewaucan, Lake Fort Rock, Lake Malheur, and Lake Surprise. The Lake Warner lake level curve is a step towards better understanding how this small pluvial lake responded to changes in precipitation and evaporation. Thus far, good correspondence between pluvial lakes in the northern Great Basin is apparent, but with some age discrepancies that likely result from a combination of local topography, tectonic activity, and varying proxy datasets.
In general, Lake Warner filled the valley floor between ca. 30,000 and ca. 10,300 cal yr BP, with a few rapid and short-lived regressions ca. 24,985 and 18,340 cal yr BP. In nearby basins several oscillations are evident before ca. 21,100 cal yr BP, but a steep rise to the LGM occurred between 21,000 and 20,000 cal yr BP. Lake Warner likely mirrored these changes, dropped to the valley floor ca. 18,340 cal yr BP, and then probably rose to its post-LGM highstand between ca. 17,000 and 16,100 cal yr BP. After this highstand, which exceeded all others of the late Pleistocene, the lake receded to moderately high levels. After ca. 14,385 cal yr BP, the lake oscillated between moderate to moderately high levels through the Bǿlling-Allerǿd interstadials and into the Younger Dryas stadial (Fig. 10). The lake again receded during the Younger Dryas stadial, likely transgressed slightly ca. 11,300 cal yr BP, and then continued its downward trend, reaching the valley bottom ca. 10,300 cal yr BP. Although wetlands, small lakes, and springs persist in the northwestern Great Basin, dune development in all the basins began during the early Holocene. By the time Mazama tephra fell onto Warner Valley 7,600 cal yr BP, it blanketed pre-existing dunes and marsh peats. Even so, waters may have continued to spread across the valley floor during mesic intervals into the Holocene, which archaeological site type, distribution, and floral and pollen data suggest occurred ca. 5700, ca. 4000–2000, ca. 1000, and ca. 380–152 cal yr BP.
ACKNOWLEDGMENTS
The Great Basin Paleoindian Research Unit (GBPRU), University of Nevada, Reno (UNR), and Bureau of Land Management provided funding for this research. We conducted fieldwork during the 2011–2013 UNR Field Schools in Great Basin Prehistory and Paleoecology and thank all of the field school students for their hard work and unwavering curiosity. William Cannon, archaeologist for the Lakeview District BLM, was instrumental in drawing our attention to the study area and provided extensive logistical support. Dave Rhode (Desert Research Institute) visited the field area and provided a tabletop SEM for ostracod, diatom, and tephra identification. The University of Arizona Radiocarbon Laboratory allowed Wriston access for sample pretreatment and processing. Fred Nials and Mary Barger visited the study area and offered useful insights into the regional geoarchaeological and geomorphological history. Constructive reviews offered by Jeff Pigati, Jeffrey Munroe, and Loren Davis greatly improved this paper. We thank them for their time and attention to detail; however, any errors herein are our own.
SUPPLEMENTARY MATERIAL
To view supplementary material for this article, please visit https://doi.org/10.1017/qua.2017.59