





Introduction
Grasslands cover approximately 30% of the earth’s terrestrial surface and provide many essential ecosystem services, including livestock grazing, biodiversity, wildlife habitat, and carbon storage (Petermann & Buzhdygan, Reference Petermann and Buzhdygan2021; Sayre et al. Reference Sayre, Carlisle, Huntsinger, Fisher and Shattuck2012). Despite their abundance, grasslands face numerous threats globally (Bardgett et al. Reference Bardgett, Bullock, Lavorel, Manning, Schaffner, Ostle, Chomel, Durigan, Fry, Johnson, Lavallee, Provost, Luo, Png, Sankaran, Hou, Zhou, Ma, Ren, Li, Ding, Li and Shi2021), including weed infestations (DiTomaso Reference DiTomaso2000). More weeds can reduce biodiversity and decrease ecosystem services, including forage production and associated livestock carrying capacity (DiTomaso Reference DiTomaso2000; Kasai et al. Reference Kasai, Oguro and Washitani2023). Where weed control is undertaken, forage availability can increase (e.g., Grekul and Bork Reference Grekul and Bork2004, Reference Grekul and Bork2007; Dombro et al. ) thereby supporting the sustainable use of grasslands.
Wild licorice is a perennial nitrogen-fixing leguminous forb native to North American grasslands (Boe and Johnson Reference Boe and Johnson2016). Wild licorice thrives in mesic, sandy habitats and spreads through both rhizome growth and seed dispersal (Boe and Johnson Reference Boe and Johnson2016; Boe and Wynia Reference Boe and Wynia1985) but it can also produce deep tap roots. Seeds of licorice are readily transported by grazing animals due to hooked seed pods, which attach to an animal’s hair coat, allowing the seeds to be carried to new areas (Boe and Johnson Reference Boe and Johnson2016). Although wild licorice is thought to be a nutritious plant for livestock (Fransen and Boe Reference Fransen and Boe1981; Johnson and Nichols Reference Johnson and Nichols1982), licorice in the Canadian prairies is known to contain secondary compounds that have antioxidant activity (Amarowicz et al. Reference Amarowicz, Pegg, Rahimi-Moghaddam, Barl and Weil2004). These compounds may account for the low palatability and grazing exhibited by livestock, especially cattle (authors’ personal observations), and account for their weedy designation (e.g., Stubbendieck and Conard Reference Stubbendieck and Conard1989). The increased abundance of licorice in the absence of defoliation may increase its competitiveness against more desirable forage species. This process can lead to problematic weeds such as licorice displacing native plants and altering community composition (Enloe et al. Reference Enloe, Lym and Nissen2011; Samuel and Lym Reference Samuel and Lym2017). Finally, the extensive rhizomes of licorice make it an aggressive species capable of invading new areas (Khaitov et al. Reference Khaitov, Karimov, Khaitbaeva, Sindarov, Karimov and Li2022) and renders it difficult to manage once it is established.
In North America, wild licorice is widely distributed across the northern Great Plains, where it is preferentially found in moist prairies and meadows (Boe and Johnson Reference Boe and Johnson2016). Licorice was documented in the grasslands of western Canada by Dodd and Coupland (Reference Dodd and Coupland1966), although more recently select areas of the Canadian prairie provinces, particularly those with sandy soils, have been dealing with an increasing abundance of wild licorice. Where licorice has increased, little information exists on how to control this plant, and the management of this species is important for grassland conservation, as well as the maintenance of grazing opportunities. Given that wild licorice is unlikely to be controlled directly with grazing due to its low palatability, and fire is not an acceptable management tool in semiarid rangelands, this leaves herbicides, mowing, or manual removal as primary management options.
Previous studies suggest that mechanical control does not alter licorice abundance when applied to cropland (Melander et al. Reference Melander, Nørremark and Kristensen2013). In contrast, herbicides have demonstrated promise in controlling wild licorice, though their effectiveness varies depending on the herbicide and environmental conditions. Enloe et al. (Reference Enloe, Lym, Wilson, Westra, Nissen, Beck, Moechnig, Peterson, Masters and Halstvedt2007) reported on the use of aminopyralid (AMP) for licorice control in grassland, while Mathkoor et al. (Reference Mathkoor, Hammood and Albehadili2017) reported similar results with glyphosate and imazapyr. Reductions in wild licorice have been found using aminocyclopyrachlor (AMCP), both in greenhouse trials (Carter and Lym Reference Carter and Lym2018) and field trials (Thilmony and Lym Reference Thilmony and Lym2017), with licorice recovery in the field trial occurring as soon as 14 mo after treatment (MAT). Few studies have examined the timing of herbicide application, although Whitson and Tatman (Reference Whitson and Tatman1992) generally found greater reductions in licorice 12 MAT following applications of dicamba, clopyralid, or dicamba + clopyralid in Wyoming when plants were treated at the seedling stage rather than flowering; however, longer-term monitoring was not reported. Herbicide use for controlling grassland weeds also raises concerns about herbicide impact on nontarget vegetation. Carter and Lym (Reference Carter and Lym2018) documented a wide range in susceptibility of native forbs to AMCP. For herbicides with residual properties, the monitoring of long-term effects on weeds is important, as is understanding the optimal timing of herbicide application (Samuel and Lym Reference Samuel and Lym2017). Temperature and moisture influence the half-life of herbicide residues in soil (Conklin and Lym Reference Conklin and Lym2013), which in turn, may influence the extent and longevity of weed control.
We report here on the results of two field studies conducted in the dry, mixed-grass prairie of Alberta, Canada, to evaluate the long-term effects of one-time broadleaf herbicide application, as well as repeated annual mowing, for the control of wild licorice. Specific objectives were to 1) evaluate the effects of various broadleaf herbicides, applied once in either spring or summer, on wild licorice density and biomass for four growing seasons; 2) quantify nontarget herbage responses to herbicide treatments during this time; and 3) assess the effect of annual mowing, conducted in either spring or summer, on total annual wild licorice biomass produced. By assessing various control options for wild licorice, this study addresses key knowledge gaps regarding the feasibility of achieving long-term control of wild licorice in grassland.
Materials and Methods
Study Area
We conducted two separate field experiments on wild licorice control between 2016 and 2020, inclusive, at the University of Alberta Mattheis Research Ranch (MRR), situated in the dry, mixed-grass prairie, approximately 180 km east of Calgary (50.8752, −111.9318W). The MRR receives 318 mm of precipitation annually, with 77% of moisture falling during the primary growing season (April 1 to September 30; Figure 1A). Mean daily temperatures are 4.0 C, with frost-free conditions prevailing for approximately 7 mo of the year (Figure 1B). During the years examined, precipitation was 343, 284, 237, 252, and 364 mm during 2016 through 2020, respectively, which ranged from 74.7% to 114.6% of normal. While the period 2017 to 2019 inclusive were represented by below normal amounts of rain during the growing season, particularly 2019, when drought occurred for much of the spring and summer, both the first year (2016) and last year (2020) were wetter than normal (Figure 1A). Growing season temperatures were above average over the first 3 yr, and near normal the final 2 yr (Figure 1B).
Mean monthly precipitation (A) and temperature (B) from January 2016 through December 2020, inclusive, along with the long-term 30-yr monthly averages (1990–2020) for the Verger climate station situated at the Mattheis Research Ranch, Alberta, Canada. Monthly values were calculated from daily climate records retrieved from the Agricultural Climate Information System maintained by the Government of Alberta.

Figure 1 Long description
Panel A: A bar and line graph showing monthly precipitation from January 2016 through December 2020. The vertical axis represents precipitation in millimeters, ranging from 0 to 180 millimeters. The horizontal axis represents time in months and years. The bar graph shows monthly precipitation values, while the line graph shows the mean 30-year monthly precipitation. Notable peaks in precipitation are visible in certain months. Panel B: A line graph showing monthly mean air temperature from January 2016 through December 2020. The vertical axis represents temperature in degrees Celsius, ranging from -25 to 25 degrees Celsius. The horizontal axis represents time in months and years. The line graph shows monthly mean air temperature values, with a cyclical pattern indicating seasonal variations. The mean 30-year monthly temperature is also depicted as a line.
The study area is within the Brooks Plain landform and represented by an abundance of coarse-textured soils, with prior studies indicating a prevalence of Rego Brown Chernozemic soils established on parent material of stabilized sand that comprises gently rolling sand dunes (Wolfe et al. Reference Wolfe, Ollerhead, Huntley and Campbell2002). Soils assessed within 2 km of the study area and on the same landform indicate they have a well-defined but shallow Ah horizon soil with 2.6% organic matter and a texture dominated by sand (e.g., 77% sand, 16% silt, and 7% clay), pH 5.75, and electrical conductivity of 69.5 µS cm−1 (James et al. Reference James, Thompson, Carlyle, Quideau and Bork2023).
Vegetation across the area is a mix of native dry mixed-grass Prairie, including Hesperostipa comata (Trin. & Rup.) Barkworth, Pascopyrum smithii (Rydb.) Barkworth & D.R. Dewey, Koeleria macrantha (Ledeb.) Schult., and Bouteloua gracilis (Willd. ex Kunth) Lag. ex Griffiths, in combination with significant amounts of Sporobolus rigidus (Buckley) P.M. Peterson var. rigidus. These grasslands also include abundant Poa pratensis L. and Bromus inermis Leyss. in areas of greater moisture. These grasslands contain a variety of forbs, along with a substantial abundance of wild licorice.
Herbicide Control Treatments and Sampling
A herbicide efficacy trial was conducted at two study sites (hereafter W2 and W3) across the MRR spanning the years 2017 to 2020. A randomized complete block design was established testing four herbicides at each of two timings. This resulted in eight unique herbicide treatments (Table 1), which were applied to individual plots 2 m by 5 m in size within each of four blocks. In addition, two control plots were included per block, with one receiving no wild licorice treatment during the growing season throughout the study, and a second that initially received hand-pulling (i.e., manual removal) of all licorice stems present throughout the spring and summer of 2017 (Table 1). Replicate blocks were separated by a 2-m alley, with a total of 80 plots (2 sites × 40 plots). Study sites were approximately 20 m by 30 m in size and selected based on their internal uniformity in ecosite conditions, together with moderate to high abundance of wild licorice (by density and cover). Both sites were fenced to exclude cattle and facilitate the monitoring of vegetation responses in the absence of grazing, and to abide by grazing restrictions after herbicide treatment (i.e., 7 d for all herbicides except Engenia [BASF, Research Triangle Park, NC], which was 30 d).
Summary of the treatments applied in the 2017 growing season for the control of wild licorice in mixed-grass prairie.a

Table 1 Long description
The table presents a detailed summary of treatments applied for the control of wild licorice in mixed-grass prairie during the 2017 growing season. It includes information on the treatment type, date, plant stage, commercial product used, bioactives, formulation, and application rates. The table has 10 rows and 7 columns. Column headers are Treatment, Date, Plant stage (leaf number), Commercial product, Bioactives, Formulation, and Application rates. The Application rates column is further divided into Product and Bioactives sub-columns. Row 1: Nontreated, n/a, n/a, n/a, n/a, n/a, n/a, n/a. Row 2: Hand-pulling, May–July, 2–10, n/a, n/a, n/a, n/a, n/a. Row 3: 2,4-D, spring, May 29, 2017, 3–4, 2,4-D ester, 2,4-D Ester 700, 660 g L^-1, 3.21 L ha^-1, 2.11 kg ai ha^-1. Row 4: Dicamba, spring, May 29, 2017, 3–4, Engenia, Dicamba, 600 g L^-1, 1.66 L ha^-1, 1.00 kg ai ha^-1. Row 5: AMCP, spring, May 29, 2017, 3–4, Navius, Aminocyclopyrachlor + metsulfuron-methyl, 52.1% (39.5%/12.6%), 167 g ha^-1, 0.087 kg ai ha^-1. Row 6: AMP, spring, May 29, 2017, 3–4, Restore II, Aminopyralid + 2,4-D MA salt, 450 g L^-1 (11%/89%), 2.13 L ha^-1, 0.95 kg ai ha^-1. Row 7: 2,4-D, summer, June 19, 2017, 9–10, 2,4-D ester, 2,4-D Ester 700, 660 g L^-1, 3.21 L ha^-1, 2.11 kg ai ha^-1. Row 8: Dicamba, summer, June 19, 2017, 9–10, Engenia, Dicamba, 600 g L^-1, 1.66 L ha^-1, 1.00 kg ai ha^-1. Row 9: AMCP, summer, June 19, 2017, 9–10, Navius, Aminocyclopyrachlor + metsulfuron-methyl, 52.1% (39.5%/12.6%), 167 g ha^-1, 0.087 kg ai ha^-1. Row 10: AMP, summer, June 19, 2017, 9–10, Restore II, Aminopyralid + 2,4-D MA salt, 450 g L^-1 (11%/89%), 2.13 L ha^-1, 0.95 kg ai ha^-1.
a Abbreviations: AMCP, aminocyclopyrachlor. AMP, aminopyralid.
b Product manufacturers: Engenia, BASF, Research Triangle Park, NC; Navius FLEX, Environmental Science U.S., Cary, NC; Restore II, Corteva Agriscience, Calgary, AB.
c Treatments with Navius included the addition of Ag Surf (IPCO, Winnipeg, MB), a nonionic surfactant, at 250 mL L−1.
Herbicide treatments were applied one time in the spring or summer of 2017 at one of two timings in a strip-plot design, where timings represented the whole plot, which included spring (May 29), when wild licorice plants were at the 3- to 4-leaf stage, or in summer (June 19), when licorice plants were at the bud stage (9- to 10-leaf) prior to flowering. The four herbicide treatments included 2,4-D (2.11 kg ai ha−1), aminopyralid + 2,4-D dimethylamine salt (AMP for short) (Restore II; Corteva Agriscience, Calgary, AB), applied at 0.95 kg ai ha−1, dicamba (Engenia) applied at 1.00 kg ai ha−1, and aminocyclopyrachlor/metsulfuron-methyl (AMCP for short) (Navius FLEX; Environmental Science U.S., Cary, NC) applied at 87 g ai ha−1. Navius treatments included the nonionic surfactant Ag Surf (IPCO, Winnipeg, MB) at 250 mL L−1 (Table 1). All herbicides tested were chosen based on their existing registration for managing perennial broad-leaved plants in pasture, though none are registered specifically for wild licorice control in Canada.
Herbicides were applied with a 2-m-long hand-held boom and backpack sprayer traveling at 4.5 km h−1. The boom contained four Air Bubble Jet 11001 nozzles (www.bfs.uk.com) calibrated to deliver a volume of 100 L ha−1 at 296 kPa with CO2 as a propellent. The spring treatment was applied on May 29, 2017, at both locations between 6:30 AM and 8:00 AM when wind speeds ranged from 3 to 5 km h−1, and temperature and relative humidity were 6 C and 80%, respectively. The summer treatments were applied on June 19, 2017, at both locations between 2:00 PM and 3:30 PM when wind speed was between 4 and 10 km h−1 and temperature and relative humidity were 21 C and 36%, respectively.
Licorice stem densities were assessed 1 to 6 d prior to the respective treatment timings in 2017 and again 4 wk after the summer treatments were applied. Subsequent repeat assessments were carried out at peak vegetation development in mid-July in 2018, 2019, and 2020, thereby examining four consecutive years of responses to the one-time weed control treatments. All independent licorice stems were counted from within two permanently marked 0.5 by 0.5 m (0.25 m2) quadrats of each plot to track long-term changes in density. To assess biomass, all aboveground biomass was harvested to ground level (2 cm) at peak plant growth (mid-July) within one 0.25-m−2 quadrat randomly placed within each plot. Sampling in subsequent years was carried out in a unique area of each plot to avoid confounding effects of prior defoliation. Biomass of current annual growth was harvested, separated into graminoids (grasses and sedges), wild licorice, and other forbs, then bagged, and later dried at 40 C to stable mass and weighed. All biomass values were converted to grams per square meter (g m−2) for analysis.
Mowing Study Treatments and Sampling
A second study was conducted at two additional sites from 2016 through 2020 to evaluate the potential for annual mowing to alter wild licorice biomass. At each of two fenced sites, hereafter W3W and W5, a total of 20 plots were laid out in a fully randomized design. Four treatments were each applied to five permanently marked replicate plots 1 m by 1 m in size, with all measurements taken within a nested central 0.5 m by 0.5 m area, creating a 50-cm treated buffer that was not used for licorice monitoring. Treatments included 1) annual mowing in spring (between June 18 and 29, hereafter “early mow”) to a height of 2 cm; 2) annual mowing in summer (between July 16 and 22, hereafter “late mow”); 3) a nontreated check; and 4) a selective defoliation treatment emulating livestock use of forage only between July 3 and July 8 when all herbage was defoliated except the wild licorice, which was left intact(i.e., selective defoliation). When applying the early and late mowing treatments from 2016 through 2019, all wild licorice biomass was retained. At the end of the growing season following the onset of dormancy (August 13–24), all remaining biomass was harvested from plots, and the biomass of licorice (either primary growth or regrowth) was retained. All wild licorice biomass samples were dried and weighed, and for plots subject to repeated harvest within a year, summed to obtain the total shoot biomass of licorice produced annually. During the final year of 2020, growing season treatments were not applied, and instead, plots were allowed to progress without disturbance until the final harvest in late August, when wild licorice biomass was quantified.
Statistical Analysis
For the herbicide control trial, differences in wild licorice density and biomass were assessed as natural log response ratios [ln(treatment/nontreated check)], abbreviated here as lnRR, to obtain a response ratio for each of the nine treatments (all herbicide treatments and the hand-pulling control). Resulting lnRR values for licorice density and biomass were then analyzed for ANOVA, with treatment and year of sampling set as fixed effects, and individual replicate blocks as random effects. Repeated measures were included to account for the re-sampling of plots across years. Where significant effects were present, mean comparisons were conducted among the lnRR values of the nine control treatments within a year to isolate treatment responses. In addition, 95% confidence intervals (CIs) of each lnRR were used to identify treatments that differed from the nontreated control. Effects of individual treatments were considered significant if the 95% CI did not cross zero, with intervals below zero indicating a significant reduction in licorice. To assist in the interpretation of herbicide effects, proportional (%) changes in licorice due to each herbicide treatment were determined (relative to the nontreated control within the same year of assessment) by back transforming lnRR means and confidence values. Finally, the abundance of wild licorice density and biomass were compared across years within the non-treated control plots to assess natural temporal variation in licorice abundance throughout the 4 yr. Significance for all ANOVAs was set at P < 0.10 to minimize the potential for a type II error, with all post hoc mean comparisons using a value of α = 5% to establish differences. Due to differences in ecosite conditions and the starting plant communities, data from each site (W2 and W3) were analyzed separately.
To evaluate herbicide effects on non-licorice vegetation, the biomass of graminoids, forbs, and total herbage (graminoids plus forbs, excluding licorice) were assessed with an ANOVA, using treatment and year as fixed effects, and replicate blocks as a random effect. Year was included as a repeated measure. Where significant interactions were evident, post hoc comparisons were performed among treatments within each year, thereby isolating the timing and nature of the changes in grassland biomass. All analyses were conducted with SAS software (v. 9.4; SAS Institute Inc., Cary, NC).
Within the 5-yr mowing trial, the total biomass of wild licorice each year was assessed using an ANOVA for each site (W3W and W5), with individual plots as random. Years of treatment and assessment were included as an additional fixed effect, with repeated measures accounting for consecutive measurements over time. Within each year, wild licorice that was removed during the early or late-season mowing was added to the final harvest to quantify total weed biomass. The biomass of licorice in the nontreated check and selective mowing treatments were obtained only at the end of the growing season. Because no growing season treatments were conducted in 2020 (Year 5), data from that year represent only the end-of-year licorice biomass, thereby assessing residual responses to four consecutive years of prior defoliation.
Results and Discussion
Long-Term Wild Licorice Responses to Herbicides
No differences were found in wild licorice density among plots assigned to different treatments and measured in the spring prior to herbicide application at either W2 (P ≥ 0.38) or W3 (P ≥ 0.10), with licorice densities averaging 33.8 (±14.8) plants m−2 and 34.0 (±15.9) plants m−2 at sites W2 and W3, respectively. Initial ANOVA tests using all 10 treatments indicated overall treatment effects were evident in both licorice density and biomass at both locations (all P < 0.001), with distinct patterns in responses (see Figures S1 and S2 for density and biomass responses, respectively).
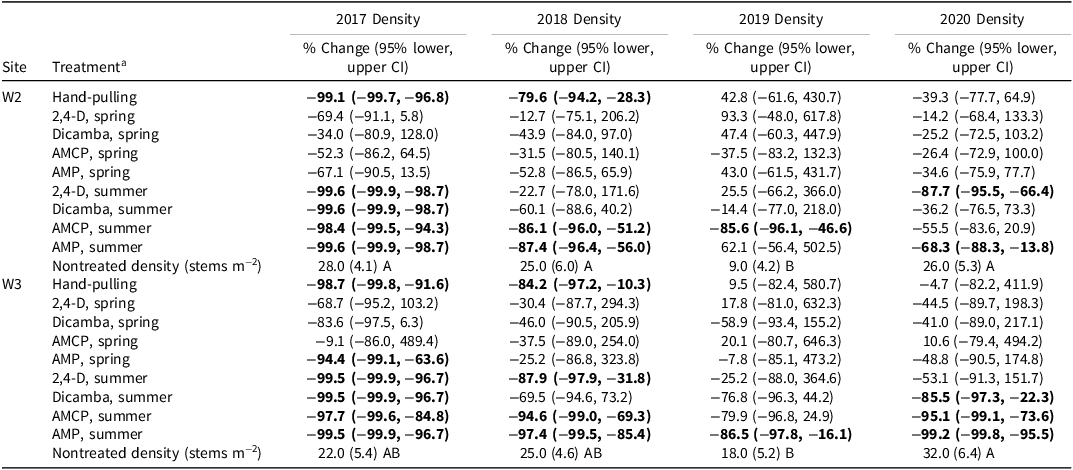
Subsequent analysis using log response ratios to isolate the presence and magnitude of treatment effects relative to the nontreated control showed both treatment effects, as well as consistent year × treatment effects (P ≤ 0.06) on wild licorice density and biomass at both sites (Table 2). Mean response ratios of licorice density and their 95% CIs indicated that hand pulling reduced plant density at both sites for 2 yr after the one-time treatment (Table S1), with no further declines thereafter. Percent reductions in licorice density due to manual removal were −98.7% to −99.1% and −79.6% to −84.2%, during 2017 and 2018 (Table 3), respectively, relative to the nontreated control.
Summary of the ANOVA results, including F-statistics and P-values, for wild licorice density and biomass log response ratios assessed at each of two study sites and tested for different seasons and types of one-time herbicide control applied in 2017.a

Table 2 Long description
The table presents ANOVA results for wild licorice density and biomass log response ratios at two study sites, Pasture W2 and Pasture W3. It includes F-statistics and P-values for different factors: Year, Treatment, and Year x Treatment. The table has four rows and eight columns. Column headers are Factor, WL density F-stat, WL density P-value, WL biomass F-stat, WL biomass P-value, WL density F-stat, WL density P-value, WL biomass F-stat, and WL biomass P-value. Row labels are Year, Treatment, and Year x Treatment. Row 1: Year, 46.9, <0.0001, 82.5, <0.0001, 20.2, <0.0001, 38.8, <0.0001. Row 2: Treatment, 5.48, <0.0001, 3.78, 0.0006, 5.26, <0.0001, 4.31, 0.0002. Row 3: Year x Treatment, 4.07, <0.0001, 4.27, <0.0001, 1.58, 0.060, 1.64, 0.046.
a Abbreviation: WL, wild licorice.
b Year refers to the measured response post-treatment (2017–2020). Bold values indicate significant treatment effects at P < 0.10.
Summary of the mean percent change in wild licorice density at the W2 and W3 sites, along with 95% lower and upper confidence intervals, across each of four sampling years following different seasons and types of weed control during the 2017 growing season.a,b

Table 3 Long description
.
a Abbreviations: AMCP, aminocyclopyrachlor; AMP, aminopyralid; CI, confidence interval.
b Values in bold indicate those that do not overlap with zero, indicating significant differences from the nontreated control. Also shown are nontreated mean licorice density across years, with means having different letters differing at P < 0.05.
Across all treatments, summer application of herbicide, independent of the bioactive, generally led to larger declines in wild licorice density relative to the spring herbicide applications during the first year, and this pattern was consistent between study sites (Tables S1, 3). One year later, the AMP-summer and AMCP-summer treatments had reduced licorice density by −87.4% to −97%, and by −86.1% to −94.6%, respectively, at both sites (Table 3). At the W3 site, 2,4-D applied in summer also reduced wild licorice density (−87.9%). Wild licorice density responses after 2018 were less evident and inconsistent, both among treatments and between sites (Tables S1 and 3). At the W2 site, only the AMCP-summer application led to a decline in plant density (−85.6%); however, 1 yr later this response disappeared, and two other summer applied herbicides reduced licorice (Table 3), including 2,4-D-summer (−87.7%) and AMP-summer (−68.3%). At the W3 site, only the AMP-summer treatment reduced licorice density during 2019 (−86.5%), while three summer-applied herbicide treatments reduced licorice density, including dicamba-summer (−85.5%), AMCP-summer (−95.1%), and AMP-summer (−99.2%) (Table 3). Overall, wild licorice stem densities varied over time in the absence of herbicide throughout the study, beginning at 22 to 28 stems m−2, and dropping markedly during the 2019 growing season, particularly at the W2 site where densities reached only 9 stems m−2 (Table 3).
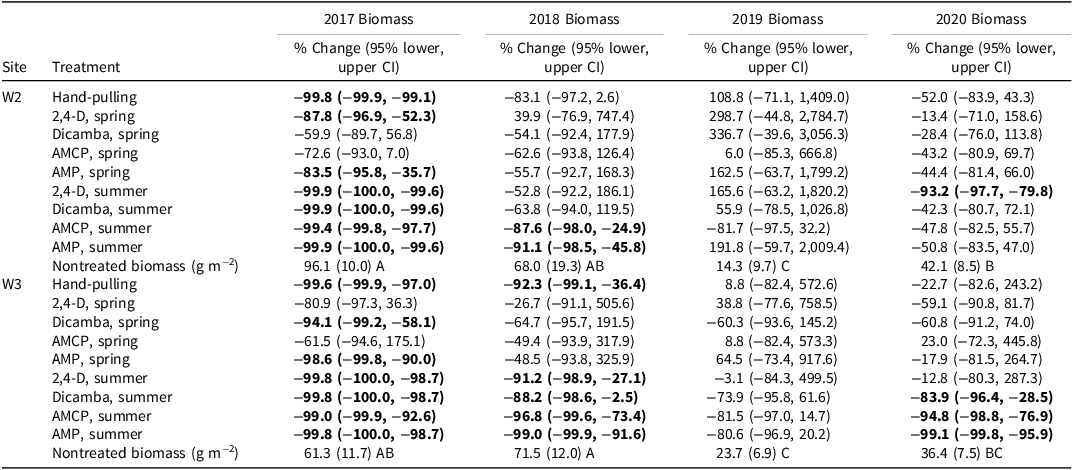
Wild licorice shoot biomass responses paralleled those evident for density (Tables 4 and S2), with more responses earlier on, and with greater and more consistent reductions in biomass due to summer herbicide application. Hand pulling reduced plant biomass by more than −99%, though this response lasted only 1 yr at the W2 site (Table 4); at the W3 site, a further reduction in biomass was evident of −92.3% from manual removal the prior year, with no further declines by Year 3 at either location. Summer herbicide application, regardless of the bioactive ingredient, was effective in reducing wild licorice biomass during the first year, with consistent reductions of at least −99% (Table 4). In addition, licorice biomass declines were evident the first year within the 2,4-D-spring and AMP-spring treatments (−83.5% to −87.8%) at W2, and from the dicamba-spring and AMP-spring treatments (−94.1% to −98.6%) at W3 (Table 4). By 2018, no spring-applied herbicide treatment reduced wild licorice shoot biomass at either location. At W3, all four summer-applied herbicides continued to reduce licorice biomass by −88.2% to −99.0% during 2018 (Tables 4 and S2), whereas at the W2 site only the AMCP-summer and AMP-summer treatments were effective at decreasing biomass (−87.6% to −91.1%). In 2019, no reductions in licorice biomass were evident at either study site. During the final year of monitoring, several herbicide effects were once again evident, all of which were limited to summer-applied treatments from 4 yr earlier. At the W3 site, the dicamba-summer, AMCP-summer, and AMP-summer treatments reduced wild licorice biomass by at least −83.9% (Table 4), whereas at the W2 site only the 2,4-D-summer treatment resulted in a reduction in licorice biomass (−93.2%). Similar to density responses, overall licorice shoot biomass values varied widely throughout the study in the absence of herbicide, beginning at 61 to 96 g m−2 in 2017, and dropping to a low of 14.3 to 23.7 g m−2 in the 2019 growing season (Table 4).
Summary of the mean percent change in wild licorice biomass at the W2 and W3 sites, along with 95% lower and upper confidence intervals, across each of four sampling years following different seasons and types of weed control during the 2017 growing season.a,b

Table 4 Long description
The table presents data on the percent change in wild licorice biomass at sites W2 and W3 across the years 2017 to 2020. It includes various treatments such as hand-pulling, 2,4-D, dicamba, AMPC, and AMP applied in different seasons. The table has 26 rows and 8 columns. Column headers are Treatment, 2017 Biomass % Change (95% lower, upper CI), 2018 Biomass % Change (95% lower, upper CI), 2019 Biomass % Change (95% lower, upper CI), and 2020 Biomass % Change (95% lower, upper CI). Row labels include different treatments and their application seasons. Notable trends include significant reductions in biomass following summer herbicide applications and hand-pulling, with varying effectiveness across different years and sites.
a Abbreviations: AMCP, aminocyclopyrachlor; AMP, aminopyralid; CI, confidence interval.
b Values in bold indicate those that do not overlap with zero, indicating significant differences from the nontreated control. Also shown are nontreated mean licorice biomass across years, with means having different letters differing at P < 0.05.
The greatest and longest reductions in wild licorice were generally obtained following summer rather than spring applications of herbicide, reinforcing the importance of timing in achieving weed control (Samuel and Lym Reference Samuel and Lym2017). Studies on the effect of herbicide timing for licorice control are limited, with Whitson and Tatman (Reference Whitson and Tatman1992) concluding that applications of several herbicides, including dicamba, at seed set are superior to flowering for short-term control. However, no prior studies appear to have evaluated seasonal herbicide effects on long-term licorice responses, including newer herbicides such as AMP and AMCP, and guidelines for controlling licorice typically vary from spring to early summer (clopyralid and triclopyr are sold in a tank mix as Redeem R&P; Dow Agrosciences, Indianapolis, IN) or when plants are flowering (dicamba) (Enloe Reference Enloe2007). While the specific mechanism is unclear for the seasonal differences found in the current study, one possibility is that the direct uptake of herbicide via foliage may have been higher in summer (when plants were at the 9- to 10-leaf stage) when the leaf area was greater. Spraying in spring when plants were small (the 3- to 4-leaf stage) may explain the reduced control shortly thereafter.
Not surprisingly, the greatest and most consistent long-term control of licorice was obtained from the herbicides AMP and AMCP, both of which have soil residual properties, and may therefore help control wild licorice regrowth from belowground roots. Reductions in licorice have previously been reported when both AMP (Enloe et al. Reference Enloe, Lym, Wilson, Westra, Nissen, Beck, Moechnig, Peterson, Masters and Halstvedt2007) and AMCP (Carter and Lym Reference Carter and Lym2018; Thilmony and Lym Reference Thilmony and Lym2017) were applied. Notably, the reductions in licorice observed here extended out as long as 38 MAT, which far exceed the longevity of treatment reported by Thilmony and Lym (Reference Thilmony and Lym2017) wherein licorice recovered by 14 MAT. It also is not clear why these same herbicides did not perform as well following spring application, unless the translocation of herbicide to belowground via foliage was an important mechanism to move bioactive to the roots where it could have the greatest effect on licorice. Interestingly, both 2,4-D and dicamba also demonstrated reductions in wild licorice as long as 4 yr after application, which is well past the window that may be expected to lead to broadleaf weed control for these herbicides.
Finally, the marked initial reduction in wild licorice from direct hand-pulling is not surprising given that this treatment physically removed wild licorice stems from that treatment during 2017. While hand-pulling was very effective for up to two growing seasons, it did not achieve longer-term control, as wild licorice returned to pretreatment levels by the third year. The large rhizomatous root system of wild licorice, which is known to spread horizontally more than 40 cm a year (Boe and Wynia Reference Boe and Wynia1985), allows this plant to be relatively tolerant of aboveground disturbances. This morphology may have allowed licorice to re-enter treated plots in our study from adjacent nontreated grassland within 2 or 3 yr and highlights the challenge in controlling a plant capable of extensive vegetative reproduction (Khaitov et al. Reference Khaitov, Karimov, Khaitbaeva, Sindarov, Karimov and Li2022).
Grassland Biomass Responses to Herbicide Application
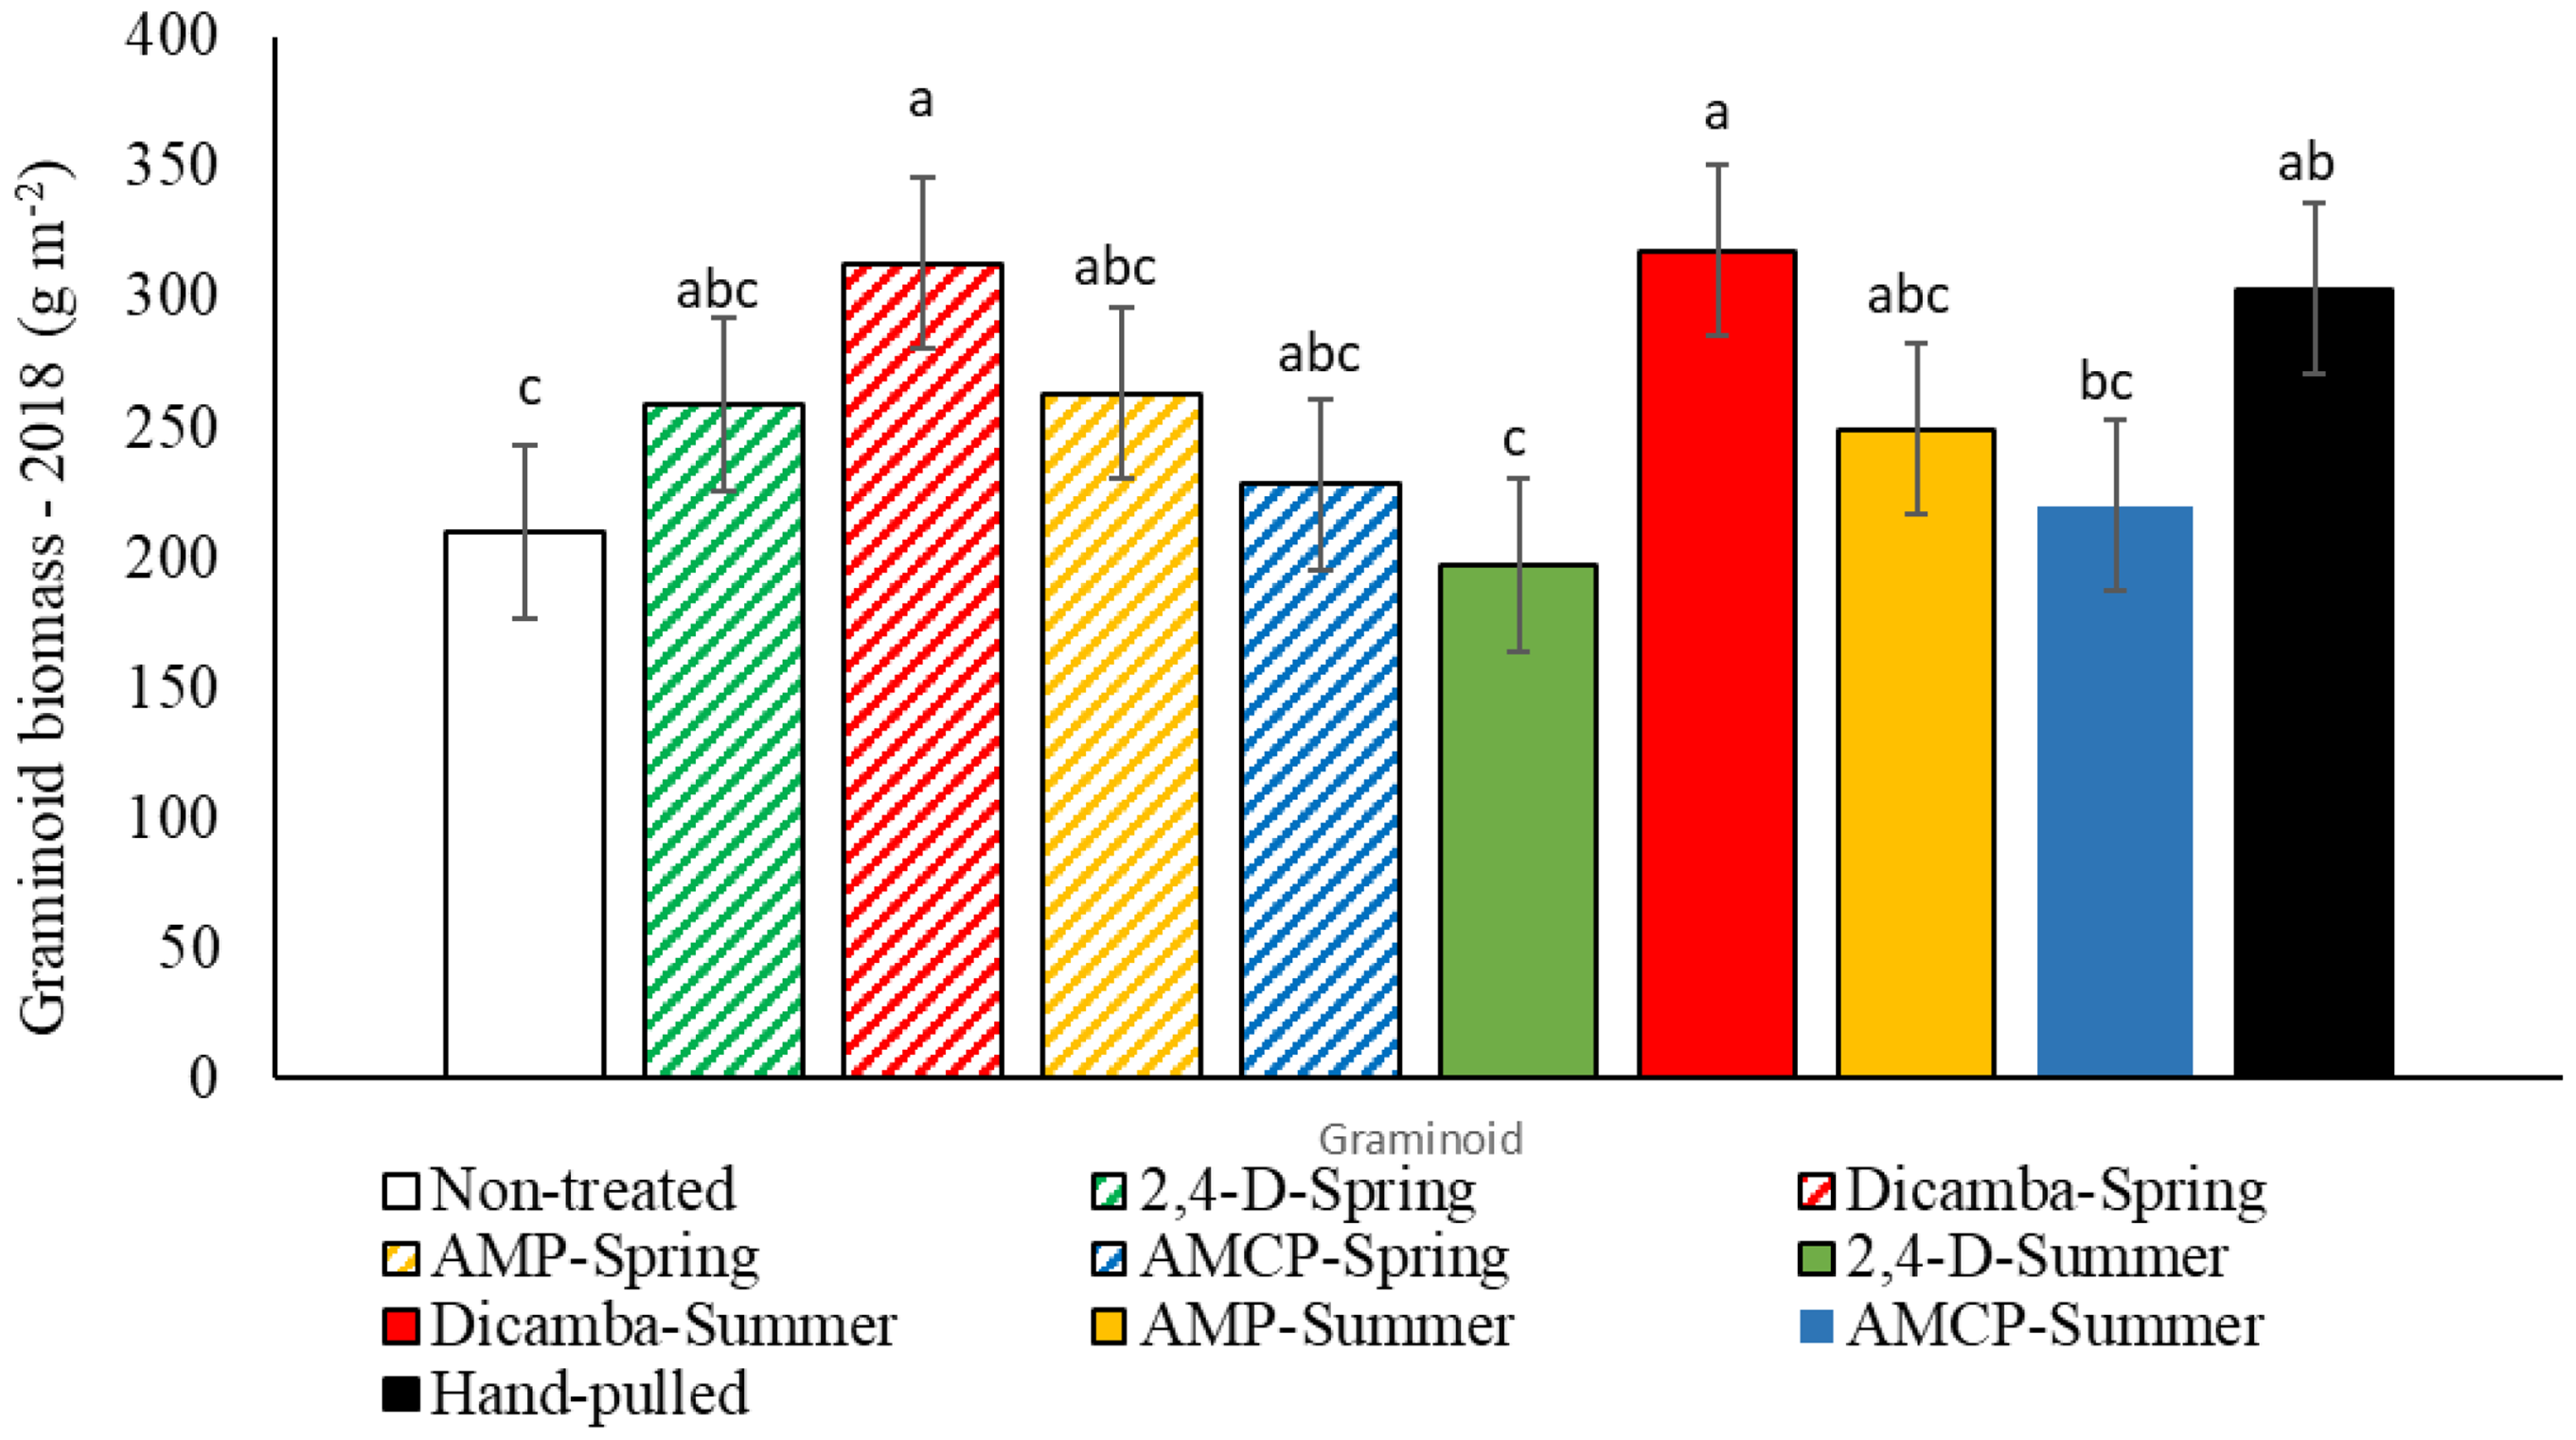
Mixed-grass prairie (non-licorice) biomass responses demonstrated strong year over year differences at both study sites (Table 5). While no overall herbicide treatment effects were evident at either study site, total herbage and graminoid biomass were both affected by year-by-treatment interaction (P ≤ 0.05), but only at the W2 site. No grassland biomass responses to treatments were evident at W3, nor did forbs respond to the treatments at W2 (Table 5). Closer examination of the interactions at W2 indicated that graminoid biomass varied among treatments and accounted for the differences in total herbage (Table S3). However, differences between the licorice control treatments and the nontreated check were ultimately limited to 2018, 1 yr after treatments were imposed. More specifically, both dicamba treatments (dicamba-spring; dicamba-summer) led to an increase in graminoid biomass of at least 49% in 2018, with no further differences thereafter (Figure 2, Table S3). To better understand the relationship between wild licorice and the biomass of remaining grassland vegetation, we regressed graminoid biomass against wild licorice shoot density and biomass from the various treatments at W2 during 2018 (Figure 3). Graminoid biomass declined with licorice shoot density and biomass (P < 0.05), with the latter accounting for 9.5% and 25.3% of the decrease in graminoids (Figure 3).
Summary of the ANOVA test results, including F-statistics (numerator, denominator df) and P-values, for the biomass of graminoids, non-licorice forbs, and total herbage (excluding licorice), across each of two study sites following different seasons and types of one-time herbicide application applied in 2017 and monitored for four subsequent years.

Table 5 Long description
The table presents ANOVA test results for the biomass of graminoids, forbs, and total herbage across two study sites, W2 and W3, following different seasons and types of one-time herbicide application applied in 2017 and monitored for four subsequent years. The table has 8 rows and 8 columns. Column headers are Site, Response, Year F-stat, Year P-value, Treatment F-stat, Treatment P-value, Year x Treatment F-stat, and Year x Treatment P-value. Row 1: Site, W2, Response, Graminoids, Year F-stat, 10.2, Year P-value, <0.0001, Treatment F-stat, 1.04, Treatment P-value, 0.412, Year x Treatment F-stat, 1.58, Year x Treatment P-value, 0.0504. Row 2: Site, W2, Response, Forbs, Year F-stat, 8.98, Year P-value, <0.0001, Treatment F-stat, 1.08, Treatment P-value, 0.386, Year x Treatment F-stat, 0.65, Year x Treatment P-value, 0.90. Row 3: Site, W2, Response, Total herbage, Year F-stat, 14.1, Year P-value, <0.0001, Treatment F-stat, 1.41, Treatment P-value, 0.191, Year x Treatment F-stat, 1.60, Year x Treatment P-value, 0.046. Row 4: Site, W3, Response, Graminoids, Year F-stat, 3.43, Year P-value, 0.020, Treatment F-stat, 1.23, Treatment P-value, 0.283, Year x Treatment F-stat, 0.98, Year x Treatment P-value, 0.495. Row 5: Site, W3, Response, Forbs, Year F-stat, 22.2, Year P-value, <0.0001, Treatment F-stat, 1.47, Treatment P-value, 0.167, Year x Treatment F-stat, 1.38, Year x Treatment P-value, 0.122. Row 6: Site, W3, Response, Total herbage, Year F-stat, 3.89, Year P-value, 0.011, Treatment F-stat, 1.14, Treatment P-value, 0.339, Year x Treatment F-stat, 1.01, Year x Treatment P-value, 0.456.
Bold values indicate effects that are significant at P < 0.10.
Total mean (± 1 standard error) graminoid biomass at the W2 study site during the 2018 sampling year and coincident with significant treatment effects 1 yr after spraying. Means with different letters differ (P < 0.05).

Relationship between graminoid biomass and wild licorice biomass and stem density at the W2 herbicide study site during the 2018 growing season, coincident with a year of significant weed control effects on graminoid biomass.

The limited grassland herbaceous biomass responses suggest that efforts to achieve wild licorice control using herbicides is unlikely to alter forage availability. The lone increase observed was only at one of the two study sites and during one of the four post-spraying assessment years and was further limited to the application of dicamba. Results from that year supported the notion that graminoid biomass was generally greater in plots with less licorice, suggesting this plant can reduce forage availability, much like other pasture weeds in western Canada (e.g., Grekul and Bork Reference Grekul and Bork2004). However, the inconsistent nature of forage responses across time and space suggests that licorice may be acting more as a passenger species within these grasslands and occupying otherwise “empty” ecological niches (Peterson and Vieglas Reference Peterson and Vieglas2001), with minimal competitive impacts on neighboring plants. This notion is further supported here by the observation that the principal reduction in wild licorice occurred in plots at the W2 site treated with AMCP and AMP, rather than dicamba. Thus, the graminoid yield gain in the dicamba plots is unlikely to be attributed to reduced weed competition and instead may be associated with other indirect effects of dicamba on graminoid plant species; notably, Smith et al. (Reference Smith, Askew, Hagood and Barney2015) documented an increase in switchgrass height after dicamba application. While we are not aware of any prior studies quantifying the impact of wild licorice on grassland forage production, it is notable that studies conducted in croplands (on Glycyrrhiza. L.) have shown that licorice has relatively little impact on crop (chickpea) yield and instead may aid crop growth through the allelopathic inhibition of other weeds (Sohrabi et al. Reference Sohrabi, Bagheri, Mondani and Nosratti2025), a process known as indirect facilitation (Rooker et al. Reference Rooker, Maestre, Calloway, Lortie, Cavieres, Kunstler, Liancourt, Tielbörger, Travis, Anthelme, Armas, Coll, Corcket, Delzon, Foray, Kikvidze, Olofsson, Pugnaire, Quiroz, Saccone, Schiffers, Seifan, Touzard and Michalet2008).
Importantly, our findings did not indicate that the application of AMP, AMCP, metsulfuron-methyl, 2,4-D, or dicamba negatively affected either total (non-licorice) herbage production, nor the abundance of other native broadleaf forbs. While we had anticipated a potential negative impact on forbs within these grasslands due to herbicides, many of which have soil residual properties, forbs generally comprised a small fraction of the overall biomass (<35 g m−2, and 6.2% to 15.1% of total biomass in control treatments), which could have limited our ability to detect a response. Across both study sites, forb biomass generally was 50% to 75% lower following herbicide application (Table S3), but high variation in forb biomass among plots precluded the detection of significant differences. In any case, the limited negative effects of herbicides found here on grassland forbs is consistent with prior studies reporting that some native forbs have moderate to high tolerance to herbicides such as AMCP (Carter and Lym Reference Carter and Lym2018).
Licorice Responses to Seasonal Mowing
Total wild licorice biomass varied at both W3W and W5 sites in response to the interaction of mowing treatment × year of assessment (P < 0.0001). At both locations, broadcast mowing (early and late) of vegetation increased weed biomass in the first year relative to the nontreated control, although this increase was significantly different only under late mowing at W5 (Figure 4B). By the second year this response was evident under early and late mowing at both locations, with the largest increase in licorice at W5 from late mowing (Figure 4). However, during the third year of consecutive mowing treatments this pattern abruptly changed at both sites, with total licorice biomass declining after early mowing; this reduction was evident relative to all other treatments at W3W (Figure 4A) but only compared with the selective herb-removal treatment at W5 (Figure 4B). Notably, this pattern coincided with a general increase in licorice biomass within nontreated check treatments at both locations. By the fourth year, all differences between clipping treatments disappeared at both locations, which coincided with a general reduction in licorice biomass (Figure 4). This lack of differences persisted into the final year when growing season treatments were not imposed and plots were evaluated only after peak growth in August.
Total mean wild licorice biomass grown within plots subject to either early or late annual growing-season mowing, or selective herb removal in mid-summer, at each of the W3W (A) and W5 (B) study sites. Within a year, lowercase treatment means with different letters differ at P < 0.05. Nontreated means with different upper-case letters between years differ at P < 0.05. The first 4 yr included repeated annual treatments, while 2020 was post-treatment “recovery” only.

Figure 4 Long description
Panel A: A bar graph showing total wild licorice biomass at the W3W site. The horizontal axis represents the year of treatment and assessment from 2016 to 2020, while the vertical axis represents the biomass in grams per square meter. The graph includes four data series: Non-treated, Early mow, Selective def, and Late mow. Each year has four bars representing these treatments. Notable trends include variations in biomass across different treatments and years, with significant differences indicated by different letters. Panel B: A bar graph showing total wild licorice biomass at the W5 site. The horizontal axis represents the year of treatment and assessment from 2016 to 2020, while the vertical axis represents the biomass in grams per square meter. The graph includes four data series: Non-treated, Early mow, Selective def, and Late mow. Each year has four bars representing these treatments. Notable trends include variations in biomass across different treatments and years, with significant differences indicated by different letters.
Results of the controlled defoliation study reinforce the high tolerance of wild licorice to mowing during the growing season, although previous research has largely occurred in annual cropland (e.g., Melander et al. Reference Melander, Nørremark and Kristensen2013) rather than grasslands. Both early and late mowing led to an initial increase in the weed during the first 2 yr, and this response was particularly evident with late mowing. The net increase in licorice with mowing suggests that licorice exhibits compensatory growth under defoliation, particularly after late July, which likely occurs through the extensive regrowth of plants, both from buds remaining on cut stems near the soil surface, but also from the emergence of new shoots via the large root system (Boe and Wynia Reference Boe and Wynia1985). Increases in licorice during the first 2 yr may have been exacerbated by the favorable precipitation during this period, as licorice is known to have a phreatophyte growth habit and benefits from increased moisture, with wet conditions also favoring nitrogen fixation (Anderson and Nelson Reference Anderson and Nelson2014). The onset of drought conditions in Years 3 and 4 helps explain the sharp reversal in licorice abundance in plots subject to growing-season defoliation at that time.
The lone benefit of mowing in reducing wild licorice was evident at both sites during the first drought year, 2018, and only with early (spring) mowing. Although this benefit did not carry over into the second year of drought in 2019, it suggests that the effectiveness of any mowing treatment on licorice may depend on other conditions, such as soil moisture stress. Notably, by the third year of the defoliation treatments, wild licorice biomass had reached its peak in the nontreated check plots, as drier conditions thereafter reduced the weed. Licorice also demonstrated a positive response to the selective defoliation of neighboring herbaceous vegetation, although this effect was evident only during 2018, coincident with drought, and was inconsistent in magnitude between sites. Neighboring herb defoliation may have initially benefited licorice during low moisture by allowing the licorice plants to have greater access to water, as well as other available resources (nutrients), and is consistent with the notion that weed control in cultivated stands of licorice (Glycyrrhiza uralensis Fisch) leads to improvements in licorice yield and quality (Wang et al. Reference Wang, Ma, Liu, Bao, Niu and Li2024). Similar positive weed growth responses have been observed due to selective herbage defoliation in other problematic pasture weeds of western Canada (e.g., Cirsium arvense; De Bruijn et al. Reference De Bruijn, Bork and Grekul2010). Finally, the notable absence of any growing season mowing treatment effects during the final 2 yr of the study, including in 2020 when growing season treatments were no longer applied, highlights the high tolerance that licorice has for growing season defoliation, thereby rendering mowing a poor method of control for this species in perennial grasslands.
Practical Implications
Wild licorice is known to be increasing in the native grasslands of western Canada, particularly areas with sandy soils that are relatively more mesic, with little understanding of how to manage this plant. This study highlighted the inability of annual growing season mowing, regardless of plant growth stage, to control licorice, even when it has been treated repeatedly over several years, and instead demonstrated the tendency of licorice to increase under mowing when growing conditions are favorable. Thus, while perhaps visually appealing, and despite a short-term benefit to early season mowing during a drought year, the use of broadcast mowing as a remedy to treat localized infestations is not recommended for licorice control. Conversely, selective removal of neighboring forage, as is likely to occur where livestock graze, may contribute to increases in the abundance of the unpalatable wild licorice populations, thereby making the infestation worse. In these situations, the use of proper livestock stocking rates may be important to minimize licorice increases.
Unlike mowing, both hand-pulling and herbicide treatments applied in a single growing season were effective in reducing the density and biomass of wild licorice. While hand-pulling effects were marked, they lasted only 1 to 2 yr. Manual removal is also unlikely to be a feasible control option of licorice when the infested areas are large. For example, in the current study area, the proportion of grassland having licorice is estimated by the authors’ personal observations to be at least 20%. Thus, hand-pulling is unlikely to be used by land managers, particularly when repeated treatment would be needed every few years. Herbicides were generally more effective for licorice control, though they varied widely in efficacy, both among herbicides, and in their seasonality of application, with summer application being more effective than spring applications. Reductions in licorice were also inconsistent over time, disappearing with drought as weed abundance waned, only to have differences reappear when normal precipitation returned. These results are encouraging because they suggest that one-time herbicide applications during summer can lead to the long-term suppression of licorice for up to four growing seasons. However, it does not appear that the herbicides we tested resulted in consistently elevated forage production, raising uncertainty about the economic benefits of herbicide application for wild licorice management.
Supplementary material
The supplementary material for this article is available at https://doi.org/10.1017/wet.2026.10119.
Acknowledgments
We thank Anabel Dombro, Danielle Mai, Hanna Schoenberg, Sally Thomas, Kassia James, Anne Van Loon, Brendan Bischoff, Karli Begg, and Mary Villenueve for providing technical assistance with the field work. We also thank Don Armitage for fencing the study sites at study initiation and Marcel Busz for ranch site support.
Funding
This research received no specific grant from any funding agency, commercial or not-for-profit sectors. However, in-kind support was provided by the Rangeland Research Institute at the University of Alberta.
Competing Interests
The authors declare that they have no competing interests.






 Open access

