





1. Introduction
Teamwork is prevalent in a large share of modern production (Deming, Reference Deming2017). Individual contributions to team output are often ambiguous, both to team members themselves and to outside observers, giving particular weight to self-evaluations. Credit attribution for teamwork can have substantial consequences for career advancement (Sarsons et al., Reference Sarsons, Gërxhani, Reuben and Schram2021). At the same time, by the nature of teamwork, credit attributions are a zero-sum game. Thus, team members often face conflicting incentives when making claims about their contributions to teamwork: On the one hand, there is an incentive to exaggerate one’s own contributions; on the other hand, exaggerating can harm other team members by diminishing their recognition. This creates a unique and complex setting of misaligned incentives, which so far has received only limited scholarly attention. Sarsons et al. (Reference Sarsons, Gërxhani, Reuben and Schram2021) find that women are attributed less credit for their contributions to teamwork when they work together with men. A possible source for this bias could be a gender difference in claiming credit. Recent research shows that men and women differ in self-evaluations, both for individual work (Exley & Kessler, Reference Exley and Kessler2022) and teamwork (Isaksson, Reference Isaksson2018), and that men are more strategic in their self-evaluations (Brilon et al., Reference Brilon, Grassi, Grieder and Schulz2024; Charness et al., Reference Charness, Rustichini and Van de Ven2018). If men and women differ in claiming credit for their contributions to teamwork, this could add to the gender pay gap.
In this paper, we study gender differences in claiming credit for contributions to teamwork under misaligned incentives. We conduct a large-scale online experiment where participants interactively solve a puzzle in teams of two and then claim credit for their contribution. Our design allows us to measure each team member’s actual contribution and compare claims of equally performing men and women. In the Split Bonus Treatment, we mirror the misaligned incentive structure observed in many labour market settings: It is in participants’ financial best interest to exaggerate their contribution, but exaggerating harms the other team member. In this setting, we find that men claim to have contributed more than equally contributing women.
Two plausible explanations for this gender gap are that women care more about the other team member’s payoff than men (i.e., a difference in altruism) or that men and women differ in their self-assessment abilities (i.e., a difference in overconfidence). We provide a theoretical framework to model these potential mechanisms and employ two between-subject treatments to test them.
In the Individual Bonus Treatment, the participant’s claim no longer affects the other team member’s payoff. Thereby, we eliminate the impact of preferences over the other team member’s payoff on claims. This manipulation directly isolates what Fehr and Fischbacher (Reference Fehr and Fischbacher2002) call “pure altruism”, i.e., where “...a person values the material resources allocated to a relevant reference agent positively” (page 3). We discuss other social preferences, such as inequality aversion and how they might affect claims in Section 4.2.1. The comparison of the Individual Bonus with the Split Bonus Treatment identifies the influence of altruism on claims. The gender claim-gap persists; thus, we find no support for this mechanism being the primary driver for the gender gap in claims.
To test if the gender gap is caused by differences in self-assessment abilities, in the Accuracy Treatment, we incentivise participants to estimate their contribution accurately. Following previous literature, we measure overconfidence as the difference between incentivised beliefs and actual performance (e.g., Bordalo et al., Reference Bordalo, Coffman, Gennaioli and Shleifer2019) (see also Section 3). We find no gender difference in claims in the Accuracy Treatment. Because of this, we conclude that differences in overconfidence are not the main driver of the gender claim-gap.
We acknowledge that several other mechanisms could explain the gender claim-gap: Gender differences in lying aversion, in the weight given to payoff relative to other preferences, and inequality aversion could also explain our findings. In this paper, we experimentally test the mechanisms of altruism and of overconfidence with high statistical power rather than testing more channels with insufficient power. We provide exploratory evidence suggesting that gender differences in lying aversion, payoff weights, and inequality aversion may indeed be important mechanisms.
This paper contributes to the literature on gender differences in self-assessments. Previous research has focused on settings with financial incentives to be accurate (Bordalo et al., Reference Bordalo, Coffman, Gennaioli and Shleifer2019; Isaksson, Reference Isaksson2018; Ring et al., Reference Ring, Neyse, David-Barett and Schmidt2016; Sutter & Glätzle-Rützler, Reference Sutter and Glätzle-Rützler2015), no financial incentives at all (Buser et al., Reference Buser, Grimalda, Putterman and van der Weele2020; Haynes & Heilman, Reference Haynes and Heilman2013; Saccardo et al., Reference Saccardo, Pietrasz and Gneezy2018), or compared both these schemes (Neyse et al., Reference Neyse, Bosworth, Ring and Schmidt2016). A number of studies also investigate the effect of making self-assessments public (Ewers & Zimmermann, Reference Ewers and Zimmermann2015; Haeckl, Reference Haeckl2022; Ludwig et al., Reference Ludwig, Fellner-Röhling and Thoma2017). However, there is limited research on self-assessments with financial incentives to exaggerate. A notable exception is Exley & Kessler (Reference Exley and Kessler2022), who study gender differences in self-promotion. In their experiment, participants evaluate their own performance subjectively, and this evaluation is later shown to “potential employers”. Subjects thus have an incentive to evaluate themselves favourably. Whereas Exley & Kessler (Reference Exley and Kessler2022) study qualitative, and thus inherently subjective self-evaluations, our experimental design includes an objectively correct claim, which we term the participant’s “actual contribution”. This enables us to make comparisons that would not be possible otherwise: First, we can compare claims to actual contributions. Second, we can compare claims under the incentive to exaggerate with claims under the incentive to be accurate in the same task and setting. Exley & Kessler (Reference Exley and Kessler2022) find that when there is an incentive to exaggerate, men evaluate themselves more favourably than women. Our results indicate that this pattern also extends to a teamwork setting with misaligned incentives.
The paper also contributes to the literature on gender differences in social preferences. Isaksson (Reference Isaksson2018) studies gender differences in claiming credit for teamwork, absent the influence of social preferences. In a setting where participants know the gender of the other team member and there is an incentive to self-evaluate accurately, Isaksson (Reference Isaksson2018) finds that men believe they have contributed more than equally contributing women. In our experiment, we introduce misaligned incentives between team members such that the utility derived from the other team member’s payoff influences claims. Participants can exaggerate their contribution and increase their own expected payoff by taking away from the other team member. This mirrors a key attribute of teamwork: credit for contributions is a zero-sum game—i.e., the more one team member gets, the less remains for others. Prior research on gender differences in social preferences suggests that men and women may take externalities on their team member into account differently (Croson and Gneezy, Reference Croson and Gneezy2009). Exploiting our treatment variation, we show that the gender gap in credit claiming remains, irrespective of whether claims affect the other team member or not. This suggests that gender differences in altruism are not a primary driver behind the gender claim-gap.
We further contribute to the emerging strand of literature documenting “distributional” gender differences, that is, the distributions of behaviour of men and women differ more than just in the mean. With our work, we add to the growing recognition that focusing solely on gender differences in means may underestimate the true extent of these differences (Thöni & Volk, Reference Thöni and Volk2021). We find that gender differences in credit claiming are most pronounced at the upper tail of the claim-distribution, that is, for very large claims. Further, we only find a gender gap among high contributors. This has potentially important consequences for gender equity, because large contribution claims and claims by high contributors likely have the most substantial impact on labour market outcomes.
Our findings have important implications for the design of performance evaluation systems, especially in settings where individual contributions to teamwork are difficult to observe. First, misattributed credit in teams can lead to loss of allocative efficiency, discouraging honest effort while encouraging strategic exaggeration. We show that team members respond to incentives to exaggerate, leading to claims significantly above actual contributions. As accuracy incentives reduce but do not entirely eliminate overclaiming, evaluation systems should rely less on self-reports and instead place greater weight on objective, transparent measures. At the same time, alternative evaluators such as peers or supervisors may themselves be subject to attribution biases (e.g., Sarsons et al., Reference Sarsons, Gërxhani, Reuben and Schram2021). Such evaluations should therefore be viewed as mitigating rather than eliminating potential sources of bias.
Second, gender differences in claiming credit may add to the gender pay gap. We find that when there is an incentive to exaggerate, men claim to have contributed more than equally contributing women. Thus, performance evaluations that rely on self-assessments may reinforce gender disparities. However, the disappearance of the gender gap under accuracy incentives suggests a practical remedy: Incentive systems that reward accuracy or rely on objective measures can help to promote fair and equitable outcomes.
The remainder of the paper is structured as follows: We first introduce the experimental design, the team task and treatments in Section 2. Section 3 describes our hypotheses before we report the results in Section 4. Section 5 discusses the results, and Section 6 concludes.
2. Experimental design and data
We conducted an online experiment in which participants were randomly assigned into teams of two, performed a team task together, and then estimated (“claimed”) their individual contribution to the teamwork. We used a between-subject treatment design to vary the incentives for claiming contributions to the team task. The experiment was preregistered at the OSF registry.Footnote 1 The following section describes the team task before explaining all steps of the experiment in more detail.
2.1. The team task
Participants worked on an incentivised, interactive, real-effort sliding-puzzle. This task is also used in other experiments (e.g., Bartoš et al., Reference Bartoš, Glogowsky and Rincke2025; Isaksson, Reference Isaksson2018; Takahashi, Reference Takahashi2025). The goal of the puzzle was to arrange eight numbered tiles in a three-by-three grid in ascending order. The two team members took turns to move a tile by clicking on it. See Figure 1 for an example of such a sliding-puzzle. Because there was time pressure to solve the puzzle in less than two minutes, it was in the team’s best interest to use the minimal number of moves (Isaksson, Reference Isaksson2018). Participants had no information about the other team member and no means of communicating.
Example of a sliding puzzle

The sliding-puzzle task has two useful characteristics. First, the task is gender-neutral: on average, men and women are equally good at solving the puzzle (Isaksson, Reference Isaksson2018) and also hold gender-neutral beliefs about ability in the puzzle, that is, both men and women believe there are no gender differences in solving the puzzle (Takahashi, Reference Takahashi2025). The mean number of individually solved puzzles in our sample is 5.10 for men and 5.11 for women ( $p= 0.89$ for a two-sided two-sample t-test). Second, participants’ actual contributions are directly observed by the researchers but not by the participants. While participants knew how their actual contribution was defined (see Equation (1) below), it was challenging to compute it while solving the puzzle. Hence, there was ambiguity regarding both team members’ contributions. Participants thus also had to rely on subjective judgment for their claim. This is supported by the small but positive and statistically significant correlation between actual contribution and claims across all treatments (
 $r=0.12, p \lt 0.01$). The correlation does not differ between genders (
 $p=0.61$).Footnote 2
2.2. Defining actual contribution
Given the large variety in conceptualisations of contributions, it is important to clearly define and communicate how contribution is measured in this specific setting. To ensure that participants had a common understanding, we gave participants a simple, coherent definition of actual contribution before the team task: For every solvable permutation of the puzzle, there exists a minimal number of moves required to reach the solution. Following Isaksson (Reference Isaksson2018), we define a good move as one which reduces, and a bad move as one which increases the minimal number of moves needed to solve the puzzle. There are no neutral moves. The categorisation of moves into good and bad moves allows for measuring each team member’s individual contribution to solving the team task. Conditional on having solved the puzzle, team member A’s actual contribution is defined as:
 \begin{equation}
\frac{\text{A's good moves $-$ A's bad moves}}{\text{(Team's good moves $-$ Team's bad moves)}}*100
\end{equation}
For any solved puzzle, the sum of both team members’ contributions is 100, and each team member’s contribution can be interpreted as the percentage they have contributed to solving the puzzle. For border cases, for example when one participant had made zero good moves, we truncated the range of actual contributions at 0 and 100. We ensured that participants knew and understood how contributions are measured using comprehension check questions and a practice example.
We restrict our main analysis to solved puzzles (roughly 70 % of all puzzles, see Section 2.4).Footnote 3 Two key factors drove this decision. First, our research question is primarily concerned with successful teamwork, because successful teamwork is most relevant in the labour market (Isaksson, Reference Isaksson2018). Second, assessing contributions to unsolved puzzles requires making additional auxiliary assumptions, which may complicate our analysis. For instance, actual contribution is undefined for an unsolved puzzle where the total sum of good and bad moves is 0. In Section 4.3 we report exploratory analyses of unsolved puzzles.
2.3. Experiment procedure
The following paragraphs explain the procedure of the experiment in detail, as visually represented in Figure 2. The participant instructions can be found in “Online Resource 1”.
Experimental sequence

2.3.1. Part 1: individual round
Participants first worked on the sliding-puzzle individually to become familiar with the task. They had one minute to solve as many puzzles as they could. For each solved puzzle, participants earned 2 points. We use the number of solved puzzles during the individual round as a proxy for individual skill (Isaksson, Reference Isaksson2018). Afterwards, participants were introduced to the contribution formula and asked to calculate the actual contribution in an example as a comprehension check.
2.3.2. Part 2: three team rounds
Next, participants attempted to solve the puzzle in randomly assigned teams of two and subsequently claimed their contribution. Participants were matched with a team member by arrival time. Teams are anonymous, i.e., team members know they are playing with another person, but they do not know each other’s gender or other personal details.
Part 2 was repeated over three rounds, with rematching between all rounds. Collecting repeated observations over three rounds provides the following advantages beyond the gain in observations: First, we can reduce measurement noise on the individual level by observing each individual thrice rather than just once. This helps level out outlier observations that could occur, for example, when a participant was randomly matched with a “bad team member”, or the team just had “a bad round”. Second, this allows us to still include individuals who did not solve the puzzle in all rounds when we exclude observations from unsolved puzzles. With each of the rounds, puzzles got more difficult, as measured by the minimal number of moves required to solve the puzzle (from six to seven to ten moves). We did this because for more difficult puzzles, the optimal strategy is less salient, leaving more room for error and subjectivity in claims. Importantly, contribution claims remain comparable across rounds because they depend on the relative, not the absolute number of good and bad moves.
Teams had two minutes to solve a sliding-puzzle. After every round, participants were asked to claim their individual contribution. They were instructed as follows. The incentives for the respective treatments were explained before we asked participants to enter their claim: “Please make your claim about your contribution to the puzzle task on a scale from 0% to 100%”. Participants did not receive feedback about their own or their team member’s actual contribution. Claims were not revealed either, and this was common knowledge. We ensured understanding through a main comprehension check where participants had to confirm that their claim would not be seen by the other team member and demonstrate knowledge about their incentive scheme, that is, whether their claim could affect the other team member’s bonus and whether accuracy of claims mattered as laid out in the section below. The computer randomly selected one of the three rounds for the payoff. Each team member got 25 points if the team had solved the puzzle in the selected round.
2.3.3. Treatments
Regardless of solving the puzzle, participants could earn a bonus payment for their claim in the selected round in all treatments. We varied the incentives participants had to claim their contribution in three between-subject treatments. Note that in any of the treatments, the financial incentive to exaggerate did not depend on what the other team member claimed.
In the Split Bonus Treatment, the expected value of participants’ bonus payments increased with the claim, but at the cost of the other team member. After both team members had submitted their claims, one team member was randomly selected whose claim determined the bonus payments for both team members. If participant  $i$’s claim
 $c_i \in [0, 1]$ was selected, then
 $i$’s bonus payment was
 $p_i = 100c_i$ and their team member
 $j$’s bonus payment was
 $p_j = 100 - p_i$. We explained this to the participants in the instructions, saying that: “If your claim determines both bonuses, then you will get your own claim in points as a bonus, and the other participant will get the remainder (i.e., 100 points minus your claim). This means your claim affects the other participant’s bonus. If the other participant’s claim determines both bonuses, then the other participant will get her/his claim in points, and you will get the remainder (i.e., 100 points minus the other participant’s claim).”
In the Individual Bonus Treatment, we kept the financial incentive to exaggerate, but we removed the link between the participant’s claim and the other team member’s payoff. That is, we excluded the effect of altruism on claims by design. Like in the Split Bonus Treatment, the expected value of participants’ bonus payments increased with their claim. That is,  $p_i = 100c_i$, where
 $p_i$ is
 $i$’s payoff, and
 $c_i \in [0, 1]$ is
 $i$’s claim. Participants in the Individual Bonus Treatment thus had a financial incentive to exaggerate. However, each team member received a bonus from an individual budget, that is, the claims are not zero-sum. We instructed the participants, stating that: “[...] each of you will get your own claim in points as a bonus, no matter what the other participant stated. That is, if you claim to have contributed X%, you will get a bonus of X points, no matter what the other participant stated. Similarly, if the other participant claims to have contributed Y%, she/he will get a bonus of Y points, no matter what you stated. Your claim does not affect the other participant’s bonus.”
With the Accuracy Treatment, we elicited participants’ ability to estimate their own contribution under incentives to be accurate. Following the literature, we define overconfidence as an overestimation in incentivised self-assessments (e.g., Bordalo et al., Reference Bordalo, Coffman, Gennaioli and Shleifer2019; Cavalan et al., Reference Cavalan, de Gardelle and Vergnaud2022; Grosch & Fischer, Reference Grosch and Fischer2024; Niederle & Vesterlund, Reference Niederle and Vesterlund2007). Operationally, we measure overconfidence as the difference between a participant’s claim in the Accuracy Treatment and their actual contribution. Participants earned a bonus payment that was greater in expected value the closer their claim was to their actual contribution. It was thus in participants’ financial best interest to report their best estimate of their own contribution. To keep altruistic concerns towards the other team member eliminated, the claim did not affect the team member’s payoff. The bonus was determined according to the binarised scoring rule (BSR) (Hossain & Okui, Reference Hossain and Okui2013).
The BSR is a “proper scoring rule” independent of risk attitudes, but may facilitate distortion in beliefs if participants receive elaborate information on the incentives (Danz et al., Reference Danz, Vesterlund and Wilson2022). To avoid that, we used simple, verbal instructions stating that “[...] the closer your claim is to your own actual contribution, the higher your chances of receiving a bonus of 100 points. That is, the more accurate your claim, the higher your bonus, so you should claim what you truly think your contribution was.” We also highlighted that “Your claim does not affect the other participant’s bonus.” Participants could read a more detailed description of the payoff function by clicking a button, but few did so (128 out of 845 participants).
Note that in the Split Bonus Treatment, a participant’s claim is payoff-relevant with a 50% chance, which allows obtaining relevant claims from both participants. To keep the three treatments comparable, in the Individual Bonus and the Accuracy Treatments, there was a 50% chance that both team members received a random bonus payment drawn from a uniform distribution between 0 and 100. Otherwise, the payment was determined as indicated in the treatment descriptions above.
Randomisation into treatment groups happened at the session level. In total, we ran 29 sessions with an average number of 96 participants per session. The treatment was randomly drawn before the session, and the respective oTree (Chen et al., Reference Chen, Schonger and Wickens2016) program was run. We employed a between-subject design to avoid experimenter-demand effects, so participants stayed within their experimental treatment group across all rounds. In Table 1, we show that the treatment groups are generally comparable, and we control for factors where they are not.
2.3.4. Part 3: post-experiment questionnaire
After the three team rounds, participants filled out a short questionnaire. We asked participants to “[p]lease explain in a few words how you decided how much to claim”. The open responses to this question were sorted into seven pre-specified, non-exclusive categories by two independent research assistants who were blind to treatment and gender. The categories were developed by the authors based on a random subset of 30 responses, without knowing respondents’ details. They capture the most relevant reasons for making claims and include whether the decision was based on perceived contribution, fairness concerns, splitting credit equally, taking blame for a mistake, blaming the other team member for a mistake, maximising one’s payoff and deciding randomly. For a more detailed description of each category see Appendix D. The interrater-reliability is moderate ( $\kappa$ above 0.48% for all categories).Footnote 4 We use a conservative coding approach in that a statement falls into a category only if both research assistants selected it. Next, we collected an indicative measure of other preferences and personal traits. We refer to these measures as stated traits. We asked participants whether they agree or disagree with several statements on a five-point Likert scale from 1 (strongly disagree) to 5 (strongly agree). In this way, we elicited stated advantageous/disadvantageous inequality aversion (“I dislike if I get a greater/smaller bonus than other participants”), trust (“In general, one can trust other people”,Dohmen et al., Reference Dohmen, Falk, Huffman and Sunde2008), altruism (“I am generally willing to share with other people without expecting anything in return”,Falk et al., Reference Falk, Becker, Dohmen, Enke, Huffman and Sunde2018), meritocratic fairness principles (“Those participants who contributed more should get a greater bonus”), egalitarian fairness principles (“All participants should get the same bonus regardless of their contribution”), and team identification (“I felt connected with the other participants”). We also asked participants how much they believed the other team member had claimed in the final round. This question was incentivised. Participants also reported their age, level of education, income, and gender. While we recruited only participants who identify with a binary gender on Prolific, 33 participants selected “other” as their gender in the post-experiment questionnaire. In our analysis, for these participants, we use the binary gender they had indicated on their Prolific profile. A detailed description of all collected variables can be found in Appendix A. No feedback was given during the entire experiment. Only after answering the questionnaire, participants were informed about their earnings. We provided only vague information about the composition of total earnings to keep the other team member’s claim in the Split Bonus Treatment ambiguous.
2.3.5. Generalisability
We study credit claiming for teamwork in an experiment because this gives us precise control over participants’ decision context. The experimental design mimics the key features of the workplace setting we are interested in while abstracting from other aspects. At a basic level, a professional teamwork setting involves (1) some jointly and often interactively produced team output (Isaksson, Reference Isaksson2018) to which (2) contribution is zero-sum and often ambiguous (Haynes & Heilman, Reference Haynes and Heilman2013). Other common but not ubiquitous features are (3) some social context, including behavioural norms and (4) an ongoing relationship between team members. With (1) and (2), the basic credit-claiming decision is affected by individual-level factors such as payoff maximisation and altruism towards the other team member. With (3) and (4), extensions such as social norms and reputation concerns may play a role. It is crucial to understand the basic setting before extending to richer settings. Because of this, the experiment incorporates features (1) and (2), while deliberately removing (3) and (4). Team output is jointly and interactively produced, and contributions to the output are clearly defined and zero-sum and, at the same time, ambiguous to team members. The interactive nature of our team task distinguishes this paper from much previous experimental research on teamwork, which uses joint individual production tasks (Bruhin et al., Reference Bruhin, Petros and Santos-Pinto2024; Cavalan et al., Reference Cavalan, de Gardelle and Vergnaud2022; Haynes & Heilman, Reference Haynes and Heilman2013; Solda et al., Reference Solda, Ke, Page and Von Hippel2020). We remove reputation concerns by keeping participants anonymous and minimising social context. This allows us to study the impact of altruism and overconfidence on credit claiming in a cleanly identified way. We discuss which mechanisms our experiment can identify in more detail in Section 3. It is plausible that (3) and (4) also affect credit-claiming behaviour. Whether and in what way this is the case remains an empirical question. We discuss possible extensions of our design to address these questions in Section 6.
2.3.6. Data collection
The study was conducted on the survey platform Prolific in the spring of 2022. The experiment was neutrally described as a “decision-making study” to avoid sample self-selection. We chose to conduct the experiment online because this gave us access to a large and diverse sample.
We recruited participants from the US and UK of working age (18 to 66 years) to maximise the eligible sample. To ensure high data quality, other pre-screeners included speaking English fluently and a high Prolific completion score (> 90% of begun studies successfully completed). To maximise the power to detect gender differences, we employed a gender balance of 50:50 across treatments.
Throughout the experiment, participants could collect points. At the end of the experiment, points were converted into a bonus payment at the exchange rate 1 point = 0.5 British Pence. Independent of the bonus payment, participants earned a completion fee of  $\unicode{x00A3}$1.20. The median total earnings were
 $\unicode{x00A3}$1.64, and the median duration of the experiment was 11.83 minutes. This corresponds to an hourly wage of
 $\unicode{x00A3}$8.32, which exceeds the platform’s allowed minimum pay (
 $\unicode{x00A3}$5.00) and recommended pay (
 $\unicode{x00A3}$7.50) per hour at the time of data collection. Before the online experiment, we ran pilot sessions to ensure comprehensibility of the instructions and a functioning technical setup. Observations from the pilot are not included in the analysis.
2.4. Descriptive statistics
In our main sample, we recruited 2747 participants who each participated in three rounds, giving us a total of 8241 observations. According to an ex-ante power analysis, this allows us to estimate difference-in-difference effects as small as 4.5 percentage points, which corresponds to the magnitude of the effect found by Isaksson (Reference Isaksson2018) (see Appendix B.1). For all analyses, we exclude 219 participants who failed the main comprehension check twice, because we cannot assume that these participants have understood the incentives. For the main analysis, we restrict the sample to solved puzzles. 80.34% of all teams solved the puzzle in round 1, 81.47% in round 2 and 47.65% in round 3, where puzzle difficulty increased with each round. Across all three rounds, this leaves us with 5302 observations of credit claims made by 2456 unique participants. The average claim is around 60% and remains steady across all three rounds. Table 1 shows the mean age, percentage of women and UK residents, and the mean number of individual puzzles solved in one minute (individual skill) across the three treatment groups. The percentage of women is close to 50% in all three groups. The mean age is statistically significantly different between groups, but the difference is negligibly small. We control for age in Appendix B.2. We randomly assigned treatments on the session level, and we increased the size of sessions over time. Because we unexpectedly depleted the pool of active UK subjects on Prolific and had to resort to recruiting US residents, the share of UK residents is highly statistically significantly uneven between treatment groups. To account for this, we control for country of residence in all the following regressions. We report country-specific estimates in Appendix B.3. However, as country differences are not part of our original, pre-registered research question and because of the uneven distribution of countries between treatment groups, we refrain from interpreting any country-specific effects here and invite future research to study this.
Treatment group comparisons

Table 1 Long description
Three treatment groups are compared across Participants, Age, Women, UK, and Individual skill, with a final column listing p-values for differences across groups. Participants are 822 in Split Bonus, 789 in Individual Bonus, and 845 in Accuracy. Age averages 32.12 for Split Bonus, 30.93 for Individual Bonus, and 31.02 for Accuracy, with a reported p-value below 0.01 and three asterisks. Women are 50.49 in Split Bonus, 50.57 in Individual Bonus, and 50.77 in Accuracy, with p-value 0.99. UK is 88.44 in Split Bonus, 69.20 in Individual Bonus, and 55.27 in Accuracy, with a reported p-value below 0.01 and three asterisks. Individual skill is 5.12 in Split Bonus, 5.16 in Individual Bonus, and 5.05 in Accuracy, with p-value 0.28.
Note: Mean age, percentage of women, percentage of UK residents, and individual skill in the three treatment groups, for the sample excluding unsolved puzzles and participants who failed the attention check.  $p$-values of an ANOVA test for differences in means of age and individual skill, and of
 $\chi^2$-tests for differences in distributions for women and UK.
The number of puzzles solved individually in one minute indicates individual skill (see Section 2.3.1). We find no difference in individual skill between men and women. Men solve 5.10 puzzles, and women solve 5.11 puzzles on average (p $=0.89$).
3. Theoretical model and hypotheses
In this section, we introduce a simple model of claiming behaviour, which serves as a framework for analysing the factors that influence claims and for formulating our hypotheses. Individual  $i$ chooses her claim
 $c_i \in [0, 1]$ to maximise her utility:
 \begin{equation*}
U_i = \pi p^T_i(c_i) + \lambda p_j^T(c_i) - \kappa (c_i - b_i)^2
\end{equation*}
 \begin{equation*}
b_i = a_i + e; e \sim \mathcal{N}(\mu, \sigma^2)
\end{equation*}
where  $\pi\geq0$ is the weight given to payoff,
 $\lambda\geq0$ is the weight given to altruism, and
 $\kappa\geq0$ is the weight given to accurate claims.
 $b_i \in [0, 1]$ is
 $i$’s true belief about her contribution, which depends on her actual contribution
 $a_i \in [0, 1]$ and an error term
 $e$.
 $p_i^T$ is
 $i$’s payoff, which depends on
 $c_i$ according to treatment
 $T \in \{S, I, A\}$ (Split Bonus, Individual Bonus, and Accuracy):
 \begin{equation*}
p^S_i = 100c_i; \; p^S_j = 100-100c_i
\end{equation*}
 \begin{equation*}
p^I_i=100c_i
\end{equation*}
 \begin{equation*}
p^A_i=
\begin{cases}
100, & \text{if } l \leq n \\
0, & \text{if } l \gt n
\end{cases}
\text{ where } l = (c_i-a_i)^2; n \sim \mathcal{U}[0, 1]
\end{equation*}
 $p_j^T$ is the other team member
 $j$’s payoff, which depends on
 $c_i$ only in the Split Bonus Treatment and is independent of
 $c_i$ otherwise.
 $\lambda$ thus captures the weight of utility derived from the other team member’s payoff, that is, altruism. We abstract from other social preferences, such as fairness, inequality aversion (Fehr & Schmidt, Reference Fehr and Schmidt1999), or adherence to social norms, and so on at this point.
 $-\kappa (c_i-b_i)^2$ represents the intrinsic disutility from claims that deviate from beliefs. In sum, when
 $i$ chooses her claim, she considers her own payoff, the other team member’s payoff and her belief about her contribution.
 $p_i^A$ is the binarised scoring rule (Hossain & Okui, Reference Hossain and Okui2013), such that
 $\frac{\partial \mathbb{E}(p_i^A)}{\partial \lvert c_i-b_i \rvert} \lt 0$. If we assume purely selfish preferences such that
 $\pi \gt 0, \lambda = \kappa = 0$, i.e.,
 $i$ only cares about her own payoff, then
 $i$ claims 100% in Split Bonus and Individual Bonus and her belief in Accuracy
 $c^S_i = 1$,
 $c^I_i = 1$,
 $c^A_i=b_i$.
Next, let us assume there are social preferences and a preference for accurate claims, that is,  $\lambda \gt 0,\; \kappa \gt 0$. We begin by considering the Split Bonus Treatment, where there are misaligned incentives between team members. Previous research has found that women behave more socially in allocation tasks. Andreoni and Vesterlund (Reference Andreoni and Vesterlund2001) document that women behave more kindly than men in a modified dictator game, where a benevolent allocation is costly. Halladay and Landsman (Reference Halladay and Landsman2024) find that women take less than men in a taking-framed dictator game with earned endowments. See Croson and Gneezy (Reference Croson and Gneezy2009) for an overview of the literature. This suggests that women may have stronger altruistic preferences than men in our setting:
 $\lambda_W \gt \lambda_M$ (where
 $W$ denotes women and
 $M$ denotes men). All else equal,
 $\lambda_W \gt \lambda_M \implies c^S_W \lt c^S_M$. Other research finds gender differences in willingness to lie (Abeler et al., Reference Abeler, Nosenzo and Raymond2019; Conrads et al., Reference Conrads, Irlenbusch, Rilke and Walkowitz2013; Dreber & Johannesson, Reference Dreber and Johannesson2008; Friesen & Gangadharan, Reference Friesen and Gangadharan2012; Grosch & Rau, Reference Grosch and Rau2017). Women are less willing to lie than men when lying has negative externalities (Capraro, Reference Capraro2018; Erat & Gneezy, Reference Erat and Gneezy2012). This suggests that
 $\kappa_W \gt \kappa_M$, which implies
 $c^S_W - b_W \lt c^S_M - b_M$. If we assume that
 $b_W=b_M$, then
 $c^S_W \lt c^S_M$, c.p. Further, research on self-assessments has found men to be more overconfident than women (Bordalo et al., Reference Bordalo, Coffman, Gennaioli and Shleifer2016; Bordalo et al., Reference Bordalo, Coffman, Gennaioli and Shleifer2019; Exley & Kessler, Reference Exley and Kessler2022; Isaksson, Reference Isaksson2018), with some notable exceptions which find no gender difference (Brilon et al., Reference Brilon, Grassi, Grieder and Schulz2024) or find that gender differences are context dependent (Grosch & Fischer, Reference Grosch and Fischer2024; Haeckl, Reference Haeckl2022; Ludwig et al., Reference Ludwig, Fellner-Röhling and Thoma2017). If men are more overconfident than women, their belief will be biased upwards such that
 $\mu_M \gt \mu_W \implies b_M \gt b_W \implies c_M \gt c_W$, c.p. Based on the implications of both altruism and overconfidence, we derive the following hypothesis.
Hypothesis 1: When there is an incentive to exaggerate at the cost of the team member, men claim more than women after controlling for actual contribution.
In the Individual Bonus Treatment, we remove the link between  $c_i$ and
 $p_j$. Thus, altruistic preferences
 $\lambda$ no longer affect claims. Because of this, the comparison to the Split Bonus Treatment identifies the effect of
 $\lambda$ on claims. In particular, if a gender claim-gap is caused by gender differences in altruism, then this will be captured by the difference-in-differences in claims between men and women in the Individual Bonus and Split Bonus treatments, i.e
 $\lambda_W \gt \lambda_M \iff (c^S_M-c^S_W)-(c^I_M-c^I_W) \gt 0$. With
 $\lambda \gt 0$, claims will also be greater if they do not negatively affect the other team member’s payoff, i.e.,
 $c^I \gt c^S$. We therefore test the following hypotheses.
Hypothesis 2a: When there is an incentive to exaggerate without affecting the other team member, men claim more than women after controlling for actual contribution.
Hypothesis 2b: Men increase their claims more than women when there is an incentive to exaggerate without affecting the other team member, compared to when exaggeration is at the cost of the team member.
Another possible explanation for a gender claim-gap could be gender differences in self-assessment abilities. In the Accuracy Treatment, we give participants the incentive to make accurate claims. Here,  $U_i$ is at a maximum where
 $c_i^A = b_i$. Following a large strand of literature on overconfidence (Bordalo et al., Reference Bordalo, Coffman, Gennaioli and Shleifer2019; Cavalan et al., Reference Cavalan, de Gardelle and Vergnaud2022; Grosch & Fischer, Reference Grosch and Fischer2024; Niederle & Vesterlund, Reference Niederle and Vesterlund2007), we define overconfidence as the difference between beliefs and actual performance
 $b_i - a_i$. With the Accuracy Treatment, we measure overconfidence because
 $c_i^A = b_i \implies c^A_i - a_i = b_i - a_i$. This means that if men are more overconfident than women, men will claim more in the Accuracy Treatment than women, i.e.,
 $b_M \gt b_W \iff c^A_M \gt c^A_W$ (controlling for actual contribution). When comparing to the Split Bonus and Individual Bonus Treatments,
 $\frac{\partial p^S_i}{\partial c_i}$ and
 $\frac{\partial p^I_i}{\partial c_i}$ are strictly positive. Hence, optimizing
 $p_i^S$ and
 $p_i^I$ with respect to
 $c_i$ requires maximising
 $c_i$. In contrast, optimising
 $p_i^A$ with respect to
 $c_i$ has an inner solution depending on
 $b_i$. Therefore,
 $c^A \lt c^S$ and
 $c^A \lt c^I$. The difference-in-differences between men and women in the Accuracy and Individual Bonus Treatments identifies a potential gender difference in how much participants care about their payoff, relative to making accurate claims. That is
 $\pi_M \gt \pi_W \iff (c^I_M-c^I_W) - (c^A_M - c^A_W) \gt 0$, c.p. We, therefore, test the following hypotheses.
Hypothesis 3a: When there is an incentive to be accurate, men claim more than women after controlling for actual contribution.
Hypothesis 3b: Men increase their claims more than women when there is an incentive to exaggerate at the cost of the team member, compared to when there is an incentive to be accurate.Footnote 5
Hypothesis 3c: Men increase their claims more than women when there is an incentive to exaggerate without affecting the other team member, compared to when there is an incentive to be accurate.
In the final set of hypotheses, we test the direct treatment effects predicted by the model. Previous behavioural research shows that strategic or financial incentives to exaggerate can lead people to increase self-evaluations and reported confidence (Schwardmann & Van der Weele, Reference Schwardmann and Van der Weele2019; Solda et al., Reference Solda, Ke, Page and Von Hippel2020; Exley & Kessler, Reference Exley and Kessler2022), and that people are willing to lie for financial gain (Fischbacher & Föllmi-Heusi, Reference Fischbacher and Föllmi-Heusi2013; Abeler et al., Reference Abeler, Nosenzo and Raymond2019). However, individuals tend to cheat less when it harms another participant compared to when it harms the experimenter (Meub et al., Reference Meub, Proeger, Schneider and Bizer2016). Moreover, Hermann and Muß hoff (Reference Hermann and Mußhoff2019) find that intrinsic costs for stealing are larger than for lying and exaggerating in the Split Bonus Treatment, which might be interpreted as stealing from the other team member. At the same time, a desire-to-win effect can dominate social preference concerns (Dato et al., Reference Dato, Feess and Nieken2024) and might thus facilitate more lying. Taken together, we expect smaller claims when exaggerating harms the other team member (Split Bonus Treatment) compared to when the other team member is not affected (Individual Bonus Treatment), i.e.,  $c^S \lt c^I$. We expect claims to be greater when it pays to exaggerate (Split Bonus and Individual Bonus Treatments) than when it pays to be accurate (Accuracy Treatment), that is,
 $c^A \lt c^I$,
 $c^A \lt c^S$.
Hypothesis 4a: When there is an incentive to exaggerate at the cost of the other team member, individuals claim less than when the team member is not affected.
Hypothesis 4b: When there is an incentive to exaggerate without affecting the other team member, individuals claim more than when there is an incentive to be accurate.
Hypothesis 4c: When there is an incentive to exaggerate at the cost of the other team member, individuals claim more than when there is an incentive to be accurate.Footnote 6
We preregistered the hypotheses at OSF in March 2022.Footnote 7
4. Results
In this section, we first report the main results of testing the hypotheses listed in Section 3, before looking into exploratory analyses in subsections 4.2 and 4.3.
Table 2 shows regressions of claims on gender and treatment. In the main body of the paper, we report the results of panel regressions over the three rounds using the sample of solved puzzles, including round fixed effects, participant random effects and clustered standard errors at the participant level. This specification gives us the greatest statistical power. A potential threat to this specification would be if claiming behaviour evolves differently across rounds by gender, with increasing puzzle difficulty. We estimate regressions with round-gender interactions in Appendix B.12 and do not find evidence for systematic differences in claims across rounds between men and women. In all regressions, we control for country of residence as described in Section 2.4 and actual contribution, allowing us to compare equally contributing participants. For more conservative estimates, we also report the results of regressions using only data from round 1 in Appendix B.5, as well as regressions using the participant’s average claim across all solved rounds in Appendix B.11. The results are comparable, though effect sizes are slightly smaller in round 1, and gender differences are not significant, likely because of reduced statistical power.
Regressions of claim on treatment and gender

Table 2 Long description
Regression results report the dependent variable, Claim, across five model columns labeled 1 through 5. Women has coefficients of minus 2.96 with standard error 1.12 in column 1, minus 2.95 with standard error 1.49 in column 2, 1.07 with standard error 0.87 in column 3, and minus 6.28 with standard error 1.82 in column 5, with no entry in column 4. Individual appears in columns 4 and 5 with coefficients 8.70 with standard error 0.93 and 8.42 with standard error 1.35. Accuracy appears in columns 4 and 5 with coefficients minus 2.67 with standard error 0.76 and minus 5.11 with standard error 1.07. Actual contribution is positive in all columns, ranging from 0.08 with standard error 0.03 in column 1 to 0.15 with standard error 0.03 in column 2, and 0.12 with standard error 0.02 in columns 4 and 5. UK is minus 0.90 with standard error 1.84 in column 1, 0.24 with standard error 1.61 in column 2, 2.28 with standard error 0.87 in column 3, 1.11 with standard error 0.77 in column 4, and minus 1.13 with standard error 1.21 in column 5. Interaction terms appear only in column 5: Women times Individual is 0.78 with standard error 1.86, Women times Accuracy is 5.04 with standard error 1.52, and Women times UK is 3.73 with standard error 1.59. The constant is 55.81 with standard error 2.40 in column 1, 60.84 with standard error 2.26 in column 2, 46.75 with standard error 1.71 in column 3, 51.08 with standard error 1.24 in column 4, and 54.58 with standard error 1.61 in column 5. Wald test p values report that Individual compared with Accuracy is less than 0.01 in columns 4 and 5, and Women times Individual compared with Women times Accuracy is 0.01 in column 5. Sample labels are Split for column 1, Indi. for column 2, Accuracy for column 3, and Full for columns 4 and 5; observations are 1,684, 1,781, 1,837, 5,302, and 5,302, with R2 values 0.13, 0.10, 0.11, 0.14, and 0.14 and adjusted R2 values 0.12, 0.10, 0.10, 0.14, and 0.14.
Note: Regressions of the amount claimed on gender and treatment across all three rounds. Regressions include participant random effects, round fixed effects and clustered standard errors at the participant level. Columns 1, 2 and 3 are estimated on the samples of the Accuracy Treatment, Individual Bonus and Split Bonus Treatments separately. Columns 4 and 5 are estimated on the full sample. Standard errors in parentheses.  $^{*}$p
 $ \lt $0.1;
 $^{**}$p
 $ \lt $0.05;
 $^{***}$p
 $ \lt $0.01.
4.1. Gender differences in claiming credit
Are there gender differences in claiming credit for teamwork? Figure 3 shows the mean difference between claim and actual contribution (to which we refer to as over-claim) for men and women in each treatment across all rounds, using only the rounds in which the puzzle was solved for each participant. In the Split Bonus Treatment, men over-claim more than women (p $ \lt $0.01).Footnote 8 The gap persists in the Individual Bonus Treatment (p=0.01), but not in the Accuracy Treatment (p=0.24). Appendix B.4 shows the mean claims by treatment and gender.
Mean over-claim by gender and treatment

4.1.1. The gender claim-gap under misaligned incentives
In Table 2, we report regression estimates controlling for actual contribution. We begin with the Split Bonus Treatment, where participants have an incentive to exaggerate their contribution, but this harms the other team member. In this setting, men claim to have contributed 2.96 percentage points more than equally contributing women (p $ \lt 0.01$, see Table 2 column 1). This is in support of Hypothesis 1.
4.1.2. Altruism does not drive the gender claim-gap
A possible mechanism for the gender claim-gap could be that women care more about the other team member’s payoff than men, and are thus more reluctant to exaggerate their contribution at the expense of the other team member. In the Individual Bonus Treatment, we test this mechanism by removing the link between claims and the other team member’s payoff, while keeping the financial incentive to exaggerate. If the gender claim-gap is driven by a gender difference in altruism, we would expect the gap to disappear or at least diminish in the Individual Bonus Treatment. However, the size of the gender claim-gap remains unchanged. Men claim to have contributed 2.95 percentage points more than equally contributing women (p $ \lt 0.05$; see Table 2 column 2). This is evidence in support of Hypothesis 2a. The difference-in-difference between gender and treatment compared to the Split Bonus Treatment is close to 0 and not statistically significant: We cannot reject the null hypothesis for Hypothesis 2b. Since the gender claim-gap persists regardless of whether the claim affects the other team member or not, we conclude that gender differences in altruism are not the main driver of the gap.
4.1.3. No gender difference in overconfidence
Another possible mechanism for the gender claim-gap could be a gender difference in overconfidence. We measure overconfidence as the difference between claimed and actual contribution under incentives to be accurate (see Section 3). To test this mechanism, we give participants a financial incentive to make accurate claims in the Accuracy Treatment. On average, across all rounds, participants overestimate their contributions by 6.13 percentage points (statistically significantly different from 0 with p $ \lt 0.01$ for a one-sample t-test using participant-clustered bootstrapped standard errors). However, we observe no difference between men and women in the Accuracy Treatment. Women claim 55.47% and men claim 55.24% on average (p
 $= 0.71$). That is, we find no evidence of a gender difference in overconfidence that would explain the gender claim-gap (no support of Hypothesis 3a). The difference-in-differences between gender and treatment is statistically significant both compared to the Split Bonus Treatment (p
 $ \lt 0.01$) and compared to the Individual Bonus Treatment (p
 $=0.01$), supporting Hypotheses 3b and 3c.Footnote 9
In Appendix C we conduct a Bayesian estimation of the gender claim-gap in the Accuracy Treatment. Using the gender gap estimated by Isaksson (Reference Isaksson2018) as a conservative prior that favours the existence of a gender gap, we find strong evidence for the absence of such a gap. The Bayes factor can be interpreted as evidence in favour of the null hypothesis.
4.1.4. Direct treatment effects
We also test the direct effects of the incentive schemes on claims. Compared to the Split Bonus Treatment, both men and women increase their claims in the Individual Bonus Treatment. Claims increase by 8.70 percentage points on average (p $ \lt 0.01$; see Table 2 column 4; see also Appendix B.6 for pairwise treatment comparisons). This supports Hypothesis 4a. In the Accuracy Treatment, participants claim 11.37 percentage points less than in the Individual Bonus Treatment (p
 $ \lt 0.01$) and 2.67 percentage points less than in the Split Bonus Treatment (p
 $ \lt 0.01$), supporting Hypotheses 4b and 4c.
4.2. Other channels and heterogeneities (exploratory)
Above, we document that men claim to have contributed more to successful teamwork than women when incentives are misaligned between team members. As we find no evidence that gender differences in altruism or in overconfidence explain the gender claim-gap, the question of what drives the gap remains. In this subsection, we document exploratory analyses that suggest potential mechanisms and provide further insight into the heterogeneity of treatment effects.
4.2.1. Stated reasons for claims
There are several other mechanisms besides gender differences in altruism and in overconfidence that could explain the gender claim-gap. In the model in Section 3, a gender difference in lying aversion  $\kappa$ or in the relative importance of payoff
 $\pi$ would also lead to a claim-gap. Previous research provides evidence for gender differences in willingness to lie (Abeler et al., Reference Abeler, Nosenzo and Raymond2019; Capraro, Reference Capraro2018; Conrads et al., Reference Conrads, Irlenbusch, Rilke and Walkowitz2013; Dreber & Johannesson, Reference Dreber and Johannesson2008; Erat & Gneezy, Reference Erat and Gneezy2012; Friesen & Gangadharan, Reference Friesen and Gangadharan2012; Grosch & Rau, Reference Grosch and Rau2017). Other possible mechanisms suggested by the literature that are not included in our model are inequality aversion (Croson and Gneezy, Reference Croson and Gneezy2009), motivated reasoning (Thaler, Reference Thaler2021) or conforming to norms (Babcock et al., Reference Babcock, Laschever, Gelfand and Small2003; Coffman et al., Reference Coffman, Collis and Kulkarni2024; Haeckl et al., Reference Haeckl, Moeller and Zednik2025). Hereinafter, we explore data from our post-experiment questionnaire to gain some insights into which of these channels may be important.
After participants had made their claim in the third (and final) round, they were asked to state the reason for their claim in their own words. Two independent research assistants categorised these statements into seven categories (see Appendix D for category details). This methodology is commonly used to gain insights into behaviour within economic experiments and to generate new hypotheses (for a review see Haaland et al., Reference Haaland, Roth, Stantcheva and Wohlfart2025).
Figure 4 shows the proportion of men and women in each treatment who mention each reason. Across all treatments, the most common reason for claims is (perceived) contribution. Beyond this, several patterns emerge: Men more often than women base their claim on maximising their own payoff (p $ \lt 0.10$ in Split Bonus and p
 $ \lt 0.05$ in Individual Bonus) and blaming the other team member for a mistake (p
 $ \lt 0.05$ in Split Bonus and p
 $ \lt 0.10$ in Accuracy).Footnote 10 Women more often indicate splitting credit equally (p
 $ \lt 0.05$ in Split Bonus) and allocating credit based on perceived contributions (p
 $ \lt 0.10$ in Individual Bonus). Overall, these patterns are broadly in line with the potential mechanisms of (1) a gender difference in lying aversion (
 $\kappa_M \lt \kappa_W$), (2) a gender difference in preference weights for payoff (
 $\pi_M \gt \pi_W$), or (3) a gender difference in inequality aversion.
Stated reasons for claims

Fig. 4 Long description
The grouped bar graph has the title, Reason for claim. The vertical axis label is, Proportion left parenthesis percent right parenthesis, with tick labels 0, 20, 40, 60. The horizontal axis shows three grouped sections labeled, Split Bonus, Individual Bonus, Accuracy. Each section contains seven categories labeled, Contribution, Fairness, Equal split, Taking blame, Blaming other, Max. payoff, Random. A legend below the plot shows, Gender, with two entries, Women and Men. Split Bonus bars, approximate heights by category. Contribution, Women about 44 percent and Men about 45 percent. Fairness, Women about 14 percent and Men about 11 percent. Equal split, Women about 19 percent and Men about 13 percent. Taking blame, Women about 5 percent and Men about 7 percent. Blaming other, Women about 7 percent and Men about 11 percent. Max. payoff, Women about 4 percent and Men about 7 percent. Random, Women about 3 percent and Men about 2 percent. Individual Bonus bars, approximate heights by category. Contribution, Women about 47 percent and Men about 40 percent. Fairness, Women about 7 percent and Men about 5 percent. Equal split, Women about 13 percent and Men about 10 percent. Taking blame, Women about 6 percent and Men about 6 percent. Blaming other, Women about 7 percent and Men about 9 percent. Max. payoff, Women about 15 percent and Men about 21 percent. Random, Women about 2 percent and Men about 3 percent. Accuracy bars, approximate heights by category. Contribution, Women about 58 percent and Men about 56 percent. Fairness, Women about 4 percent and Men about 5 percent. Equal split, Women about 12 percent and Men about 11 percent. Taking blame, Women about 10 percent and Men about 11 percent. Blaming other, Women about 6 percent and Men about 10 percent. Max. payoff, Women about 1 percent and Men about 2 percent. Random, Women about 4 percent and Men about 3 percent. Asterisks appear above the plot area at several horizontal positions, including single asterisk and double asterisk marks.
This evidence suffers from several caveats: Stated reasons were not incentivised and may be subject to social desirability bias or limited introspection ability. In addition, stated reasons are endogenous to claims and patterns are thus only correlational. Nonetheless, we consider it relevant descriptive evidence to guide further research on the channels behind the gender claim-gap.
4.2.2. The gender gap is more pronounced for large claims
In the following paragraphs, we provide evidence that the gender claim-gap is particularly pronounced at the upper tails of the claim distributions (that is, for large claims), and among high contributors. Figure 5 shows the cumulative density functions (CDFs) of the average claim per individual across the three rounds for each treatment. The gender gap is of moderate size at the means (Cohen’s  $d = 0.14$ in the Individual Bonus and
 $d = 0.17$ in the Split Bonus Treatment Cohen (Reference Cohen1988)), but becomes larger at the upper tails of the claim distribution.
CDFs of actual contributions and claims

Fig. 5 Long description
Line graphs labeled, Split Bonus, Individual Bonus and Accuracy. The image A shows a line graph labeled, Split Bonus. Horizontal axis label, Average claim, with tick labels 0, 25, 50, 75, 100. Vertical axis label, CDF, with tick labels 0.00, 0.25, 0.50, 0.75, 1.00. Legend text: Actual contribution (Men plus Women) shown as a solid line, Women's claims shown as a dashed line, Men's claims shown as a dashed line with longer dash segments. The solid line rises earlier than the two dashed lines. The two dashed lines stay near 0.00 until around the 50 mark on the horizontal axis, then rise sharply. The dashed line for Women's claims is above the dashed line for Men's claims through much of the rise. The image B shows a line graph labeled, Individual Bonus. Horizontal axis label, Average claim, with tick labels 0, 25, 50, 75, 100. Vertical axis label, CDF, with tick labels 0.00, 0.25, 0.50, 0.75, 1.00. The same legend applies: Actual contribution (Men plus Women) solid line, Women's claims dashed line, Men's claims dashed line with longer dash segments. The solid line rises earlier than the two dashed lines. The two dashed lines stay near 0.00 until around the 50 mark on the horizontal axis, then rise sharply. The dashed line for Women's claims is above the dashed line for Men's claims through much of the rise. The image C shows a line graph labeled, Accuracy. Horizontal axis label, Average claim, with tick labels 0, 25, 50, 75, 100. Vertical axis label, CDF, with tick labels 0.00, 0.25, 0.50, 0.75, 1.00. The same legend applies: Actual contribution (Men plus Women) solid line, Women's claims dashed line, Men's claims dashed line with longer dash segments. The three lines rise in a similar horizontal range, with the steepest rise occurring around the 50 mark on the horizontal axis. The dashed line for Women's claims and the dashed line for Men's claims are close together through most of the rise.
In the upper panel of Table 3 we estimate the gender gap in each treatment separately for the top quartile and the bottom three quartiles of the claim distribution. In the Split Bonus Treatment, the gender claim-gap is about eight times larger in the top claim-quartile than in the bottom three quartiles (p $ \lt $0.01). In the Individual Bonus Treatment, the point estimate of the gender gap is also larger in the top quartile, but the difference is not statistically significant. We also test for general differences in the shapes of the claim distributions between men and women using Dowd Test Statistics (DTS) (Dowd, Reference Dowd2020). This nonparametric test is sensitive to differences in the tails of distributions and has improved power compared to the Kolmogorov-Smirnov (KS) test or Anderson-Darling (AD) test. The DTS test detects a difference in claim distributions between men and women in the Split Bonus Treatment (p
 $=0.01$), but not in the Individual Bonus (p
 $=0.08$) or Accuracy treatment (p
 $=0.62$). The difference in statistical significance between the Split Bonus and Individual Bonus Treatments may be explained by the much larger overall share of 100%-claims in the Individual Bonus Treatment (24.37% in the Individual Bonus Treatment vs. 10.69% in the Split Bonus Treatment), making it more difficult to detect distributional differences in the Individual Bonus Treatment.
The gender gap at the upper tails of the distributions

Table 3 Long description
Dependent variable is claim, with coefficient estimates for women reported for three treatments: Split Bonus, Individual Bonus, and Accuracy, with standard errors in parentheses and significance marked by stars. In the top quartile, women coefficients are minus 8.55 with standard error 1.65 for Split Bonus, minus 4.79 with standard error 0.64 for Individual Bonus, and minus 0.07 with standard error 1.38 for Accuracy. In the bottom three quartiles, women coefficients are minus 1.06 with standard error 0.33 for Split Bonus, minus 2.87 with standard error 0.82 for Individual Bonus, and 0.51 with standard error 0.37 for Accuracy. Z tests for equality of coefficients across the top quartile versus bottom three quartiles report p less than 0.01 for Split Bonus, p 0.06 for Individual Bonus, and p 0.68 for Accuracy. For high contributors, women coefficients are minus 3.29 with standard error 1.66 for Split Bonus, minus 4.53 with standard error 1.96 for Individual Bonus, and minus 0.23 with standard error 1.31 for Accuracy. For low contributors, women coefficients are minus 1.79 with standard error 1.23 for Split Bonus, minus 1.74 with standard error 1.65 for Individual Bonus, and 1.62 with standard error 0.96 for Accuracy. Z tests for equality of coefficients across high versus low contributors report p 0.47 for Split Bonus, p 0.28 for Individual Bonus, and p 0.26 for Accuracy.
Note: Coefficient estimates for women (i.e, estimates of the gender gap in claims) from regressions of claim on gender, actual contribution and country of residence. Regressions include participant random effects, round fixed effects and clustered standard errors at the participant level. Coefficients in the top and bottom panel are from separate regressions. The top panel shows coefficient estimates from the top and bottom three quartile of claims respectively. The quartiles are constructed separately for each treatment and for men and women. The bottom panel shows coefficient estimates for high contributors ( $ \gt $50%) and low contributors (
 $\leq50\%$) respectively. The number of observations in the top quartile are 531 in the Accuracy, 496 in the Individual Bonus, and 447 in the Split Bonus Treatment. The number of observations in the bottom three quartiles are 1306 in the Accuracy, 1285 in the Individual Bonus and 1237 in the Split Bonus Treatment. The number of observations of high contributors are 584 in the Accuracy, 583 in the Individual Bonus, and 534 in the Split Bonus Treatment. The number of observations of low contributors are 1253 in the Accuracy, 1198 in the Individual Bonus, and 1150 in the Split Bonus Treatment. Standard errors in parentheses.
 $^{*}$p
 $ \lt $0.1;
 $^{**}$p
 $ \lt $0.05;
 $^{***}$p
 $ \lt $0.01.
Further, we test for gender differences in the propensity to claim 100%. In round 1, 26.84% of men and 20.23% of women claim 100% in the Individual Bonus Treatment, and 11.28% of men and 8.33% of women in the Split Bonus Treatment. Only three percent of both men and women claim 100% in the Accuracy Treatment. We estimate logit regressions on the propensity to claim 100%, controlling for actual contribution and country of residence. Men are statistically significantly more likely to claim 100% in the Individual Bonus Treatment, but not in the Split Bonus or the Accuracy Treatment (see Appendix B.9).
4.2.3. The gender gap among high contributors
In Table 3 we additionally estimate the gender gap in claims within each treatment for high contributors (contribution  $ \gt 50\%$) and low contributors (contribution
 $\leq 50\%$), using the definition of Isaksson (Reference Isaksson2018). In the Split Bonus as well as the Individual Bonus Treatment, we find a statistically significant gender claim-cap among high contributors, but not among low contributors. When it pays to exaggerate, high-contributing men submit larger claims than high-contributing women (controlling for actual contribution). We cannot reject the null hypothesis of equality of coefficients between high- and low-contributors. In Appendix B.10, we also estimate regressions with an interaction between gender and high contributor as well as top claim-quartile.
4.2.4. The 50–50 norm
Previous research documents a strong norm to share payoffs along a 50-50 split, motivated by the intention to appear fair (Andreoni & Bernheim, Reference Andreoni and Bernheim2009). In an identity-based utility framework (Akerlof & Kranton, Reference Akerlof and Kranton2000), individuals who identify as fair derive direct utility from choosing the equal split, making 50–50 a natural focal point. In line with this, Figure 5 reveals that a large share of participants chooses to share credit evenly (i.e., claim to have contributed 50%): The percentage of participants who, on average across all three rounds, claim to have contributed 50% is 39.55% in the Accuracy Treatment, 32.99% in the Individual Bonus Treatment and 48.06% in the Split Bonus Treatment. The proportion of participants claiming half is significantly larger in the Split Bonus Treatment than in the other two treatments (see Appendix B.8). When the claim directly affects the team member’s payoff, the 50–50 Norm seems to grow in importance. A possible explanation is conditional reciprocity (e.g., Balafoutas et al., Reference Balafoutas, Czermak, Eulerich and Fornwagner2020): Participants who expect their team member to share credit evenly reciprocate by doing the same. Consistent with this, in the Split Bonus Treatment, 75.00% of participants who claim 50% in round 3, but only 31.74% of participants who do not claim 50%, believe the other team member claimed 50%. In subsection 4.2.1, we document that in the Split Bonus Treatment, women state wanting to split credit equally as the reason for their claim more often than men. In line with this, the proportion of participants who claim 50% is slightly larger among women than among men in the Split Bonus and Individual Bonus Treatments; yet the difference is not statistically significant (see Appendix B.8). We thus do not find evidence that the 50–50 norm contributes to the gender claim-gap. While women more frequently cite equal splitting as a reason for their claims, we do not observe a corresponding gender difference in the propensity to claim 50%. The gender gap is concentrated among participants who deviate from the 50% focal point, especially among those making large claims and among high contributors (see the previous two subsections).
4.3. Claiming credit after unsuccessful teamwork (exploratory)
So far, the analysis has focused on the sample of successfully solved puzzles. Here, we report exploratory analyses of claims for unsolved puzzles. Credit claiming for failed teamwork may differ from that for successful teamwork (Haynes & Heilman, Reference Haynes and Heilman2013), and, in particular, men and women may respond to team failure differently. Note the following caveat: The contribution formula is not defined for certain special cases of unsolved puzzles, such as when the team’s sum of good and bad moves equals 0 (see Section 2). Here, we exclude observations where the actual contribution is not defined.
In Table 4 columns 1, 2, and 3 show regression estimates of the claim on not solving the puzzle (unsolved) using the full sample of solved and unsolved puzzles. We find that in the Individual Bonus ( $p \lt 0.05$) and Accuracy Treatments (
 $p \lt 0.01$), unsuccessful participants claim less than successful participants. This is in line with earlier research findings that people claim smaller contributions for unsuccessful compared to successful teamwork (Ross and Sicoly, Reference Ross and Sicoly1979). We find no difference in the Split Bonus Treatment.
Unsolved puzzles

Table 4 Long description
Dependent variable is Claim, reported as regression coefficients with standard errors in parentheses for six models labeled columns 1 through 6. Columns 1 to 3 use samples labeled Split all, Indi. all, and Accuracy all, with observations 2,351, 2,394, and 2,537; columns 4 to 6 use Split unsolved, Indi. unsolved, and Accuracy unsolved, with observations 667, 613, and 700. In columns 1 to 3, Unsolved is 2.59 with standard error 1.61 in column 1, minus 3.78 with two stars and standard error 1.63 in column 2, and minus 11.49 with three stars and standard error 1.50 in column 3. In columns 1 to 3, Women is minus 2.98 with three stars and standard error 1.11, minus 3.12 with two stars and standard error 1.49, and 1.21 with standard error 0.86. In columns 4 to 6, Women is minus 8.79 with three stars and standard error 2.22, minus 9.85 with three stars and standard error 2.64, and 2.98 with standard error 2.06. UK is minus 0.98 with standard error 1.93, minus 0.19 with standard error 1.64, and 3.16 with three stars and standard error 0.91 in columns 1 to 3; and minus 0.94 with standard error 4.38, minus 4.77 with one star and standard error 2.76, and 5.66 with three stars and standard error 2.06 in columns 4 to 6. Unsolved x Women appears only in columns 1 to 3, with minus 4.92 with two stars and standard error 2.08, minus 6.17 with three stars and standard error 2.20, and 1.00 with standard error 1.97. Constants are 59.41 with three stars in column 1, 65.48 with three stars in column 2, 50.63 with three stars in column 3, 68.81 with three stars in column 4, 66.98 with three stars in column 5, and 41.04 with three stars in column 6.
Note: Regressions of the amount claimed on whether the puzzle was solved and gender across all three rounds. For unsolved puzzles the sample is restricted to where the team contribution equals 100. Regressions include participant random effects, round fixed effects and clustered standard errors at the participant level. We control for actual contribution. Columns 1, 2, and 3 are estimated on the samples of the Split, Individual and Accuracy Treatments separately, including both solved and unsolved puzzles. Columns 4, 5, and 6 are estimated on the sample of only unsolved puzzles for each treatment respectively. Standard errors in parentheses.  $^{*}$p
 $ \lt $0.1;
 $^{**}$p
 $ \lt $0.05;
 $^{***}$p
 $ \lt $0.01.
Do men and women react differently to team failure? We find that unsuccessful women reduce their claims more than unsuccessful men in both the Split Bonus ( $p \lt 0.05$) and the Individual Bonus Treatment (
 $p \lt 0.01$), further widening the gender claim-gap. In the Accuracy Treatment, we find no gender gap and no gender difference in the reaction to team failure.
In columns 4, 5, and 6 in Table 4 we estimate gender differences among unsuccessful teams directly. We observe similar patterns as for solved puzzles (Table 2), but the magnitude of the differences is larger. Women claim less than men in the Split Bonus ( $p \lt 0.01$) and Individual Bonus Treatments (
 $p \lt 0.01$), but not in the Accuracy Treatment.
In sum, we find that women react to team failure more strongly than men, further exacerbating the gender claim-gap. Patterns among unsuccessful teams are consistent with our previous findings: The gender gap remains even when claims do not affect the other team member, but is closed when participants are incentivised to claim accurately.
5. Discussion
In this experiment, we find that under misaligned incentives, men claim more credit for their contribution to teamwork than equally contributing women. This result aligns with previous research that finds women evaluate their own performance worse than men (Exley & Kessler, Reference Exley and Kessler2022; Haynes & Heilman, Reference Haynes and Heilman2013). Our experiment complements this research by investigating a teamwork setting with misaligned incentives and imperfectly observable, ambiguous individual contributions.
We test if the gender claim-gap is driven by gender differences in altruism by eliminating concerns towards the other team member by design. The gender gap remains, suggesting that it is not a difference in altruism that drives the gender gap. This is in line with recent results suggesting that, contrary to common beliefs held by both genders, women do not generally show more socially-oriented behaviour than men (Exley et al., Reference Exley, Hauser, Moore and Pezzuto2025).
We further test gender differences in overconfidence as a mechanism for the claim-gap. We find that, on average, both men and women equally overestimate their contribution, providing no support for differences in overconfidence as a main driver of the gap. Thus, using an experiment with high statistical power, we do not find evidence that gender differences in altruism or in overconfidence explain the observed gender claim-gap. There are several other plausible explanations. Exploratory evidence from our post-experiment questionnaire suggests gender differences in stated considerations related to lying aversion, payoff weights and inequality aversion, providing a basis for developing testable hypotheses for future work.
5.1. Why do we not find a gender gap in overconfidence?
Previous research finds that men and women self-evaluate their performance differently (Exley & Kessler, Reference Exley and Kessler2022) and hold different beliefs about their contributions to teamwork (Isaksson, Reference Isaksson2018). However, in this experiment, we find no evidence for a gender gap in incentivised beliefs.
What explains the contrasting findings? We leverage the fact that the Accuracy Treatment is similar in design to Isaksson (Reference Isaksson2018) to identify possible reasons for the discrepancy. There are several differences between the experiments that could explain why we do not find a gender gap in overconfidence. For instance, we use a large online sample ( $n$ = 845 for the Accuracy Treatment) which consists of US and UK residents, while the experiment in Isaksson (Reference Isaksson2018) was conducted in the laboratory with an all-US-American sample (
 $n$ = 197) and several years earlier. The inclusion of UK participants in our sample does not seem to account for the difference in results, because when we restrict our sample to US participants only, we also find no evidence of a gender claim-gap in the Accuracy Treatment.Footnote 11 We are also not aware of any research documenting a decline in gender differences over the past few years.
A more plausible explanation lies in a key difference in the experimental setting: in Isaksson (Reference Isaksson2018) participants are not anonymous – first names and photos reveal gender – while in our study, they are. Under accuracy incentives, Isaksson (Reference Isaksson2018) finds gender differences in credit claiming when the other team member’s gender is known; we observe no such differences when gender is concealed. This suggests that stereotype activation or social image concerns may play a key role in driving gender disparities, prompting people to project stereotypical beliefs about skills and contributions both onto their team member and onto themselves (Bordalo et al., Reference Bordalo, Coffman, Gennaioli and Shleifer2016; Bordalo et al., Reference Bordalo, Coffman, Gennaioli and Shleifer2019; Haynes & Heilman, Reference Haynes and Heilman2013). Our anonymous experiment removes this channel, suggesting that gender gaps in credit claiming may be contingent on social context rather than inherent differences.
Context may also play a role in shaping gender differences in claiming behaviour. Investigating bargaining over a jointly produced outcome under uncertain individual contributions, Cavalan et al. (Reference Cavalan, de Gardelle and Vergnaud2022) find that women, but not men, react to differential framing of the instructions asking for their contribution. Similarly, Small et al. (Reference Small, Gelfand, Babcock and Gettman2007) shows that gender differences in self-advocacy depend on whether a situation is framed as negotiation or as “asking”, with women more willing to engage in the latter. While our setting does not involve negotiation – claims are unilateral, require no approval, and communication is prohibited – these findings underscore the importance of context when interpreting gender effects.
Beyond framing, several studies emphasise how social context shapes self-assessments: whether individuals are being watched, judged, or held accountable. Haeckl (Reference Haeckl2022) and Ludwig et al. (Reference Ludwig, Fellner-Röhling and Thoma2017) show that women react differently to the observability of their self-assessment’s accuracy. Several experiments in the realm of self-evaluations feature a strategic component. These often involve a supervisor (see e.g., Brilon et al., Reference Brilon, Grassi, Grieder and Schulz2024; Exley & Kessler, Reference Exley and Kessler2022; Schwardmann & Van der Weele, Reference Schwardmann and Van der Weele2019; Solda et al., Reference Solda, Ke, Page and Von Hippel2020) or a peer (Brilon et al., Reference Brilon, Grassi, Grieder and Schulz2024; Charness et al., Reference Charness, Rustichini and Van de Ven2018), who must be convinced of one’s claim. In many real-life situations, individuals may “get away” with exaggeration due to limited information or leniency, as is structurally the case in our experiment. We deliberately excluded a third party to isolate altruism towards the other team member. While Exley & Kessler (Reference Exley and Kessler2022) find that the gender gap in self-promotion persists when there is a chance of “getting caught”, an interesting avenue for future research could be to investigate who is believed when (over-)claiming contributions for teamwork. Our finding that men do not report having contributed more than women under accuracy incentives adds to a growing understanding of the contextual effects on gender differences in overconfidence.
A further potential source of overconfidence is motivated reasoning: individuals may derive utility from believing they contributed more, leading to distorted information processing and belief updating (Köszegi, Reference Köszegi2006). This mechanism aligns with broader findings on belief distortion for identity maintenance and norm conformity (Akerlof & Kranton, Reference Akerlof and Kranton2000; Babcock et al., Reference Babcock, Laschever, Gelfand and Small2003). Recent work suggests that motivated reasoning may differ by gender and thereby contribute to gender gaps in overconfidence (Thaler, Reference Thaler2021). In our experiment, however, we find no gender difference in incentivised beliefs in the Accuracy Treatment. Accordingly, we also do not find evidence suggesting a gender difference in motivated reasoning under accuracy incentives. To identify gender differences in overconfidence as a mechanism of the gender claim-gap under misaligned incentives, the model in Section 3 assumes that beliefs are independent of the treatment condition. In fact, identification only requires the weaker assumption that beliefs respond to the treatment in the same way for men and women. However, if motivated reasoning interacts with treatment incentives conditional on gender, our experimental design cannot detect this, which could confound our interpretation of overconfidence in claims. More research is needed on how motivated reasoning responds to different incentives, and whether this interacts with gender.
5.2. Adherence to social norms
We have already discussed gender differences in lying aversion, relative payoff weights and inequality aversion as possible channels for the claim-gap and provided some exploratory evidence in Section 4.2.1. Another possible moderator of claims is adherence to social norms and gender stereotypes. This behaviour is widely documented in the literature. For example, stereotype-based performance expectations have been shown to shape credit attribution, with women engaging in attributional rationalisation and allocating success to others under ambiguity (Haynes & Heilman, Reference Haynes and Heilman2013). Social identity theory suggests that people derive intrinsic utility from conforming to identity-relevant social norms (Akerlof & Kranton, Reference Akerlof and Kranton2000). Under this framework, adherence to identity norms yields direct utility, while deviations impose negative utility. Women might derive negative utility from claims that violate gender norms around modesty and cooperation, whereas such behaviour is consistent with assertiveness and competition norms for men and may lead them to pursue higher claims. These predictions are consistent with our observation of women more frequently mentioning equality or their contribution, and men emphasising their own payoff as the reason for their claim. Another possibility is that women anticipate extrinsic social penalties – “backlash” – for appearing overly assertive (Babcock et al., Reference Babcock, Laschever, Gelfand and Small2003). However, in a recent study Haeckl et al. (Reference Haeckl, Moeller and Zednik2025) find no evidence that women are punished more strongly for assertive behaviour than men. While we cannot rule out potential effects of intrinsic direct utility from adherence to social norms, we deliberately minimise the impact of extrinsic social expectations in our study by keeping participants anonymous and their claims private.
5.3. Gender differences at the upper tail of the distribution
The gender gap in credit claiming is particularly pronounced at the upper tails of the claim distribution. A substantial body of experimental literature documents gender differences at the extremes of distributions (see e.g., Andreoni and Vesterlund, Reference Andreoni and Vesterlund2001; Baye & Monseur, Reference Baye and Monseur2016; Liu et al., Reference Liu, Alvarado-Urbina and Hannum2020; Penner, Reference Penner2008; Penner & Paret, Reference Penner and Paret2008; Thöni & Volk, Reference Thöni and Volk2021), emphasising a phenomenon that is also observed empirically (Blau & Kahn, Reference Blau and Kahn2017). While much of the gender literature focuses on differences in the means, differences at the extremes of distributions could have important implications for career advancements in highly competitive domains. In addition, we only find a gender claim-gap among high contributors, that is, individuals who are pivotal to team success. That high-contributing women claim less credit for their contributions than high-contributing men may also exacerbate differences in labour market outcomes at the upper tail of the distribution. Evaluation schemes should thus account for potential exaggeration in self-reports and incentivise accuracy, for example, through the use of objective and transparent performance measures such as task-based metrics. Our study suggests self-evaluations should be separated from bonus payments, promotions, and hiring decisions.
6. Conclusion
In this study, we investigate the drivers of the gender gap in claiming credit for contributions to teamwork, testing both altruism towards the other team member and overconfidence in self-assessments as potential mechanisms. To this end, we conduct a large-scale online experiment with a final sample of 2456 participants. In the experiment, participants solve an interactive task in teams of two and subsequently claim how much they have contributed. We use a between-subject design where we vary the incentives that individuals have for claiming credit for their contribution.
Our experiment shows that when incentives between team members are misaligned, there is a gender gap in claiming contributions to teamwork. The gap persists irrespective of whether exaggeration harms the team member or not, suggesting that altruistic preferences regarding the other team member’s payoff are not a driver for the gender claim-gap in this setting. Under accuracy incentives, men and women overestimate their contribution to a similar extent, suggesting that gender differences in overconfidence do not explain the observed gender claim-gap either. Exploratory evidence from our post-experiment questionnaire suggests gender differences in stated considerations related to lying aversion, the relative weight given to payoffs and inequality aversion, which may be important to examine in future work. The gender claim-gap is even more pronounced at the upper tails of the distribution than at the means. Most previous research on behavioural gender differences has focused on differences at the means, possibly overlooking large differences at the extremes. Taken together, our findings suggest that men are more inclined than women to borrow plumes in teamwork settings with misaligned incentives, claiming more credit for their contributions.
Our paper opens avenues for future research, with possible extensions including repeated interaction of team members, varying the degree of anonymity, increasing stake size, or manipulating the salience of social norms, as well as more direct tests of the factors reflected in the stated reasons. As discussed in Section 2.3.5, our design deliberately abstracts from certain contextual factors and thus serves as a mechanism-isolating benchmark for credit claiming when audience and reputational channels are muted, rather than as a universal lower bound for workplace gender gaps. Factors like age, race, ongoing relationships, reputational concerns, social visibility and hierarchies are beyond the scope of this paper. Future research can explore how these complex social interdependencies shape credit claiming, building on our exploratory analyses of stated reasons to develop testable hypotheses.
Supplementary material
The supplementary material for this article can be found at https://doi.org/10.1017/eec.2026.10063.
Acknowledgement
We thank Mackenzie Alston, Loukas Balafoutas, Roberto Asmat Belleza, Peter Brummund, Nadine Chlaß, Lawrence Choo, Florian Englmaier, Christine Exley, Susann Fiedler, Milos Fisar, Ben Greiner, Simone Haeckl-Schermer, Gergely Hajdu, Lisa Hanzl, Pia Heckl, Stephanie Heger, Alejandro Hirmas, Johannes Hoelzemann, Siri Isaksson, Melanie Koch, Martin G. Kocher, Boon Han Koh, Ada Kovaliukaite, Marco Lambrecht, Olivia Masi, Eva Ranehill, Anna Sandberg, Rupert Sausgruber, Arthur Schram, Anna Schwarz, James Tremewan, Lise Vesterlund, Elisabeth Wurm and the participants at workshops and conferences – ESA European Meeting 2025, EEA Congress 2025, ESA Asia Pacific Meeting 2025, Berlin Workshop on Empirical Public Economics 2024, EALE 2024, SOLE 2024, RES 2024, Essex PhD Workshop 2024, NSE PhD and Post Doc Workshop 2023, Gender Gaps Conference 2023, ESA World Meeting 2023, IAREP-SABE 2023, SPUDM 2023, ASFEE 2023, YEM 2023, WU Gender and Diversity Conference 2023, NOEG Winter Workshop 2022, seminars at Vienna University of Economics and Business and Institute for Advanced Studies Vienna – for helpful comments and suggestions. We are particularly grateful to the anonymous referees and the editor for their constructive feedback, which helped improve the paper substantially. Any errors are our own.
Author contributions
All authors contributed to the study conception and design. Material preparation, data collection and analysis were performed by Klara Kinnl, Jakob Moeller and Anna Walter-Dockx. The first draft of the manuscript was written by all authors, and all of them commented on previous versions of the manuscript. All authors read and approved the final manuscript.
Funding statement
The project was funded within the Post-DocTrack Programme of the Austrian Academy of Sciences (OeAW).
Competing interest
The authors have no relevant financial or non-financial interests to disclose.
Ethical standards
The experiment reported in this paper has received ethics approval at Vienna University of Economics and Business, approval number WU-HSRP-2021-021.
Replication package
The replication materials for this study are available at https://doi.org/10.17605/OSF.IO/ncq36


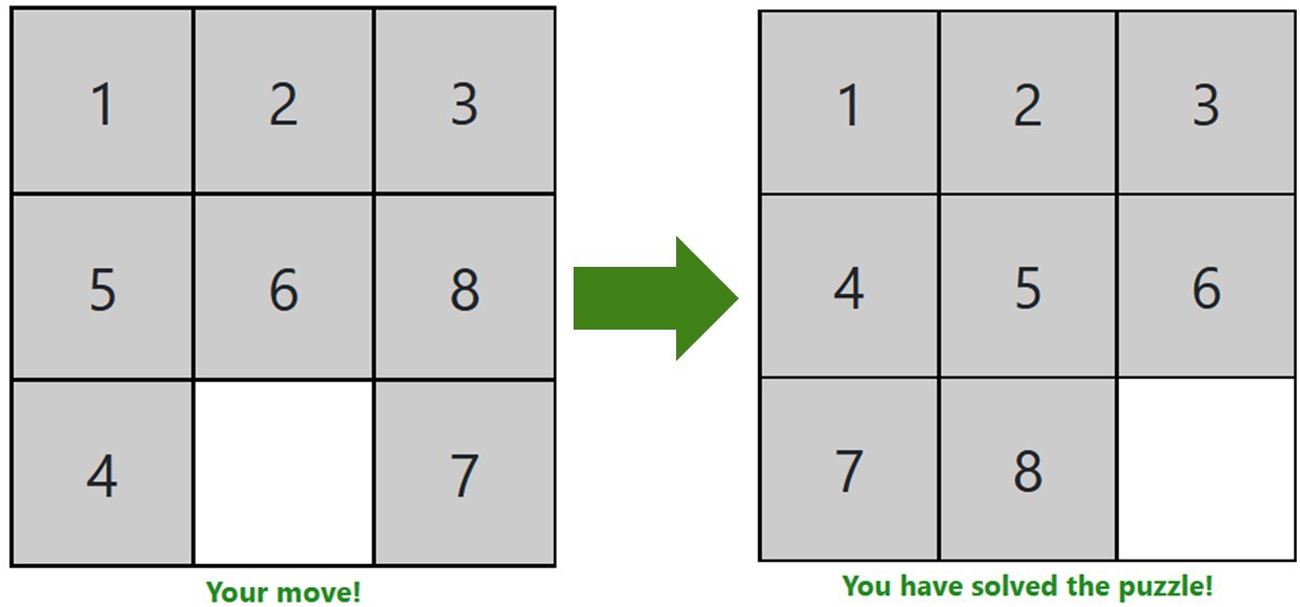

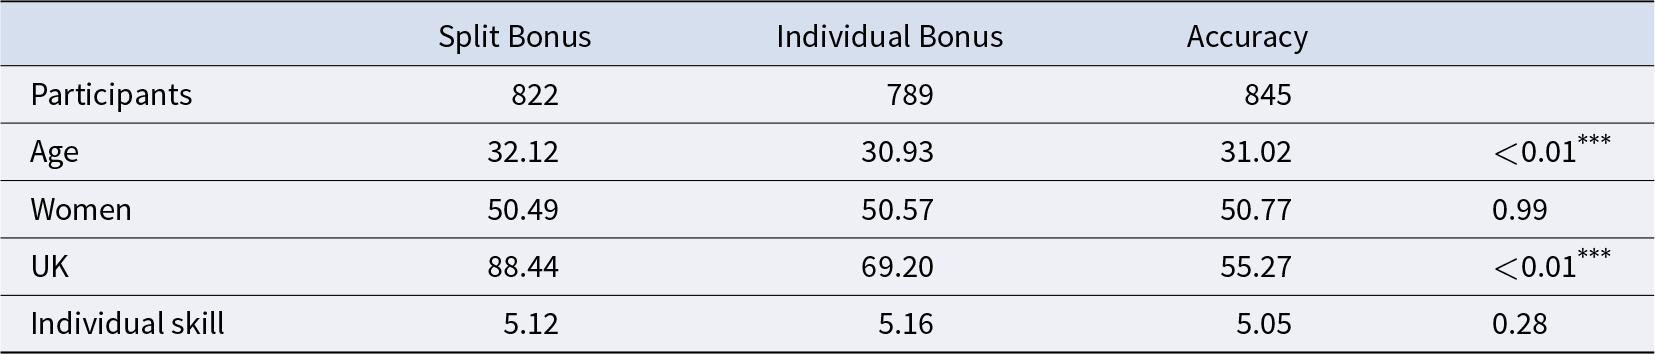
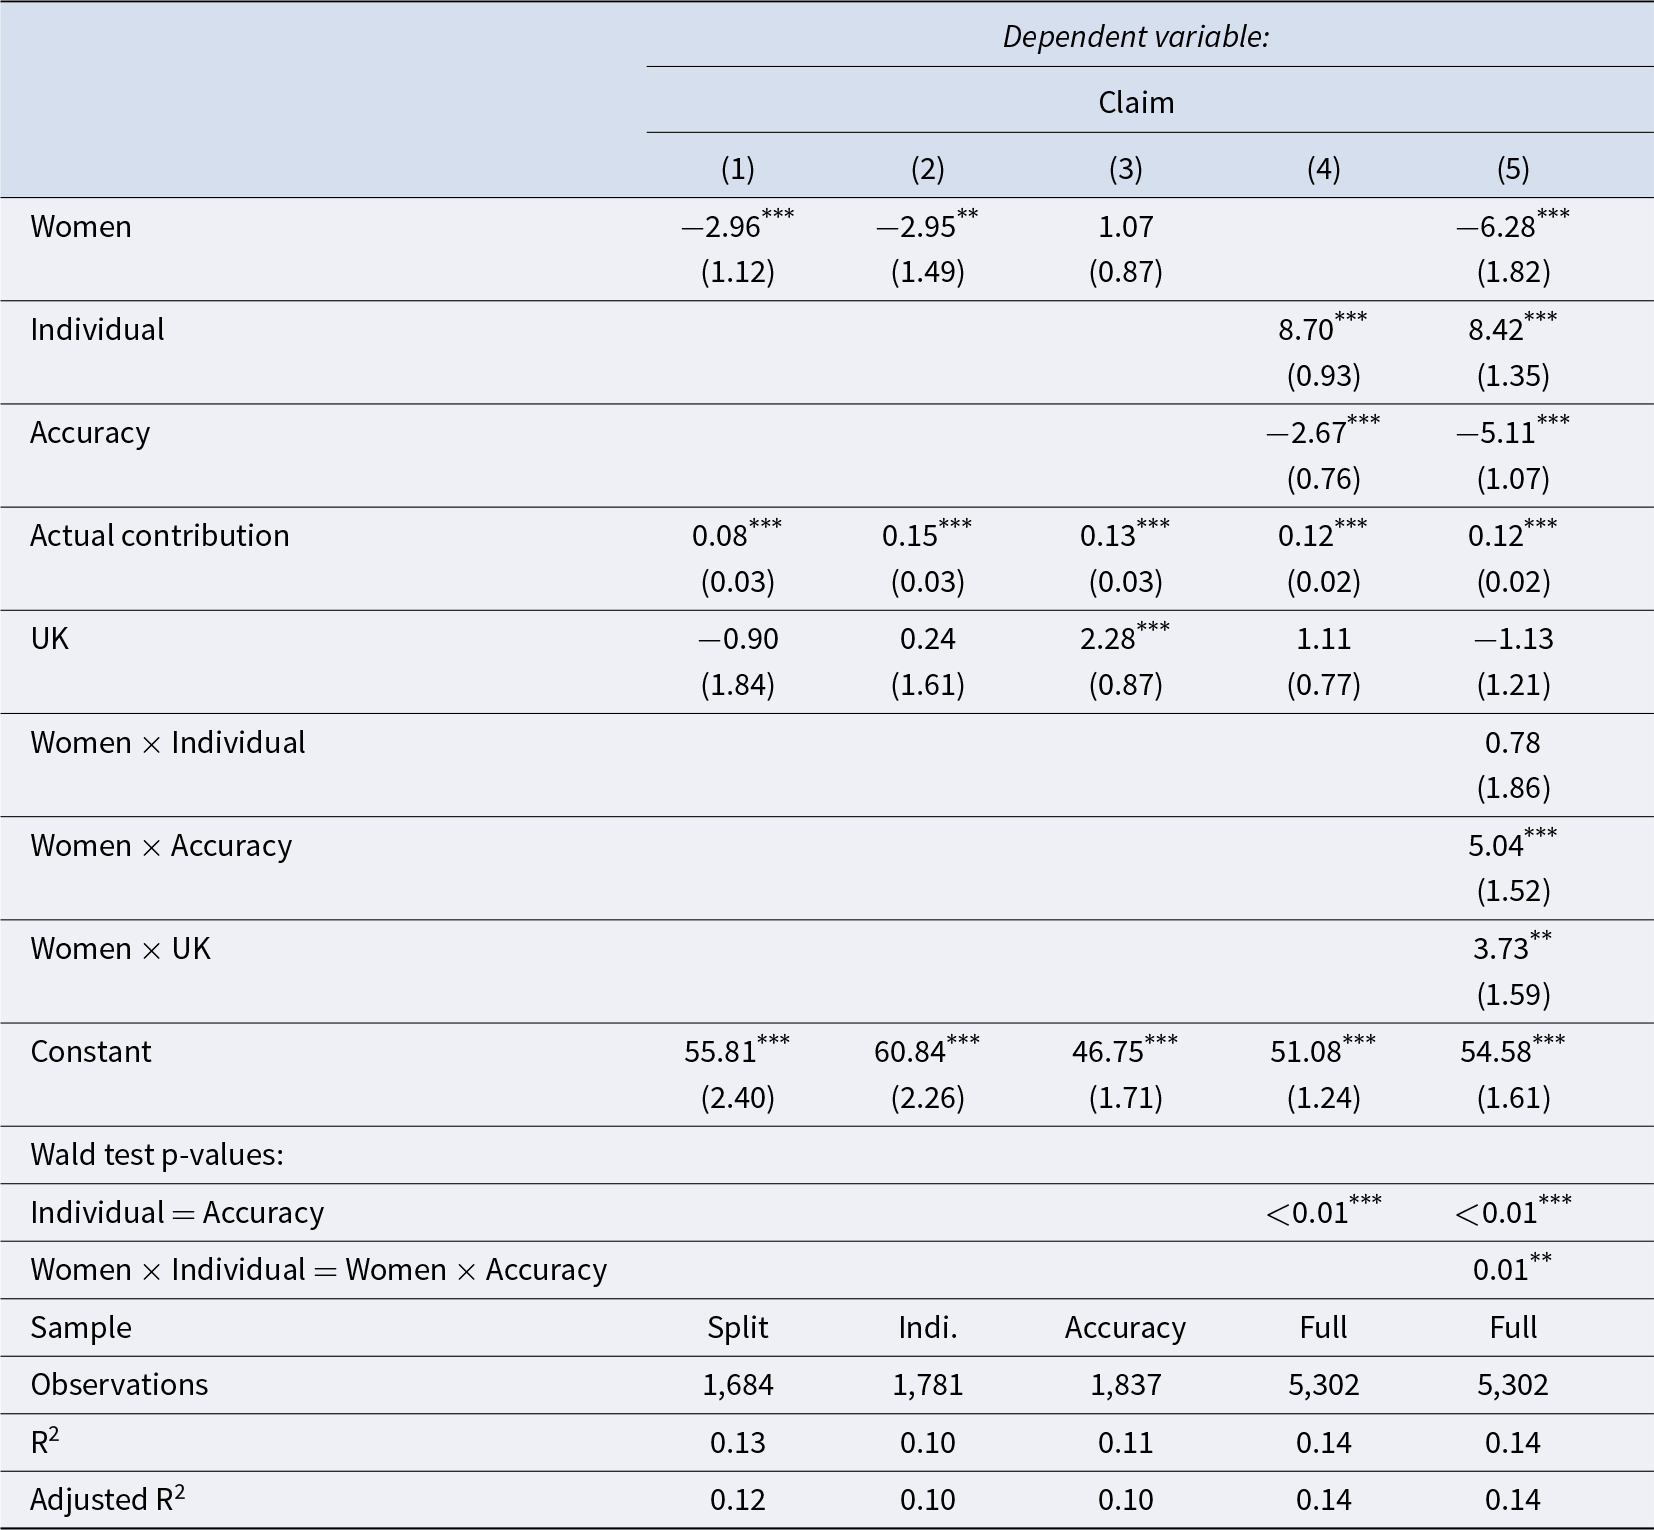
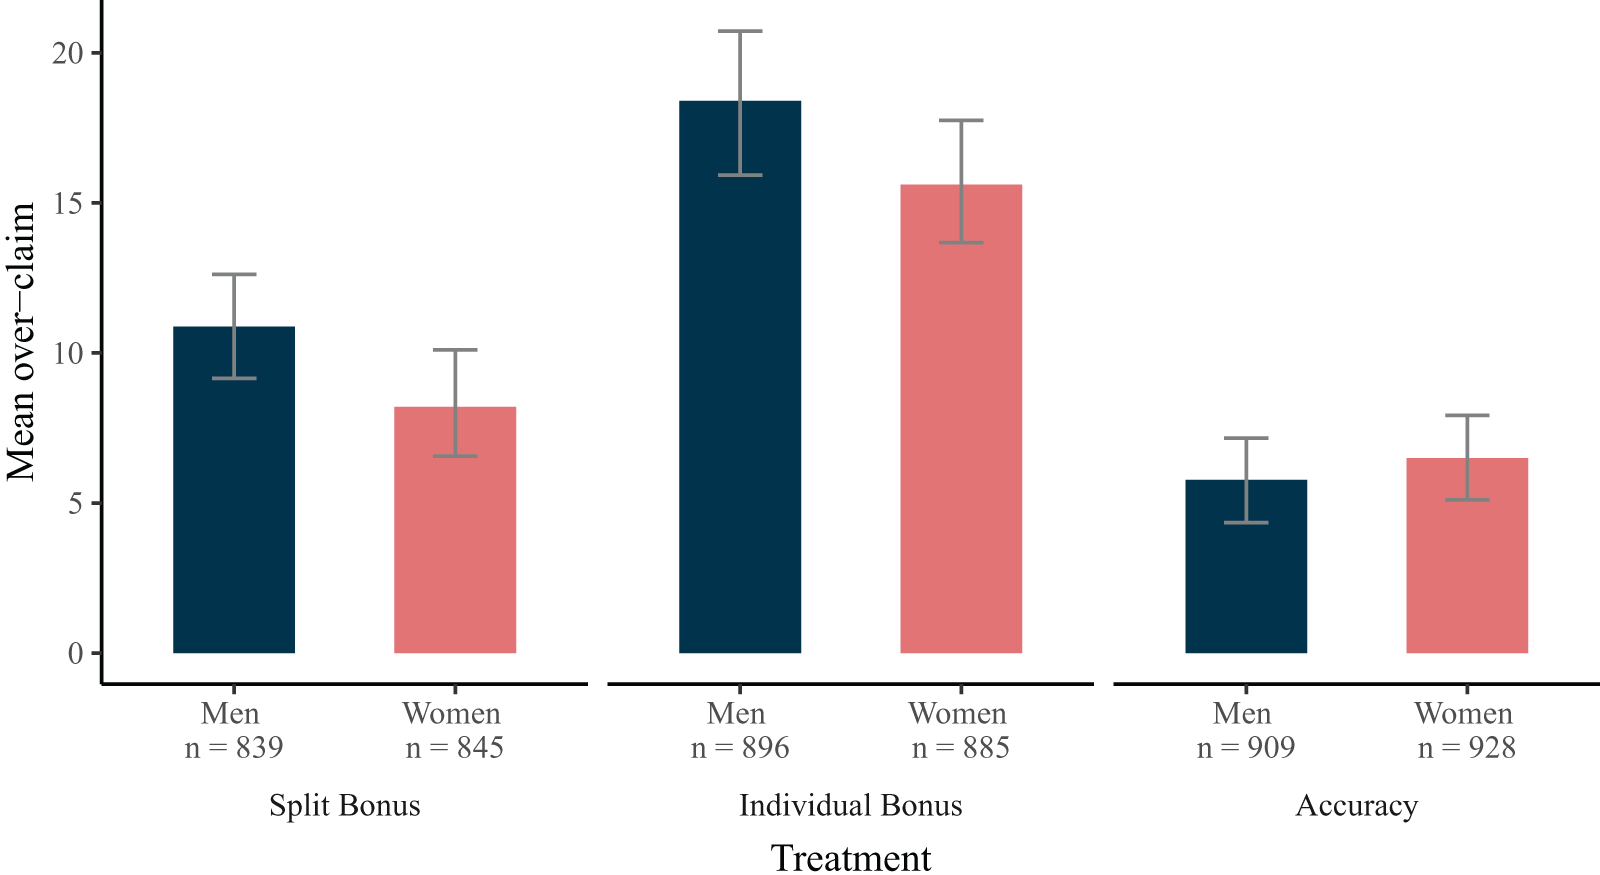
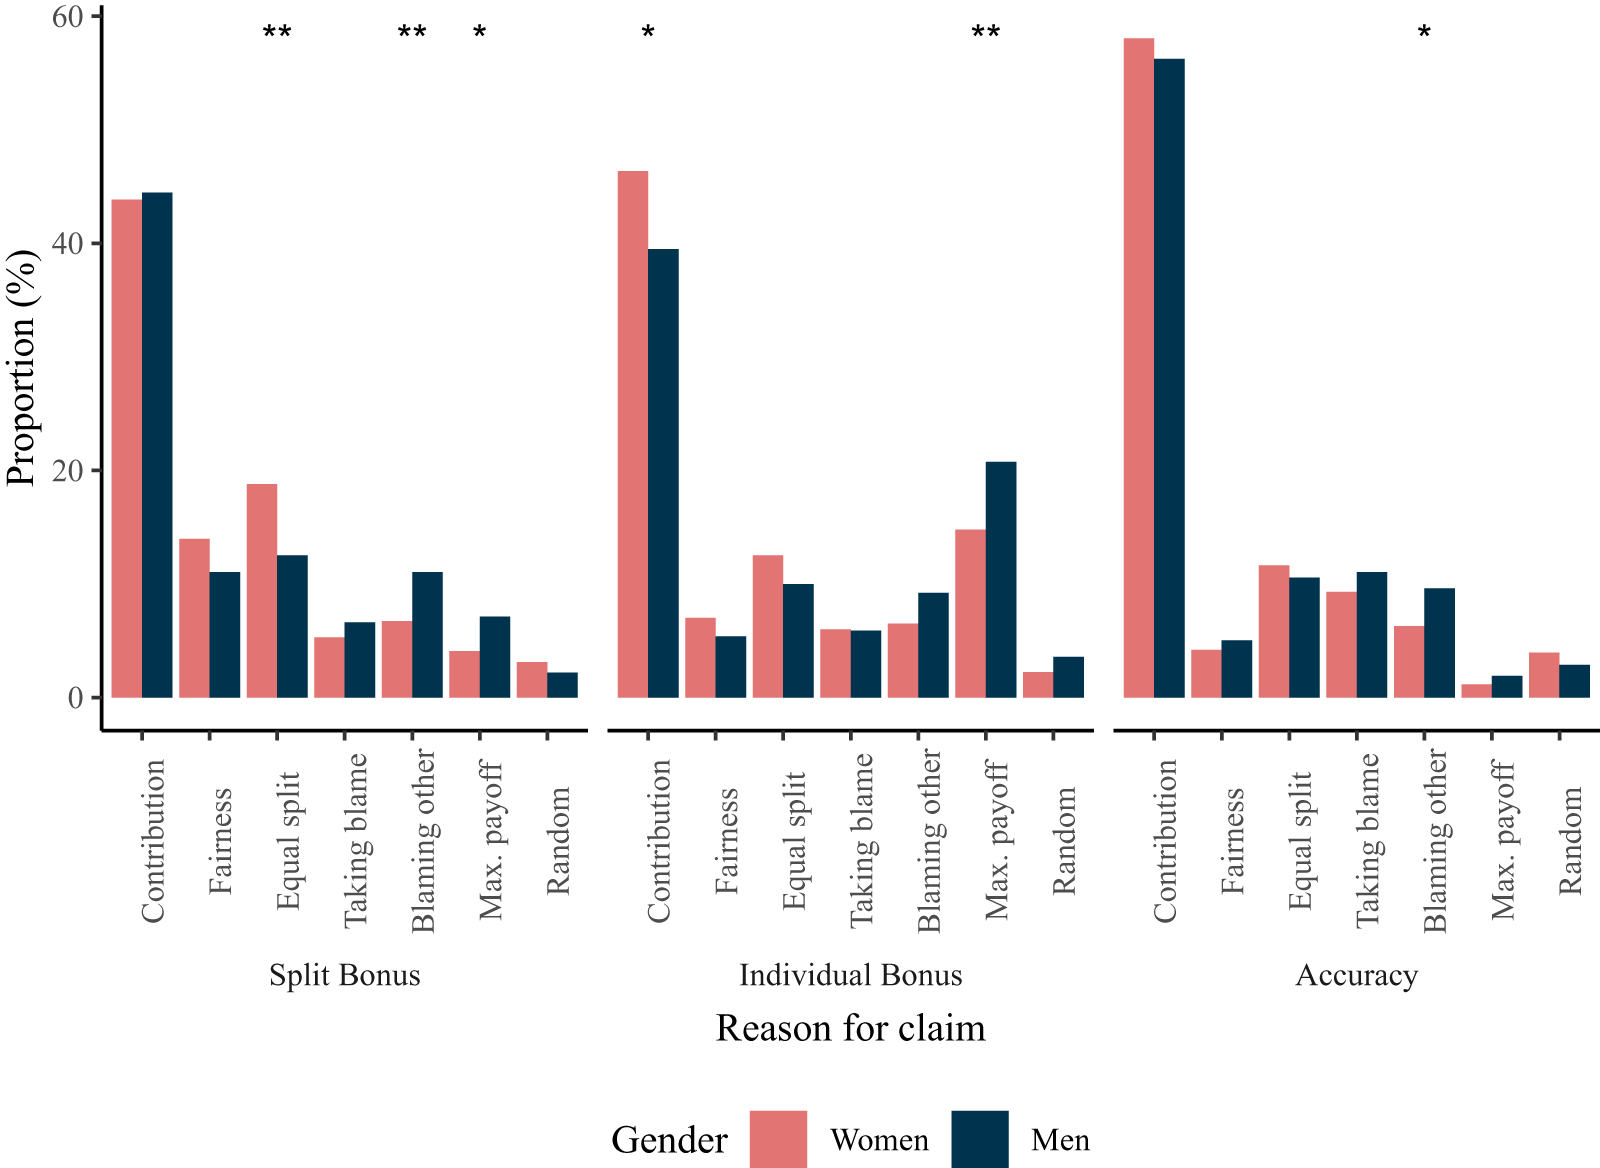
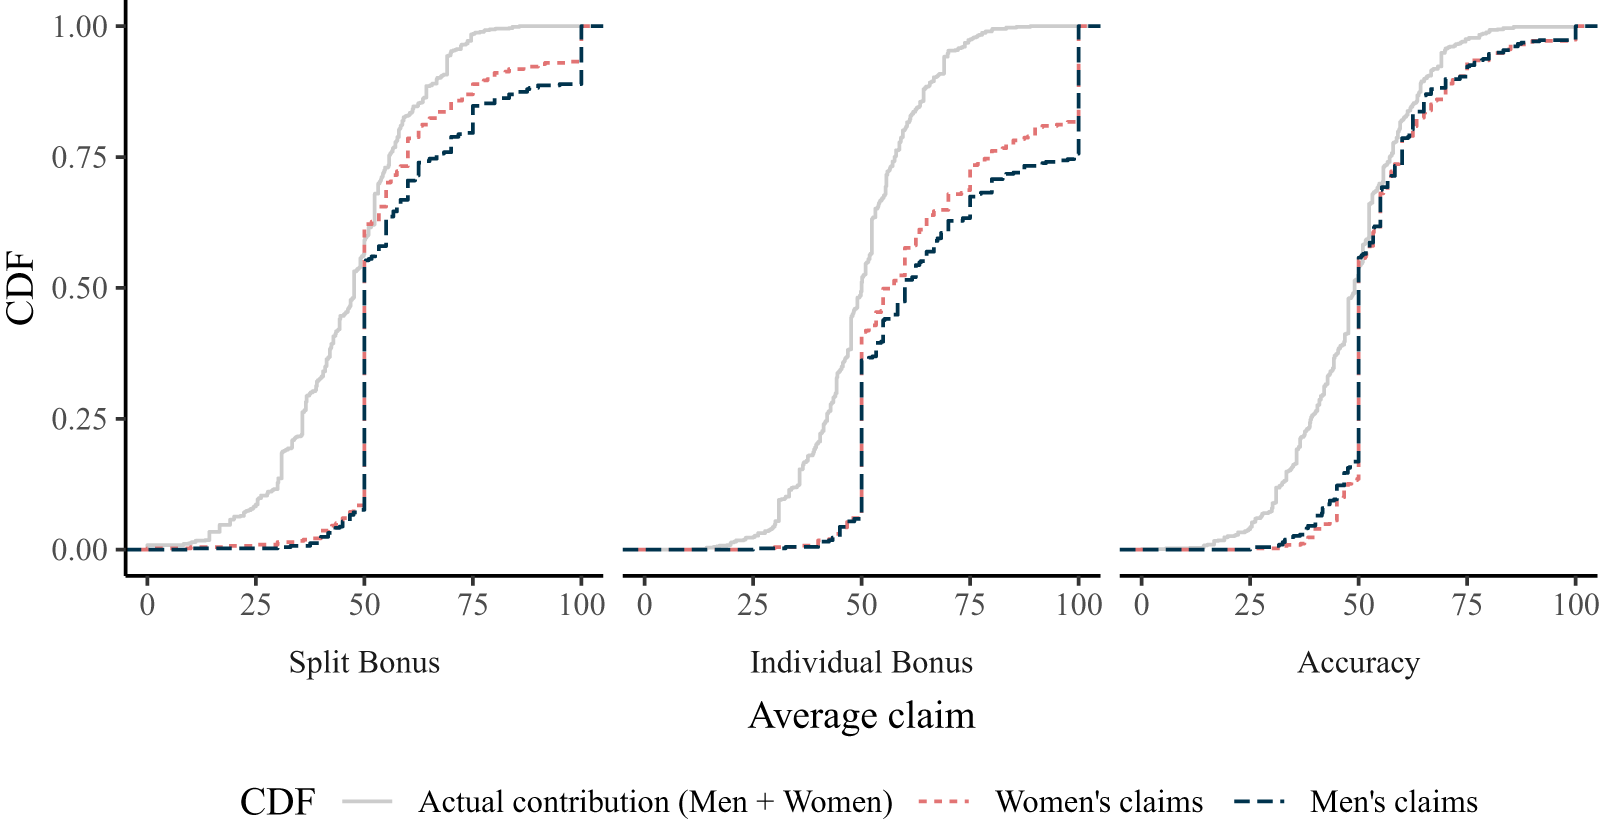
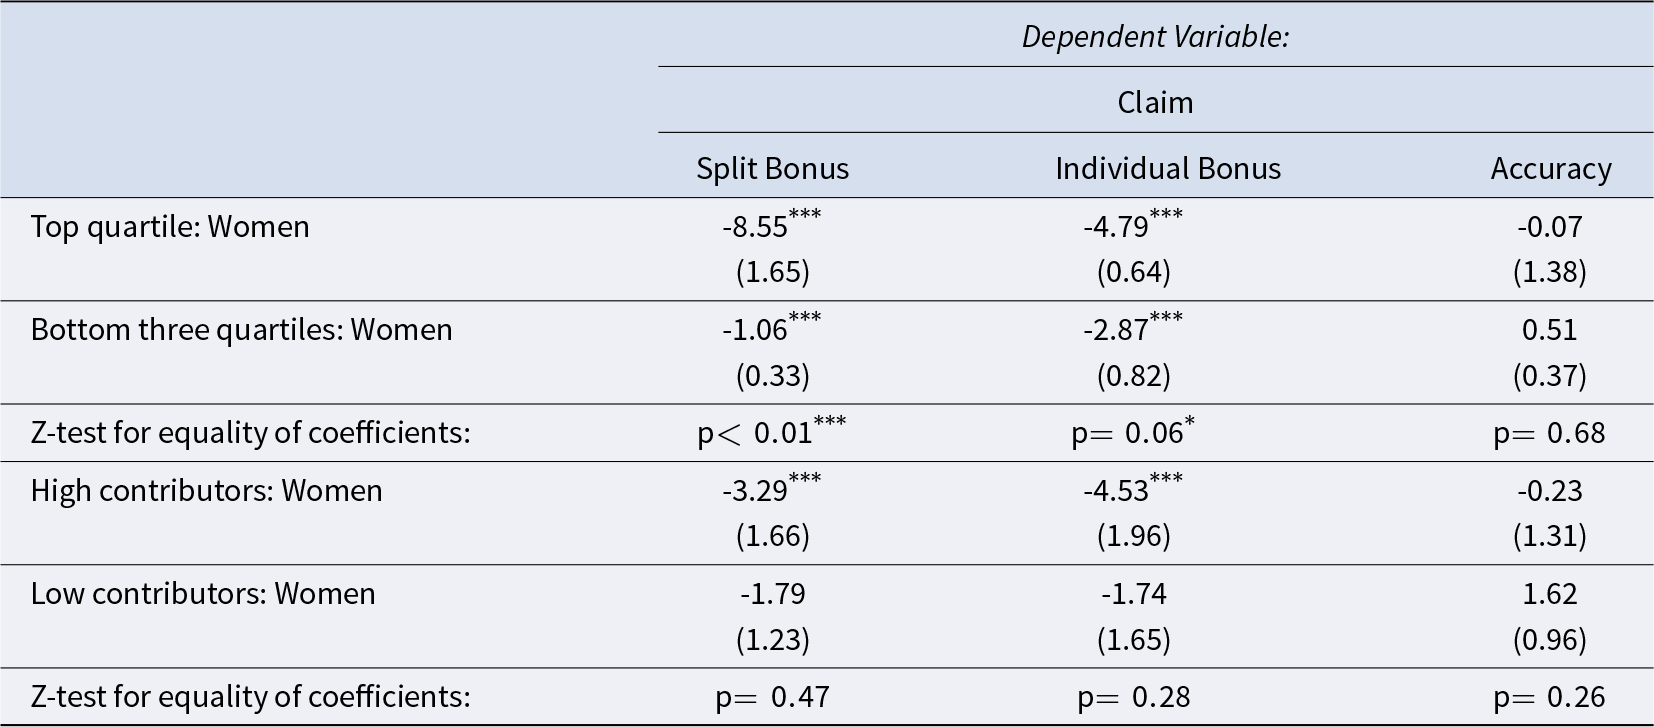
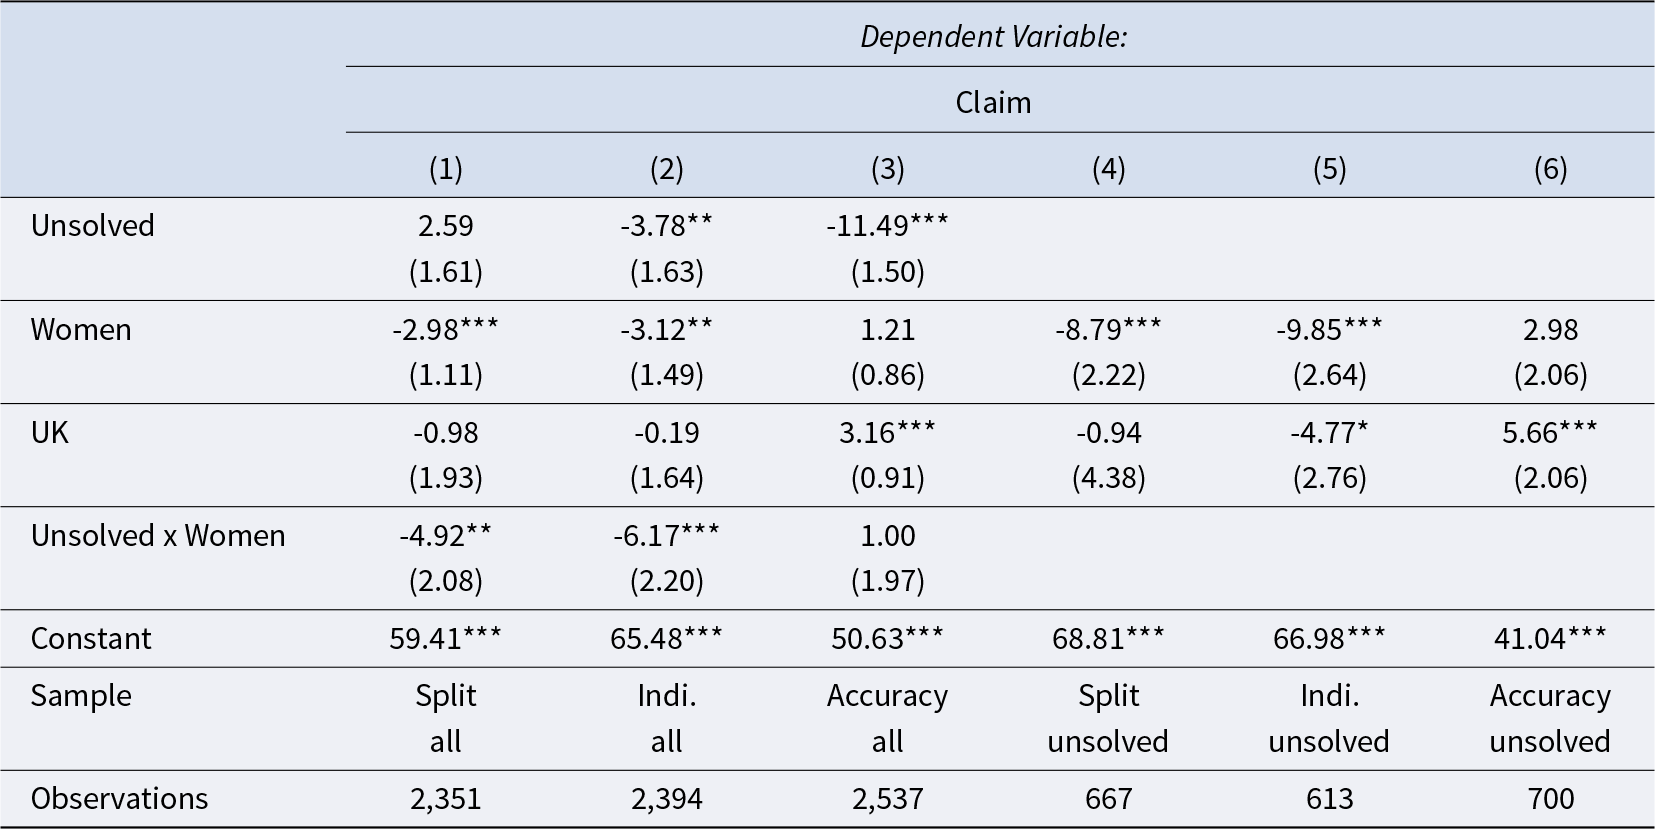


 Open access

