


1 Introduction
In English, certain derived words such as depàrtméntal, collèctívity or retùrnée may present prominence contours which differ from morphologically simple words and also violate a general restriction against the adjacency of prominent syllables. The aim of this article is to determine in which conditions these violations may occur and what that tells us about phonological relationships between morphosyntactically related words.
The organisation of the article is as follows. In section 2, the notions of ‘prominence’ and ‘clash’ are defined and discussed. In section 3, the main facts about phonological relationships between morphosyntactically related words in English, some of the analyses which have been proposed for these facts and the questions raised by the exceptional words under investigation here are presented. The dataset used in this study is presented in section 4 and the analyses of that dataset are presented in section 5. Finally, the findings of the present study are discussed and a formal account of the phenomenon is proposed in section 6.
2 Stress, accent and clashes
The terms ‘stress’ and ‘accent’ have been used in various (and sometimes contradictory) ways (see Fox Reference Fox2000: section 3.1.1; Schane Reference Schane2007; van der Hulst Reference Hulst2012, Reference Hulst and Van der Hulst2014). The view adopted here is that they correspond to different levels in the organisation of prominence within words.
As pointed out by Hayes (Reference Hayes1995), stress cannot be defined on the basis of its physical properties because it is ‘parasitic’, i.e. it is realised through phonetic resources which may be used for other phonological purposes. Phonetic studies on stress have shown that it is realised by pitch, intensity and duration and cannot be reduced to a single parameter (see e.g. Fry Reference Fry1955, Reference Fry1958; Fox Reference Fox2000: section 3.2 for a review). Therefore, stress has to be defined through other properties. Hayes (Reference Hayes1995: ch. 2) does so by considering the properties of the syllable which receives the strongest prominence (primary stress) and which can be identified because it receives a pitch accent when inserted into a sentence. For example, in English, flapping of /t/ and /d/ may only occur if the following syllable is unstressed (e.g. data [déɪɾə] vs attain [əthéɪn]), whereas aspiration of voiceless plosives only occurs word-medially if they are in the onset of a stressed syllable and are not preceded by /s/ (e.g. accost [əkh st] vs chicken [tʃíkən]).Footnote 2 Subsidiary stressed syllables, which are more difficult to identify than primary stressed syllables because they do not systematically receive a pitch accent (see below), can therefore be identified using these additional phenomena as diagnostics. In standard varieties of British and American English such as the ones described in Wells (Reference Wells2008), all syllables containing a full vowel are usually analysed as stressed, with only two exceptions: [ɪ] may be stressed or unstressed and word-final [əʊ] is never stressed when it does not carry primary stress (as shown by the flapping of /t/ in words like photo [f
 ʊɾəʊ] or tomato [təméɪɾəʊ]). The reduced vowels [ə, i, u], i.e. are always unstressed.Footnote 3
As pointed out by Gussenhoven (Reference Gussenhoven2004, Reference Gussenhoven, Van Oostendorp, Ewen, Hume and Rice2011), only certain stressed syllables can receive a pitch accent: secondary stressed syllables immediately preceding the syllable carrying primary stress (e.g. exPLAIN → EXplaNAtion (*ex PLAINAtion)), with the exception of transparent prefixes (e.g. arch-bishop, ex-colonel, unmodest), or following the primary stressed syllable (e.g. alli gator, demon strate) do not normally receive pitch accents. Gussenhoven analyses these syllables as bearing an accent, which he defines as ‘a place marker in the phonological structure where tones are to be inserted’ (Gussenhoven Reference Gussenhoven, Van Oostendorp, Ewen, Hume and Rice2011). This proposal is consistent with the results reported by Plag, Kunter & Schramm (Reference Plag, Kunter and Schramm2011), who study the acoustics of right-prominent words (i.e. with a pretonic secondary stress; e.g. violation, publishee) and left-prominent words (i.e. with a post-tonic secondary stress; e.g. randomize, activate) in both ‘accented’ and ‘unaccented’ positions (for the authors ‘accent’ refers to phrase-level prominence). They had participants read out a carrier sentence with the target word in focus position (e.g. ‘She said X again’, where X stands for the target word) or non-focus position (e.g. ‘Did PETER say X again? No, it was JOHN who said X’). They report no significant difference between primary and secondary stressed syllables in the ‘unaccented’ condition (i.e. the first three syllables of activate and activation have the same prominence contour). However, they report that right-prominent and left-prominent words differ in that the former receive two accents whereas the latter only receives one (e.g. activation has two accents but activate only has one). This shows that not all stressed syllables can be accented but that all accented syllables are stressed. In other words, accented syllables are a subset of stressed syllables. Because of the common overlap between accent and stress (many common words have only one accented and stressed syllable), it may not be easy to distinguish these two notions. However, they are different phenomena, which is why it seems crucial to distinguish them.
Therefore, in the rest of this article, the term ‘accent’ will be used to refer to those syllables which can receive pitch-accents when found in a prominent position in discourse. As the syllables marked for ‘stress’ in pronunciation dictionaries such as Jones (Reference Jones2006) or Wells (Reference Wells2008) correspond to syllables treated here as ‘accented’,Footnote 4 these syllables will be referred to as ‘accented syllables’ and not ‘stressed syllables’. The term ‘stress’ will only be used when referring to previous work or to refer to syllables containing a full vowel other than unaccented word-final [əʊ] and the ambiguous [ɪ].
In the rest of this article, the following notation will be used:
 /1/ for primary accent (the rightmost accent);
- /2/ for secondary accent (all non-rightmost accents);
- /0/ for unaccented syllables.

Using this notation, the contour studied in this article will be referred to as the ‘/021(-)/ contour’ (where ‘(-)’ indicates optional syllables after the first three syllables).
Cases of stress clash, i.e. a sequence of two adjacent stressed syllables can be found easily in English (e.g. cònd[e]mnátion, [ɒ]ctóber, pr[aɪ]vátion) even though stress tends to be dispreferred in syllables which are adjacent to the primary stressed syllable. However, accent clashes are more rarely attested within a single phonological domain, i.e. if we exclude compounds and constructions with transparent prefixes.Footnote 5 Dabouis (Reference Dabouis2016) studies around 6,000 word from Wells (Reference Wells2008) and finds 368 words with an accent clash, in which the adjacent accented syllables are always the first two syllables of the word (e.g. bànjó, mùndáne, scàléne) and in which the initial secondary accent is often variable. Accent clashes further from the left edge are practically unattested among monomorphemic words or words containing a bound root (but see the few counterexamples in (6)).
3 Phonological identity between words
3.1 Local preservation
In English, the phonological patterns of complex words sometimes differ from those of simple words and this difference can be attributed to the preservation of the phonological properties of a morphosyntactically related word. This can be called ‘paradigmatic dependency’, which Bermúdez-Otero (Reference Bermúdez-Otero2016a) defines as in (1).
(1) Paradigmatic dependency in morphophonology (Bermúdez-Otero Reference Bermúdez-Otero2016a: section 7)
The form of a linguistic expression a is predictable from the surface representation of one or more morphosyntactically related expressions {b, c, . . .}.
Cases where a and b stand in a relationship of containment, i.e. b is contained within a, have traditionally been analysed using cyclicity which, according to Scheer (Reference Scheer2011: 85), has been one of the defining properties of generative phonology from its beginnings to more recent theories such as Phase Theory.Footnote 6 The cycle can be defined as follows: ‘the computation of the phonological properties of the parts precedes and feeds the computation of the phonological properties of the whole’ (Bermúdez-Otero Reference Bermúdez-Otero and Trommer2012).
Cyclicity was introduced to account for the difference in pairs such as còndensátion ~ còmpensátion, in which the former can have [e] in its second syllable but not the latter (Chomsky & Halle Reference Chomsky and Halle1968: 39). This is attributed to the difference between the bases of these words: condénse has an accent (and therefore a full vowel which can be transmitted to its derivative) on its second syllable, but cómpensate does not. The phonological form of the derivatives is therefore assumed to be dependent on the phonological form of their bases and, in cyclic phonology, the phonological computation of the base is assumed to precede that of the derivative. This particular configuration (cyclic preservation in inter-tonic position) has been argued to provide unconvincing evidence for the cycle because underived words can have an unreduced vowel in that position (e.g. òst[e]ntátion) and certain derivatives have a systematically reduced second vowel even though the corresponding vowel is accented in the base (e.g. ìnf[ə]mátion, despite inf[ :]m) (Halle & Kenstowicz Reference Halle and Kenstowicz1991).Footnote 7
Let us now consider the case of English derivatives with three pretonic syllables. Monomorphemic words normally have an initial accent,Footnote 8 whereas derivatives preserve the position of the accent found in their base: àbracadábra, èlecampáne Footnote 9 vs orìginálity (cf. oríginal), famìliárity (cf. famíliar) (Hammond Reference Hammond1989; Kiparsky Reference Kiparsky1979; Halle & Kenstowicz Reference Halle and Kenstowicz1991; Collie Reference Collie2007, Reference Collie2008). Derivatives preserving the accent found on the second syllable of their bases are evidence that the phonological shape of the derivatives depends on that of their bases because the former cannot be predicted by the grammar of simple words (which predicts an initial accent) but the latter can. Because the base is contained within the derivative, this can be analysed through cyclicity as in (2).
(2)

A single cycle would incorrectly generate *òriginálity and *fàmiliárity (cf. àbracadábra). The contrast between abracadabra and originality can be formalised as in (3) using Optimality Theory (henceforth OT).
(3) Accent placement in OT
Ident-Accent: An accented syllable in the input should be accented in the output.
Accent-Left:Footnote 10 The leftmost syllable of the word should be accented.
(a)
(b)


The ranking Ident-Accent >> Accent-L predicts that if an accent is present in the input, the preservation of that accent will systematically override the assignment of secondary accent to the leftmost syllable. Because originality has the accent of original in its input,Footnote 11 it gets a second-syllable accent (3a) whereas abracadabra has no accent in its input and receives an initial accent (3b).
The accentual contour considered in this article, /021(–)/, can be analysed in a comparable manner. In English, monomorphemic words or words containing a bound root with two pretonic syllables all have an initial secondary accent (e.g. àlabáster, guàrantée, màthemátics, sòlidárity).Footnote 12 Derivatives with a base accented on its second syllable normally do not preserve that accent and also have an initial accent (e.g. aróma → àromátic, gazétte → gàzettéer, specífic → spècifícity). If we add a new constraint to represent the general restriction against adjacent accents which outranks Ident-Accent, *Clash, this can be analysed as in (4).
(4) Non-preservation in the second syllable in derivatives with two pretonic syllables
*Clash: Avoid adjacent accents.

In this configuration, *Clash prevents the preservation of the accent on the second syllable of the base and rules out candidate a. Then, candidate b is ruled out because it violates Accent-L, which leaves us the correct form, candidate c.
Exceptions to that analysis have been reported in the literature (Kager Reference Kager1989: 171; Collie Reference Collie2007: 79; Hammond Reference Hammond1999: 329; Pater Reference Pater2000: section 2.4). Consider the examples in (5), which are all taken from Collie (Reference Collie2007: 79) who collected them from Jones (Reference Jones2003).
(5)

The examples in (5) are exceptional because they violate *Clash, apparently favouring accent preservation to clash avoidance. All the authors who mention cases such as these (see references above) also point out that this contour is only found in derivatives, which in turn strongly suggests that cyclic preservation is the force overriding *Clash. Overall, this is supported by a search in Wells (Reference Wells2008), as the only monomorphemic words or words containing a bound root found are those listed in (6).Footnote 13
(6)

Even though the first three words in (6) are not derived through suffixation, the presence of an accent on their second syllable can be attributed to a morphosyntactically related form: the neoclassical root electro-,Footnote 14 refráct and relúctant (blended with cònductívity), respectively. Only the last two words in (6) appear to be free from morphological influences,Footnote 15 but the /021(-)/ pronunciation for these words can only be found in American English. Therefore, in British English, the /021(-)/ contour does seem to be only found in derivatives.Footnote 16 We can also note the instability of the accentual patterns in (6) which is an additional clue to the exceptional character of the /021(-)/ contour. This variability can also be found in most of the words in (5) and, as will be seen below, in most of the words which can be accented /021(–)/. In the rest of this article, we will refer to the occurrence of this contour as exceptional accent preservation (EAP).
Kager (Reference Kager1989: 171) argues that stress preservation may occur in dissyllabic pretonic sequences if the second syllable of that sequence is heavy, as in the case of the words in (5). This raises two questions: is a heavy second syllable a requirement to allow EAP? And, if that parameter is not sufficient to account for EAP, what other parameters can account for the occurrence of that contour?
In the next two sections, two parameters which may affect accent preservation will be presented: the existence of a more deeply embedded word and the relative frequency of the base and its derivative.
3.2 Preservation from a remote base
When a word is formed through successive affixations (e.g. person → personify → personification), it is generally the immediately embedded constituent (henceforth the ‘local base’) which can transmit its properties to that word, rather than more deeply embedded constituents (henceforth ‘remote bases’). For example, accent is generally inherited from the local base, but not from the remote base, as shown by the examples in (7), which are taken from Guierre (Reference Guierre1979 : 323). The terminology is borrowed from Stanton & Steriade (2014) but is used in a slightly different way for remote bases: the authors adopt an approach in which paradigmatic dependencies may hold between forms which do not stand in a relationship of containment. They analyse morphosyntactically and semantically related forms which are more frequent than a derivative as its remote bases (e.g. atomicity has four remote bases: atom, atomician, atomize, atomization). However, in this article, only forms which are contained within the local base are treated as remote bases.
(7)

However, there are reported cases of what Collie (Reference Collie2007: 288) calls ‘leap-frogging’ preservation, i.e. cases in which phonological properties appear to be transmitted directly from the remote base to the derivative. For example, Bermúdez-Otero (Reference Bermúdez-Otero2007) reports the paradigm in (8c) in the speech of a former colleague at the University of Manchester:
(8)

Both (8a) and (8b) correspond to what classic cyclic approaches predict. In (8a), the diphthong of cycle is transmitted to cyclic and then on to cyclicity.Footnote 17 In (8b), the vowel undergoes shortening in cyclic and that vowel is then transmitted to cyclicity. However, in (8c), cyclicity appears to inherit its vowel from the remote base cycle rather than from the local base cyclic. Additionally, the phonology does not predict a diphthong in this position, which shows it is indeed the preservation of the diphthong of cycle.
However, convincing evidence for leap-frogging preservation is hard to come by. Collie (Reference Collie2007: 289) lists potential examples such as tótal → totálity → totàlitárian ~ tòtalitárian. It could be argued that the second variant of totalitarian preserves the initial accent in total, and especially so if we take into consideration the fact that total is more frequent than totality. But it is very difficult to demonstrate that the initial accent in tòtalitárian comes from total because preservation failure of an accent on the second syllable of the local base results in an initial accent even in derivatives which do not have a remote base (e.g. antícipate → antìcipátion ~ ànticipátion). Here preservation failure (and therefore the default initial accent) cannot be distinguished from preservation from the remote base.
There are two ways one could demonstrate an influence of the remote base. The first would be to show that derivatives with a remote base behave differently from derivatives without a remote base. The second is as follows: as accent preservation failure never results in the accentuation of the second syllable of the derivative if a word only has one base, accent preservation from a remote base could be proposed in a configuration in which the remote base is accented on its second syllable and the local base is accented on its first syllable (but not on the second). In that configuration, if a derivative does not preserve the initial accent of its local base and has an accent on its second syllable, it could be argued to be evidence for leap-frogging preservation. Such cases are listed in (9):Footnote 18
(9) acádemy → àcadémic → acàdemícian ~ àcademícian
aróma → àromátic → àromatícity ~ aròmatícity
As pointed out by Ricardo Bermúdez-Otero (personal communication), the derivatives in these examples both have an onsetless first syllable and it has been argued that this could favour the accentuation of the second syllable rather than that of the first syllable (Collie Reference Collie2007: 103; Halle & Kenstowicz Reference Halle and Kenstowicz1991).Footnote 19 Therefore, the examples in (9) do not constitute incontrovertible examples of leap-frogging preservation any more than cases such as totalitarian.
To sum up, let us formulate the conditions in which one can claim that the phonological shape of a derivative can be said to be influenced by that of its remote base. The derivative must have a phonological characteristic which is:
- not predicted by the grammar of monomorphemic words or words containing a bound root;
- found in the remote base and
○ absent from the local base. In that case only is there evidence for leap-frogging preservation.
or
○ present in the local base, but there should be a significant difference between derivatives with remote bases and those with only a local base. This is not evidence for leap-frogging preservation but simply evidence for an influence of the remote base on the derivative.
Moreover, Collie (Reference Collie2007: 289) argues that a remote base is more likely to transmit some of its properties to its derivative if that remote base is more frequent than the local base. Therefore, frequencies have to be taken into consideration in the study of the interaction between bases and their derivatives.
Some of the examples of words which can be accented /021(–)/ cited in (5) have remote bases which have primary accent on the same syllable as the local base (e.g. connéct → connéctive → cònnectívity ~ connèctívity). Therefore, the role of remote bases will have to be evaluated in this study of EAP.
Finally, it is worth noting that traditional approaches to cyclicity cannot account for the type of leapfrogging phenomena discussed in this section. As Collie (Reference Collie2007: 288) points out, ‘while strict locality is assumed in cyclic analyses, it does not automatically follow from theories of lexical access’. Under fake cyclicity (see section 3.4), if the remote base is more frequent than the local base, it may influence the phonological shape of the derivative more than the local base does.
3.3 Relative frequency and Hay's dual-route race model of lexical access
Previous studies have shown that stress preservation (Collie Reference Collie2007, Reference Collie2008) and vowel preservation can be described with reference to the relative frequency of a base and its derivative (Hammond Reference Hammond2003; Kraska-Szlenk Reference Krazka-Szlenk2007), i.e. that these preservation phenomena are more likely to occur if the base is more frequent than its derivative. This can be exemplified by the examples in (10), which are taken from Bermúdez-Otero (Reference Bermúdez-Otero and Trommer2012: section 3.3.3), after Kraska-Szlenk (Reference Krazka-Szlenk2007: section 8.1.2).
(10)

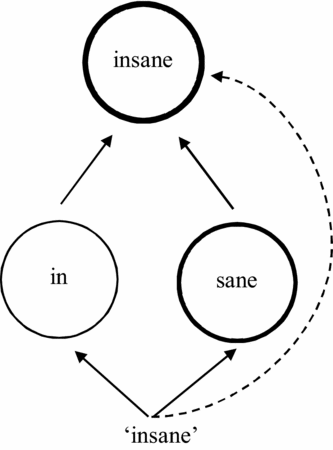
Collie (Reference Collie2007, Reference Collie2008) claimsthat this supports Hay's (Reference Hay2001, Reference Hay2003) proposal on relative frequency according to which lexical access in complex words can be achieved through two routes: a direct route and a decomposed route. Hay argues that the more frequent a word is, the higher its resting activation level, and the easier and faster that word can be accessed in long-term memory. Therefore, if a base is more frequent than its derivative, the decomposed route should be the fastest, which means that the base is more likely to be perceived inside the derivative. In that case, the base is more likely to transmit its properties to its derivative. Conversely, if a derivative is more frequent than its base, the direct route should be the fastest, and we could expect preservation to fail. This dual-route model of lexical access can be represented as in figure 1.
Schematized dual-route model from Hay (Reference Hay2001). The solid line represents the decomposed route and the dashed line represents the direct route. Resting activation levels are represented by the thickness of the circles (BNC frequencies: sane (289), insane (360)).

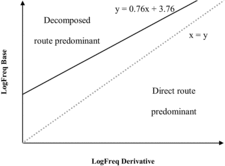
In Hay (Reference Hay2001), the proposed parsing line (i.e. the line above which items are more likely to be accessed through the decomposed route) is the arbitrary x = y line. Hay & Baayen (Reference Hay, Baayen, Booij and van Marle2002) refine this proposal with an empirically motivatedFootnote 20 parsing line above which words should mainly be accessed through the decomposed route and below which words should predominantly be accessed via the direct route. The line represents the relative frequencies for which both routes are equally likely. They note that if this line is above x = y, it may be because the direct route is likely to have an advantage due to the added effort of retrieving the different parts of a word. Both parsing lines are represented in figure 2.
The x = y line is represented by the dashed line. Hay & Baayen's (Reference Hay, Baayen, Booij and van Marle2002) parsing line is represented by the solid line.

Collie's (Reference Collie2007, Reference Collie2008) work on relative prominence preservation in -ion derivatives finds that relative frequency is a significant predictor of preservation failure: if a derivative is more frequent than its base, it is more likely to fail to preserve the position of the accent found in its base, and so more likely to be receive an initial accent, like monomorphemic words or words containing a bound root (e.g. antícipate → antìcipátion ~ ànticipátion).Footnote 21 Within the framework of Stratal OT (Bermúdez-Otero Reference Bermúdez-Otero and Trommer2012, Reference Bermúdez-Otero2016b; Bermúdez-Otero & McMahon Reference Bermúdez-Otero, McMahon and Trommer2006), Collie uses the concept of ‘fake cyclicity’ to capture the data.
3.4 Fake cyclicity
Like Lexical Phonology and Morphology (LPM; Kiparsky Reference Kiparsky, Van der Hulst and Smith1982, Reference Kiparsky1985; Mohanan Reference Mohanan1982; Kaisse & Shaw Reference Kaisse and Shaw1985), Stratal OT assumes the hypothesis that phonological computation is achieved through the application of three distinct phonological grammars: the stem-level phonology, the word-level phonology and the phrase-level phonology. In classical LPM, the highest stratum, the stem-level, is internally cyclic. This means that a complex form can undergo several passes through the stem-level phonology at every concatenation of an affix defining a stem-level domain. This means that the computation of a word such as Elìzabéthan requires two stem-level cycles: one for Elízabeth and one for Elìzabéthan.
In Stratal OT, all strata are non-cyclic. The effects of the stratum-internal cycle of classical LPM are captured by positing that the outputs of the stem-level phonology are stored non-analytically, i.e. they are stored in a morphologically unanalysed form.Footnote 22 Therefore, the computation of a complex form like Elìzabéthan does not require two online cycles. Elízabeth is stored in long-term memory with the output of the stem-level phonology, including its antepenultimate accent. In the computation of Elìzabéthan, this accent is present in the input as Elízabeth is retrieved from the lexicon. A faithfulness constraint (such as Ident-Accent) then ensures that the accent on the second syllable of Elízabeth is preserved in Elìzabéthan. The computation of the accentual contour of Elìzabéthan is therefore comparable to that of orìginálity shown in (3a). Once performed, the output of that computation is stored as well and the computation becomes a ‘lexical redundancy rule’ (Jackendoff Reference Jackendoff1975).
Crucially, the retrieval of the base in the lexicon can fail, as predicted by Hay's model of lexical access. If it fails, then the computation of the complex form has no accent in the input to preserve and it is therefore performed independently of the accentual contour of the base. For example, miscegenation is more frequent than its base, miscegenate and, as a consequence, is more likely to be accessed through the direct route. Therefore, the accent on the second syllable of miscégenate will not be present in its input. If so, the computation of miscegenation will be as in (11).
(11)

In that configuration, there is no accent to preserve and so the word receives the ‘default’ initial accent, just like monomorphemic words or words containing a bound root (e.g. àbracadábra, èlecampáne, ròdomontáde). To sum up, in that analysis, the failure of accent preservation in a derivative is attributed to a direct lexical access, which is caused by the high frequency of that derivative relative to the frequency of its base.
3.5 Interim summary: what could explain the /021(–)/ contour?
In the preceding sections, several parameters which could potentially determine the occurrence of EAP have been mentioned. Let us briefly summarise these parameters here.
The first parameter is syllable structure. As Kager (Reference Kager1989: 171) reports the /021(–)/ contour only for derivatives with a heavy second syllable and a light first syllable, we could expect the weight of the first two syllables to be a determining factor. However, this could be an effect of absolute weight (e.g. the weight of the second syllable) or of relative weight (e.g. the weight of the second syllable relative to that of the first syllable). Both will have to be tested.
Besides, consonants and vowels have been shown to affect stress in different ways. Let us consider two examples. Firstly, in English, final long vowels have been claimed to attract final stress regardless of the category of the word,Footnote 23 whereas final consonant clusters only attract final stress in verbs (Chomsky & Halle Reference Chomsky and Halle1968; Hammond Reference Hammond1999; Hayes Reference Hayes1980). Secondly, consider the examples in (12), which are taken from Burzio (Reference Burzio1994: 54–5).
(12)
(a) assíst → assístant
(b) rev[íə]re → rév[ə]rent
In (12a), stress is maintained on the second syllable, whereas in (12b), it moves back one syllable, although both final syllables are heavy in the bases, which predicts that both derivatives should be stressed identically. Therefore, vowels and consonants will be treated separately in the analysis.
In order to evaluate the relative weight of the first two syllables, the mora counts in Hammond (Reference Hammond1999: 145) which are listed in (13) were used. They are based on distributional regularities in English and on the assumption that syllables should contain at least two morae (except if they contain schwa) and three morae at the most.
(13)

The second parameter is word frequency. It has been shown that a high frequency of the base relative to that of its derivative can be expected to favour preservation. However, since Fidelholtz (Reference Fidelholtz1975), high-frequency words have been shown to be more likely to undergo lenition (see Myers & Li (Reference Myers and Li2009) for a review). As a consequence, absolute frequency has to be controlled for. Finally, we saw that a high-frequency remote base could be expected to favour preservation. Therefore, the study of frequency will have to take into consideration the frequencies of both local and remote bases.
The last parameter which might be expected to influence accent preservation is suffix-specific idiosyncrasies. It is possible that certain suffixes reject accent clash more than others. Some suffixes may also be morphologically more decomposable than others (Hay Reference Hay2003; Hay & Baayen Reference Hay and Baayen2003), the morphological decomposability of a given suffix being linked to the frequency of derivatives containing that suffix relative to that of their bases. Ideally, each suffix should be studied individually. If the numbers per suffix are too low for a separate analysis, differences will still have to be evaluated and (if possible) accounted for.
4 Data collection and selection
In order to study EAP, we would ideally want to consider all possible relevant words, especially if statistical analysis is to be conducted. Therefore, I set out to gather as many derivatives as possible which are listed in Wells (Reference Wells2008) as British pronunciations and which have the following properties:
- They have primary accent on their third syllable.
- Their base has primary accent on its second syllable and no accent on its first syllable.Footnote 26
- They have only one phonological domain. This is to ensure that a domain boundary will not interfere with accent preservation. Therefore, the dataset will not include compoundsFootnote 27 or prefixed constructions which have a prefix with transparent semantics.
- They should not contain neoclassical roots because these tend to be accentually invariant (Guierre Reference Guierre1979: 740; Tournier Reference Tournier1985: 92; Fournier Reference Fournier2010: 76–7).Footnote 28
- They should not be listed in the online Oxford English Dictionary (OED) as obsolete, rare, nonce or as belonging to a variety of English other than British English.Footnote 29
In order to sort free bases from bound bases, the OED was consulted to see whether it lists a form embedded within the suffixed form. Only the words which do have an embedded form listed in the OED were kept, unless that embedded form is marked as being rare, obsolete, a nonce-word or belonging to another variety of English. Words with non-standard terminal elements (e.g. cigar illo, collect anea, infus oria) were preserved because an identifiable suffix is not necessary for the recognition of morphological complexity. For example, -red is not a common suffix of English,Footnote 30 yet Raffelsiefen (Reference Raffelsiefen1993: 11–12) argues that English speakers clearly recognise hate in hatred. Truncated forms such as anonymous → anonym ity, psoriasis → psoriat ic were also included.
The search returned 291 words (the complete list can be found in the Appendix), which were divided into two groups according to their accentual contour:Footnote 31
- Group 1 : derivatives which can have the /021(–)/ contour (32 words, among which 4 only have the /021(–)/ contour: adoptee, remittee, returnee, semantician, and 4 have it as their main pronunciation: appointee, escapee, retiree, selectivity).
- Group 2 : derivatives which can only be accented /201(–)/ (259 words, e.g. acceptation, deprivation, obligee).
Word frequencies were collected from the SUBTLEX-UK database (Van Heuven et al. Reference Heuven, Mandera, Keuleers and Brysbaert2014). The lemma frequency counts were calculated by adding up the different word-forms frequencies. The total frequency counts were log-transformed (as logex) so they may resemble the way ‘humans process frequency information’ (Hay & Baayen Reference Hay, Baayen, Booij and van Marle2002).
All the items were coded for the following variables:
- BaseFq: the log-transformed frequency of the base(s);
- DerFq: the log-transformed frequency of the derivative;
- RelFq: the role of the relative frequency of the derivative and its base was tested with the two parsing lines discussed in section 3.3. This was done with a binary variable in the following two conditions:
○ RelFq(x=y): The cases in which the base is more frequent than the derivative were coded as ‘yes’ and the remaining cases as ‘no’ (x=y parsing line).
○ RelFq(H&B): The cases in which the frequency of the base is above 0.76 times the frequency of the derivative plus 3.76 were coded as ‘yes’ and the remaining cases as ‘no’ (Hay & Baayen's parsing line).
- S1-Closed: Derivatives whose base has a closed first syllable were coded as ‘yes’ and those which have an open first syllable were coded as ‘no’.
- S2-Closed: Derivatives whose base has a closed second syllable were coded as ‘yes’ and those which have an open second syllable were coded as ‘no’.Footnote 32
- S1-V: The vowel of the first syllable of the base was coded as ‘reduced’ or ‘full’.
- S2-V: The vowel of the second syllable of the base was coded as ‘short’ or ‘long’.
- S1-Weight: The first syllable was coded as heavy if it has at least two morae and as ‘light’ if it contains less than two morae.
- S2- Weight: The second syllable was coded as heavy if it has at least two morae and as ‘light’ if it contains less than two morae.
- S1≥S2: If the first syllable of the base is heavier than or has the same weight as the second syllable, the item was coded as ‘yes’ and if it is lighter than the second syllable, it was coded as ‘no’.Footnote 33 Syllable weight was evaluated using the mora counts in (13).
These variables were tested in a binary logistic regression in two conditions. In condition A, the frequency of the base in the analysis is that of the local base only. In condition B, the frequency of the base in the analysis is that of the most frequent base.
5 Results
In both conditions, only RelFq(H&B), S1-Closed and S2-Closed turned out to have a significant relationship with the accentual contour of the derivatives. BaseFq and DerFq were significant predictors only in Condition B. Let us review these two conditions.
5.1 Condition A: Local base only
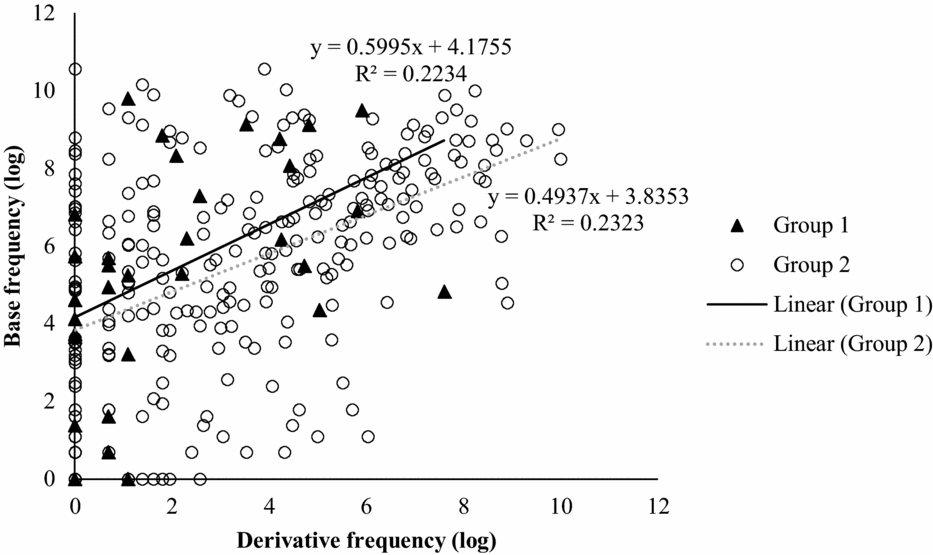
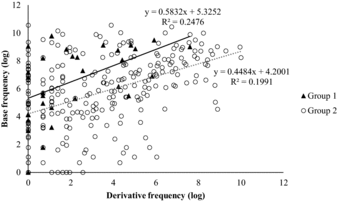
Figure 3 shows the frequency of the base and the frequency of the derivative plotted against one another in Condition A.
Relative log frequencies in Condition A. The solid line represents the regression line for Group 1 and the dashed line represents the regression line for Group 2.

As we could expect if relative frequency is related to accent preservation in this environment, the regression line for Group 1 (i.e. the words which can be accented /021(–)/) is above the one for Group 2 (i.e. the words which can only be accented /201(–)/). This means that the words in Group 1 are more likely to be decomposed and is consistent with the fact that they can preserve the accent on the second syllable of their base. Even though the difference between the two groups is not clear in figure 3, the role of relative frequency appears under statistical analysis. The results of the regression analysis for condition A are presented in table 1.
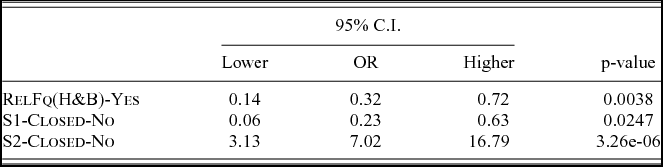
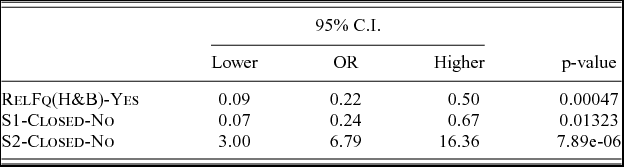
Logistic regression for Condition A

This analysis shows that there is a significant relationship between the relative frequency of the base and its derivative and EAP (p < .005). As the OR (odds ratio) is below 1, it means that if RelFq(H&B) has the value ‘yes’, then the derivative is less likely to have the /021(–)/ contour. The analysis also shows that there is a relationship between the closedness of the first two syllables and EAP (p < .05 for the first syllable and p < .000005 for the second syllable). Let us review the results for Condition B before further discussion of the results.
5.2 Condition B: Remote base
In Condition B, the frequency of the base included for the analysis of relative frequency is that of the most frequent base. If we plot the data in this new configuration, we get the scatterplot in figure 4.
Relative log frequencies in Condition B. The solid line represents the regression line for Group 1 and the dashed line represents the regression line for Group 2.

It can be seen that the regression line for Group 1 is considerably higher than the one for Group 2, much more so than for Condition A. Consequently, we can expect the relationship between relative frequency and EAP to be stronger than in Condition A. This is confirmed by the regression analysis in table 2.
Logistic regression for Condition B – relative frequency

In Condition B, the relationship between relative frequency and EAP is indeed stronger than in Condition A (p < .0005 in Condition B vs p < .005 in Condition A). The relationship between the closedness of the first two syllables and EAP remains highly significant (p < .05 in Condition B vs p < .05 in Condition A for the first syllable and p < .00001 in Condition B vs p < .000005 in Condition A for the second syllable).
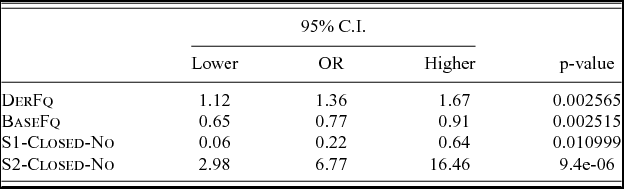
In this condition, the absolute frequencies of both the base and the derivative also turn out to be significant, as shown by the results of the regression in table 3. These results show that the more frequent a derivative is, the less likely EAP is, which conforms to the traditional argument that high-frequency words are more likely to diverge from their base. The results also show that a higher base frequency correlates with a higher probability of EAP. Finally, the closedness of the first two syllables remain highly correlated to EAP in this analysis.
Logistic regression for Condition B – absolute frequency

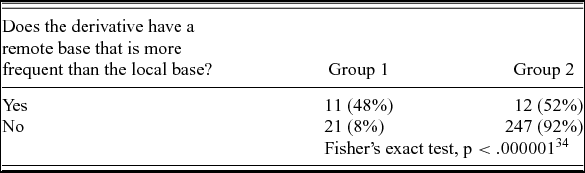
Distribution between Group 1 and Group 2 depending on the existence of a remote base that is more frequent than the local base

As mentioned in section 3.2, the influence of a remote base on the pronunciation of its derivative can be demonstrated if we can show that there is a difference between derivatives which have a remote base (and especially those whose remote base is more frequent than their local base) and those which do not. To evaluate whether such a difference can be found in the set of derivatives studied here, let us consider the data in table 4. These data show that there is a significant difference (p < .000001) between derivatives which do have a remote base that is more frequent than their local base and derivatives which do not: the former are over five times more likely to belong to Group 1 than the latter.
Let us sum up the findings so far. It has been shown that the higher the frequency of a base is relative to the frequency of its derivative, the more likely the derivative is to preserve the accent of its base and therefore to be accented /021(–)/. This relationship was shown to be even more significant if the base frequency taken into account in the analysis is that of the most frequent base. Moreover, it is only when the frequency of the most frequent base is taken into account that absolute frequency can be significantly related to EAP. Therefore, the high frequency of a remote base appears to increase the chances for a derivative to be faithful to it. Finally, it was shown that an open first syllable and a closed second syllable facilitates the preservation of an accent on the second syllable. Let us now consider the results in more detail in order to evaluate the interaction between relative frequency and the closedness of the first two syllables.
5.3 Detailed results
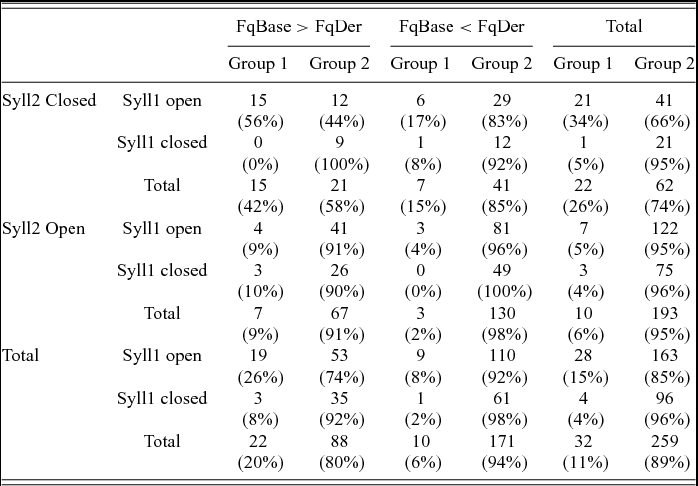
Consider the data in table 5, which show the distribution between the two groups in Condition B according to the two parameters which have been shown to be significantly connected to the accentuation of the derivatives: relative frequencyFootnote 35 and closedness of the first two syllables. These data show that the parameters are independently connected to EAP but also, crucially, that there is a cumulative effect of these parameters. Indeed, the highest proportion of Group 1 derivatives (56%) is found when the base is more frequent than the derivative and has an open first syllable and has a closed second syllable. If we take the opposite values of these parameters, i.e. when the base is less frequent than the derivative, the first syllable is closed and the second syllable is open, we get a complete absence of EAP (0 cases out of 49).
Detailed distribution of the data according to the two significant parameters in Condition B

Two inventories do not fit with the analysis. The first concerns words with two closed syllables and with a base which is more frequent than the derivative. As two of the determining parameters have the values associated with EAP (the closedness of the second syllable and relative frequency), we could expect to find at least a few EAP cases but none are attested out of 9 relevant cases. This may be an accidental gap due to the low number of relevant cases. More surprisingly, we find 3 cases of EAP out of 29 words (10%) with a closed first syllable, an open second syllable and a base which is more frequent than the derivative. In this configuration, we do not expect that many EAP cases because of the segmental makeup of the words.
5.4 Suffix specificities?
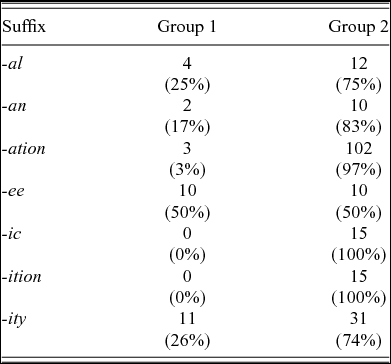
Let us consider the distribution of the derivatives between Group 1 and Group 2 depending on the rightmost suffix they contain in table 6 (only suffixes found in more than ten derivatives are shown).
Distribution between Group 1 and Group 2 per suffix

The data in table 6 could suggest that certain suffixes ‘allow’ the /021(–)/ contour whereas others ‘forbid’ it. The question is therefore to determine what could possibly cause the differences between suffixes. All these suffixes regularly shift accent rightwards and are usually classified as ‘Class-I’ suffixes (Siegel Reference Siegel1974), so classhood cannot be determining here. Some are auto-accented (they bear accent on themselves: -átion, -ítion, -ée) while others are not (-al, -an, -ic, -ity) and it does not seem to correlate with the possibility for the derivatives to be accented /021(–)/. However, -ee is not just auto-accented, it also imposes final accent, which is marked in English, especially for nouns. This accentual property of the suffix may facilitate its parsing and therefore preservation from the base. However, one would have to explain the behaviour of the words containing -ese. That suffix also forms nouns and bears accent on itself and, in the data, only one out of nine words containing that suffix can be accented /021(–)/.
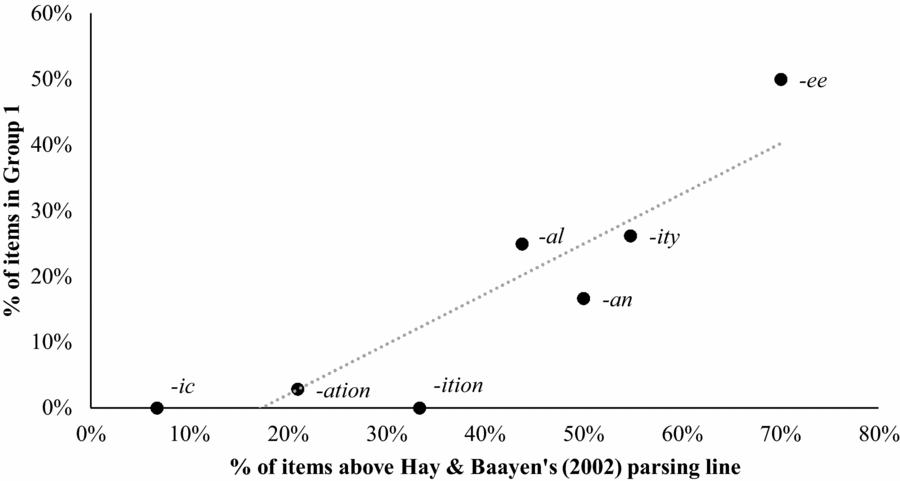
Considering the relationship between relative frequency and EAP reported in the previous sections, it is possible that the reason why the words containing different suffixes pattern differently is that these words have different base-derivative frequency ratios from one suffix to another. In other words, the difference between the different suffixes could be due to relative frequency and may have nothing to do with suffix idiosyncrasies. In order to evaluate whether this is the case, the proportion of items in Group 1 for each suffix was plotted against the proportion of items containing that suffix which fall above Hay & Baayen's parsing line in figure 5.
Proportion of items in Group 1 and above Hay & Baayen's (Reference Hay, Baayen, Booij and van Marle2002) parsing line per suffix

Figure 5 shows that, overall, the proportion of items that fall above Hay & Baayen's parsing line for a given suffix is correlated to the number of items belonging to Group 1 for that same suffix. This does not exclude that there are indeed suffix specificities affecting accentual contours here but it makes it difficult to demonstrate. Hay & Baayen (Reference Hay, Baayen, Booij and van Marle2002) and Hay (Reference Hay2003: 137) claim that suffixes found in words which are generally less frequent than their bases have lower activation levels than those which are generally more frequent than their bases. In other words, independently of the frequency ratio for a given base-derivative pair, some suffixes may be more decomposable than others. For example, Hay (Reference Hay2003: 137) suggests that, even though grayish and scenic have similar base-derivative frequency ratios, grayish would be more decomposable than scenic because words suffixed with -ish are generally less frequent than their bases, which is not the case for -ic derivatives. This view would certainly be worth investigating because the three derivatives which are less frequent than their base and have an open second syllable but nonetheless preserve an accent on the second syllable are all -ee derivatives (debauchee, detainee, remittee) and that could be accounted for if -ee itself turned out to be highly decomposable.
Therefore, it would be interesting to see whether the accentual contours reported here are consistent with the overall decomposability of suffixes. We can expect them to be so, at least to some extent, if we consider the results reported by Hay & Baayen (Reference Hay and Baayen2003). The authors evaluate the parsability of different English affixes based on the frequency of words containing these affixes and that of their bases, the number of words containing these affixes and the phonotactic probability of juncture. Interestingly, they report -ee to be more parsable than the other suffixes considered here, which is consistent with the fact that suffixed words in -ee in the dataset studied here are more often accented /021(–)/ than words with other suffixes.Footnote 36
6 Discussion
6.1 Summary of findings
The findings reported in section 5 have consequences for the analysis of the phenomenon considered here, exceptional accent preservation, and have wider implications for English morphophonology. Let us first summarise and comment these findings.
First, two parameters were found to facilitate EAP:
- Relative frequency: If a base is more frequent than its derivative, then that derivative is more likely to be accented /021(–)/.
- Closedness of the first two syllables:
○ If the first syllable is open, then the derivative is more likely to be accented /021(–)/.
○ If the second syllable of the base is closed, then the derivative is more likely to be accented /021(–)/.
This improves our knowledge of this exceptional accentual behaviour because the literature discussed in section 3.1 only mentions that words accented /021(–)/ have a heavy second syllable. On the one hand, this has been shown to be imprecise because only consonantal structure was found to be related to EAP and, on the other hand, it is incomplete because it does not tell us what determines which words with heavy second syllables can be accented /021(–)/. The results reported in this article allow for a more accurate description of the phenomenon, as it has been shown that EAP can be (probabilistically) predicted by the frequency of the base relative to that of its derivative. Moreover, it has been shown that these two parameters are the most robustly related to EAP when they both have positive values, i.e. when derivatives are less frequent than their base and when their base has an open first syllable and a closed second syllable. A formal analysis of EAP and its interaction with relative frequency and syllable structure will be proposed in section 6.2.
Secondly, it was shown that including the frequency of remote bases in the analysis strengthens the relationship between relative frequency and EAP and that derivatives which have a remote base that is more frequent than the local base were much more likely to show EAP than derivatives which do not. This constitutes evidence for an influence of the remote base on the derivative, but it is not evidence for leap-frogging preservation. Leap-frogging preservation requires the remote base and the local base to differ with regards to the phonological property under consideration (as in the example of c[aɪ]cle → c[ɪ]clic → c[aɪ]clicity discussed in section 3.2). It is not the case here because both bases are accented on their second syllable. The implications of this finding will be discussed in section 6.3.
6.2 A formal account of exceptional accent preservation
The fake cyclicity analysis presented in section 3.4 uses blocking of the retrieval of the base (because of its low frequency relative to the derivative) and therefore the absence of the base in the input of the computation of the derivative to account for preservation failure. EAP cannot be analysed exactly in the same way. The general case (non-preservation) was analysed in OT using the constraint ranking *Clash >> Ident-Accent >> Accent-Left. The fake cyclicity analysis as proposed by Collie (Reference Collie2007, Reference Collie2008) requires some additional elements. First, to integrate the effect of closedness of the second syllable, we need to add a new constraint to the analysis, Accent(VC), which requires closed syllables to be accented.Footnote 37 Second, to account for the fact that we get the highest proportion of items belonging to Group 1 when the base is more frequent than the derivative, when the first syllable is open and when the second syllable of the base is closed, we need to be able to express the fact that the violations of Ident-Accent and Accent(VC) can be cumulated and have greater chances of outweighing a violation of *Clash.
One way to do this is to use weighted constraints (Pater Reference Pater2009, Reference Pater, McCarthy and Pater2016). In classical OT, the principle of ‘strict domination’ forbids the possibility for the cumulated violations of lower ranked constraints to outweigh the violation of a higher ranked constraint. In a model using weighted constraints, cumulative constraint interaction is allowed as the relative strength of constraints is not expressed through ranking but through their weight. Candidates are evaluated by their harmony (H) which is the weighted sum of violations. The optimal candidate is the one which has the highest harmony.
Let us take a hypothetical grammar with three constraints A, B and C with weights of 3, 2 and 2, respectively.
(14)
(a)
(b)


In (14a), candidate a only violates and therefore has a harmony of –3. However, candidate b violates B, which has a weight of 2, and therefore has a harmony of –2. Candidate b has the highest harmony is therefore the optimal candidate. In (14b), candidate b also violates C and therefore has a harmony of –4. In this configuration, the cumulated violations of B and C are costlier than the violation of A, and candidate a is the optimal candidate even though it violates the ‘strongest’ constraint.
We also need to be able to express the probabilistic nature of EAP. This can be achieved with a probabilistic model of grammar such as Max-Ent-OT (Goldwater & Johnson Reference Goldwater, Johnson, Spenader, Eriksson and Dahl2003) in which ‘a candidate's probability relative to the rest of the candidate set is proportional to the exponential of its harmony’ (Pater Reference Pater2009). In this model, example (14b) becomes (15).
(15)

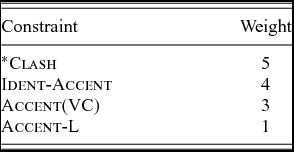
In this analysis, candidate (a) has a probability of 0.73 and is therefore more likely than candidate (b), which only has a probability of 0.27. The analysis of EAP can therefore use such a model to give us probabilities for each accentual contour in each possible segmental configuration. Let us assume the weights in table 7 to see how the analysis could work.Footnote 38
Constraint weights

Moreover, if we analyse the relative frequency effects found in the data using Hay's model of lexical access (see section 3.3), then it means that the nature of the input itself depends on whether the derivative is accessed through the direct route or through the decomposed route. If it is accessed through the direct route, then the input will be the derivative itself, listed non-analytically along with its accentual contour, which I will assume to be /201(–)/Footnote 39 (see (16a)). If it is accessed through the decomposed route, then the input will be a combination of the free base (listed with its accentual contour) and the suffix (see (16b)).
- (16)
(a) Decomposed route
(b) Direct route


With this analysis, EAP has a probability of 0.73 if the word is accessed through the decomposed route and 0 if it is accessed directly.
Finally, the analysis requires one last ingredient. We need to integrate the probability that a given derivative will be accessed through the decomposed route or through the direct route. This is because the global probability for a given contour is equal to the probability predicted by the grammar for that contour multiplied by the probability that the input will be a combination of the free base plus the suffix plus the probability predicted by the grammar for that contour multiplied by the probability that the input will be the listed derivative itself. This can be formulated as (17).
(17) p(contour) = (p(grammar) × p(input = free base + suffix)) + (p(grammar) × p(input = listed derivative))
However, we do not have a way to determine the probability for which route of the dual-route race model will be favoured. In our analysis of the data, we distinguished items whose relative frequency is above Hay & Baayen's (Reference Hay, Baayen, Booij and van Marle2002) parsing from those whose relative frequency is below that line, but parsability has been shown to be influenced by other parameters such as semantic transparency and phonotactics (see Hay & Baayen Reference Hay and Baayen2003 and Ben Hedia & Plag Reference Hedia and Plag2017). Ideally, a composite measure of segmentability which could be turned into a probability of decomposed access would be required.
Let us try and see how the analysis proposed here could function. We can keep the weights in table 7, which will generate the probabilities predicted by the grammar in each segmental configuration. Then, based on the probabilities predicted by this grammar and the observed distribution of the data, we can infer what the probabilities for the different access routes should be. This method yields the probabilities in (18).
(18)

This means that, on average, we assume that items whose relative frequency is above Hay & Baayen's parsing line have a probability of 0.8 to be accessed through the decomposed route whereas items whose relative frequency is below that line have a probability of 0.25 to be accessed through the decomposed route. These estimates allow us to calculate the probabilities for each accentual contour in the two models, as shown in (19). To simplify the presentation of the different syllabic configurations, I used the common notation L for ‘light’ and H for ‘heavy’ syllables, but here L refers to open syllables and H refers to closed syllables. The comparisons between the global probabilities for each segmental configuration are shown in (20a) for model1 and in (20b) for model2.
(19)

(20)
(a) Model1 (items whose relative frequency is above Hay & Baayen's parsing line)
(b) Model2 (items whose relative frequency is below Hay & Baayen's parsing line)


This analysis allows us to generate models which, overall, fit the distribution of the data. Interestingly, using a single constraint to capture the effects of syllable closedness correctly predicts the similar probabilities of EAP in #LL(–) and #HH(–) configurations (modulo the probably accidental gap in the data with #HH(–) words whose base is more frequent than the derivative). However, the analysis fails to predict the 10% of EAP found in the data in #HL(–) words in (20a) but this is not surprising because, as mentioned above, these words do not fit the global analysis of EAP proposed here.
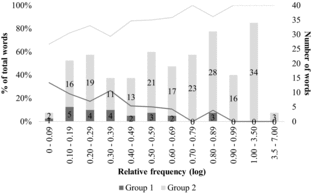
Although this analysis is a first approximation, it shows how the cumulative effect of relative frequency (through the increased weight of Ident-Accent) and closedness of the first two syllables can be captured using an interaction between the probabilities generated by a probabilistic model of grammar using weighted constraints and the probabilities of morphological decomposition in lexical access. One way the analysis could be improved would be to turn the segmentability of a given complex word into a probability that this word will be accessed through the decomposed route. In interaction with the probabilities predicted by the grammar, the refined analysis should account for the fact that EAP never occurs when the derivative is more frequent than its base (i.e. when the derivative/base frequency ratio is superior to 1), as shown in figure 6.
Percentage and number of Group 1 and Group 2 words per derivative/base frequency ratioFootnote 40

Finally, it would be interesting to test the present analysis on spoken data, in order to gain more statistical power to test the claims made in this article.
To sum up, EAP can be analysed using Collie's (Reference Collie2007, Reference Collie2008) fake cyclicity, which crucially refers to Hay's (Reference Hay2001, Reference Hay2003) dual-route race model of lexical access and to Stratal OT's assumption that words can be stored non-analytically along with their accentual contours (Bermúdez-Otero Reference Bermúdez-Otero and Trommer2012; Bermúdez-Otero & McMahon Reference Bermúdez-Otero, McMahon and Trommer2006; Bermúdez-Otero forthcoming). However, we have shown that analysis of EAP also requires weighted constraints and a probabilistic model of grammar such as Max-Ent.
6.3 The influence of the remote base
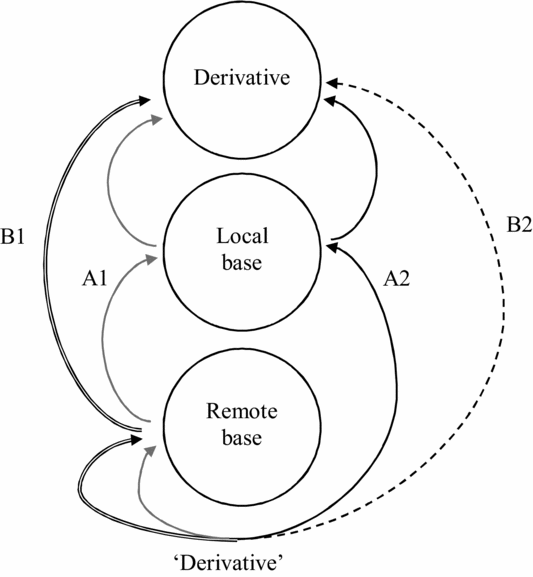
Let us conclude this discussion with some of the questions raised by the evidence supporting the influence of the remote base on the derivative. As the interaction between bases at different levels of embedding and their derivatives is largely uncharted territory, the method adopted in Condition B of the study discussed here is rather exploratory. Indeed, if frequency relationships between bases and derivatives are interpreted in terms of lexical access, then how can lexical access be modelled with a more deeply embedded base? If we expand on Hay's (Reference Hay2001, Reference Hay2003) model of lexical access (see section 3.3), there are four possible relative frequency configurations detailed below:
A. FqLocalBase > FqDerivative
1. FqRemoteBase > FqLocalBase: lexical access goes through the decomposed route both for the local base and for the derivative. In this configuration, we could expect a cumulated effect of the influence of the local base and the influence of the remote base (if they share the phonological property under investigation) or a conflict between these two influences (if they do not share that property).
2. FqRemoteBase < FqLocalBase: the local base is accessed directly and then the derivative is accessed through the decomposed route. In this configuration, we do not expect to see a difference between derivatives with only a local base and derivatives with a remote base.
B. FqLocalBase < FqDerivative
1. FqRemoteBase > FqDerivative: the derivative is accessed through the decomposed route but the local base is skipped. This is the configuration in which we would expect leap-frogging preservation.
2. FqRemoteBase < FqDerivative: the derivative is accessed directly. In this configuration, we expect preservation phenomena to be more likely to fail.
These four configurations therefore correspond to four routes of lexical access depending on the access route which is used at each level of embedding (direct or decomposed). These four possible routes can be represented as in figure 7.
The four possible routes of lexical access with a remote base

The method adopted in the study reported here neglects the difference between configurations A1 and B1 because, whenever the remote base was found to be more frequent than the local base, it was the frequency of the remote base which was included in the relative frequency analysis. This approach also neglects potential cumulative effects that could arise in configuration A1. This would not substantially affect the results reported here because only the three cases in (21) correspond to configuration A1.Footnote 41
(21) express (8.604) → expressive (5.645) → expressivity (1.792)
receive (9.787) → receptive (5.247) → receptivity (1.099)
reflect (8.604) → reflective (5.645) → reflectivity (1.792)
Consequently, the current dataset does not constitute a good testing ground for configuration A1 but it is a configuration which should be investigated in future research in order to determine whether it can differ significantly from configuration B1.
Finally, I do not have knowledge of any psycholinguistic work on the role of remote bases in lexical access but it would certainly be interesting to see whether the model in figure 6 can be supported by psycholinguistic evidence.
7 Conclusion
This article has shown that EAP can be partially attributed to word-frequency effects and partially to syllable structure. It has been shown that EAP is more likely to occur in derivatives which are less frequent than their base, which have an open first syllable and a closed second syllable. Moreover, it has been shown that these factors are the best predictors of EAP when they are combined. Finally, it has been shown that high-frequency more deeply embedded bases can affect the pronunciation of derivatives as derivatives with such bases were found to be more likely to display EAP.
A first approximation of how EAP can be formalised was proposed using fake cyclicity, weighted constraints, indexation of the weight of a faithfulness constraint to the relative frequency of the base and its derivative and a probabilistic model of grammar such as Max-Ent-OT. Because relative frequency is one of several parameters contributing to word segmentability, it was suggested that future research should consider looking at a composite measure of segmentability to try and see whether EAP can be better accounted for using such a measure rather than relative frequency alone. Finally, the implications of the evidence showing an influence of remote bases on the pronunciation of their derivatives were discussed, especially with regards to lexical access. Hay's (Reference Hay2001, Reference Hay2003) model of lexical access only deals with local bases and an expanded version of how that model could function if remote bases are integrated was proposed. This model presents four possible routes of lexical access and the predictions for each of these routes were presented.
Appendix: Dataset