Implications
The increase of live and carcass weights in cull dairy cows finished under high-intensity feeding periods is important to achieve fatness and conformation scores suitable for the supply of high-value loin steaks to the market. The findings of this study should provide valuable information for the finishing of cull dairy cows, aimed at gaining weight more efficiently depending on the initial body conditions and the high-energy forage diets available.
Introduction
Cull dairy cows are mature females over 36 months of age, which are usually eliminated from herds because of several reasons including low productivity, poor health and condition and management decisions (Mandell et al., Reference Mandell, Campell, Quinton and Wilton2006). They are often thin animals with a poor body condition score (BCS < 5, ranging from 1 (extremely thin) to 9 (extremely fat); Richards et al., Reference Richards, Spitzer and Warner1986), although they have the potential to express compensatory weight gain because of increased efficiency of energy supply and nitrogen retention (Freetly and Nienaber, Reference Freetly and Nienaber1998).
These animals are usually slaughtered without undergoing a finishing period (FP; Vestergaard et al., Reference Vestergaard, Madsen, Bligaard, Bredahl, Rasmussen and Andersen2007), and thus the carcasses from these animals are generally downgraded according to the European Union (EU) grading systems. Several studies have shown the advantages of increasing live and carcass weights of cull cows finished under high-intensity feeding periods (Franco et al., Reference Franco, Bispo, González, Vázquez and Moreno2009; Minchin et al., Reference Minchin, Buckley, Kenny, Monahan, Shalloo and O'Donovan2009). These beneficial effects have been widely studied for beef breeds (Cranwell et al., Reference Cranwell, Unruh, Brethour and Simms1996; Sawyer et al., Reference Sawyer, Mathis and Davis2004), but scarcely for dairy cows breeds (Therkildsen et al., Reference Therkildsen, Stolzenbach and Byrne2011).
The Galicia region, in the NW of Spain, holds the highest number of dairy cows (488 194; AEA, 2005) in the country, with the Holstein—Friesian (HF) being the most dominant breed. Their productive life is about 5 years, and after that age over 50% are culled because of different reasons (Franco et al., Reference Franco, Bispo, González, Vázquez and Moreno2009). More than 60% of the cull cows from Galicia have shown a low carcass fat score (FS; Carballo and Moreno, Reference Carballo and Moreno2006); however, they could potentially improve their carcass performances if they were adequately fattened before being slaughtered (Bispo et al., Reference Bispo, Franco, Monserrat, González, Pérez and Moreno2007). Grazing feeding systems were not sufficient to reach a high fat score on carcasses of cull cows (Bispo, Reference Bispo2007). Improvement of carcass classification can be achieved by supplying high-energy diets, such as conserved forages and concentrates, during the FP (Franco et al., Reference Franco, Bispo, González, Vázquez and Moreno2009).
A minimum carcass fat class of ‘4’ (i.e. a score of 11 on the 1 to 15 point scale) and a conformation class of ‘O’ (i.e. a score of 5 on the 1 to 15 point scale) are required for marketing high-value loin steaks as a delicatessen meal in the European restaurants.
New ways of animal feeding should be searched to reduce purchases of external concentrate feeds in farms owing to high and unstable prices at the market (Moreno, Reference Moreno2008). One alternative could be the use of high-energy forage silage to reduce the concentrate supplementation. The pastone silage (i.e. silage of the maize grain, cob and husk, close to the physiological maturity) has a high energetic value, reducing concentrate complement and feeding costs.
Large differences in BCSs can be found in cull dairy cows from farms. Thus, it should be interesting to determine how these differences in initial BCS could affect the length of the feeding period to get adequate fattened carcasses.
Indurain et al. (Reference Indurain, Carr, Goñi, Insausti and Beriain2009) showed that accurate estimates of animal fatness can be improved by using a set of variables such as fat thickness, ultrasound reading related to fatness and intramuscular fat (IMF) content analysis in combination with carcass fatness and carcass conformation score (CS).
The objective of this study was to evaluate different high-energy forage finishing diets and initial BCSs on the performance, live traits and carcass characteristics of cull dairy cows, aimed at achieving adequate fatness and CS for the marketing of high-value loin steaks.
Material and methods
The experiment complied with EU rules (Directive 2003/65/EC) concerning with experimental animals welfare.
Animal and experimental design
Thirty-two HF cows (approximately 2 to 10 years of age) from the Dairy Research Unit experimental herd of Mabegondo Agricultural Research Centre were progressively culled because of different reasons: old age, low milk production, reproductive and lameness disorders, milking uneasiness, mastitis and udder problems. Animals from the dairy herd were dried-off, according to the following procedure: cows were separated from the herd and fed with hay and water for a week. During this week, milk production was reduced to 3 to 5 l of milk. At this time, 12 g of the Cepravin® antibiotic was administered. After veterinary treatment, cows were offered hay for 2 or 3 more days to ensure cessation of milk secretion, and were taken to a pasture plot. The time span between the first and the last drying-off in the 32 animals coming from the Research herd lasted 60 days. During this period, animals were fed on a spring pasture. Further, animals were classified into two groups according to the BCS scale: a low body condition score (LBCS < 5) and a high body condition score (HBCS > 5; Richards et al., Reference Richards, Spitzer and Warner1986). Each BCS group was divided into two balanced subgroups that were fed on the following finishing diet: either (1) maize silage complemented with concentrate diet (MS+C) or (2) pastone silage complemented with dry-herbage diet (PS).
Within each BCS group, cows with similar age and BCS were randomly assigned to one of the two different finishing feeding treatments (8 cows per combination of feeding treatment and BCS group). Thus, the experimental design was a factorial 2 × 2, with two levels for each of the two factors: that is, finishing diet and body condition. In the trial, cows were fed until they reached a specific fatness target, regardless of the feeding time length.
Feeding and live animal recordings
During the trial, the two feeding groups (MS+C and PS) were assigned to two different plots where they were accommodated in an uncovered out-wintering paddock system. Outside feeders and drinkers were placed in these plots. All diets were provided once daily, and cows were allowed to consume their diets on an ad libitum basis. Dry matter (DM) intakes for concentrate, hay, maize silage and pastone silage were estimated as the difference between the daily amounts offered and refused by each group of animals. Concentrate was composed of a mixture of barley (82%), soya bean meal (13%), calcium phosphate (2%), calcium carbonate (1.9%), NaCl (0.8%) and a mineral/vitamin mix (0.3%). This last mix was made with 94% minerals (such as NaCl, Ca2PO4, CaCO3, ZnSO4, MnSO4, CuSO4, CoSO4) and 6% vitamins (such as vitamins A, D3, E and copper (II) sulphate 5-hydrate).
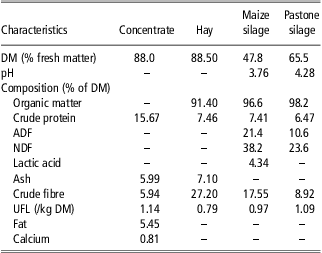
Feed chemical composition of concentrate, hay, maize and pastone silage (Table 1) consumed by the animals were sampled twice monthly and stored at −20°C before being analysed by the Official Reference Laboratory of Galicia, using gravimetric methodology for content of DM content, organic matter, and according to the International Organisation for Standardization (ISO) methodology for animal feeding stuffs for calcium, crude protein, crude fibre, fat, ash and acid and neutral detergent fibre (ISO 6869, 5983, 6865, 6492, 5984, 13906, 16472, respectively). The UFL (‘Unité Fouragère Lait’) unity is defined as the net energy for lactation equivalent to one kilogram of standard air-dried barley, and was estimated based on Vermorel et al. (Reference Vermorel, Coulon and Journet1987).
Average chemical composition of the concentrate, hay, maize silage and pastone silage offered to HF cull dairy cows

HF = Holstein–Friesian; DM = dry matter; ADF = acid-detergent fibre; NDF = neutral-detergent fibre; UFL = ‘Unité Fouragère Lait’.
UFL is the net energy for lactation equivalent to 1 kg standard air-dried barley.
Cows were weighed at the start of the trial (initial live weight, ILW), every 2 weeks and on the day before slaughter (final live weight, LW). Average daily gain (ADG) estimates were based on the 14-day interval live weights for each individual animal. Ultrasound one-dimensional measurements were taken for the determination of the subcutaneous backfat thickness (SBT) on the animal, until the aimed fat thickness was reached on the day before slaughtering. The target fat thickness sought was 1.1 cm. The image site was determined by palpation of the 12th and 13th thoracic vertebrae. Images were taken using real-time portable ultrasound equipment Aloka SSD-500 (Aloka Co. Ltd, Tokyo, Japan), equipped with an electronic linear probe (3.5 MHz, 120 × 20 mm). In order to establish good contact between animal hide and transducer, the area was thoroughly clipped and oiled with mineral oil (Aquagel; Meditec Co., Parma, Italy). The scan was collected from each animal by placing the probe longitudinally across the ribs and approximately halfway between the medial and lateral ends of the Longissimus thoracis muscle.
Slaughter procedures, carcass measurements and sampling
Animals were stunned by captive bolt pistol at a commercial abattoir located 4 km away from the Research Centre. After slaughtering, carcasses were hung by the Achilles tendon in the vertical position and were chilled for 48 h before sampling. Hot carcass weight (HCW) was recorded immediately after slaughter. A licensed technician graded carcasses for CS and FS according to the European beef grading system (Regulation 103/2006). Carcasses were classified using the EUROP classification scales for CS (i.e. E (excellent); U (very good); R (good); O (fair); P (poor)) scoring from 15 for E+ to 1 for P−. Similarly, for the fat cover classification (FS i.e. 1 (low); 2 (slight); 3 (average); 4 (high); 5 (very high)), the score used was 15 for 5+ and 1 of 1−. After chilling for 24 h at 2°C, the cold carcass weight (CCW) was recorded. After chilling for 48 h at 2°C, carcass was split along the vertebral column in two halves using a band saw. Left-side carcass measurements were recorded following guidelines of De Boer et al. (Reference De Boer, Dumont, Pomeroy and Weniger1974) for carcass length (CL), leg length (LL) and leg thickness (LT). Dressing percent (DP) was computed using CCW and LW measurements. Carcass compactness index (CCI) was computed using CCW and CL. Leg transversal length index (LTLI) was calculated using LL and LT. Subcutaneous fat depth at the 12th rib (SF12) was measured 25 mm from the lateral boundary of Longissimus thoracis (LT) muscle using a stainless-steel calibre (Renand and Fisher, Reference Renand and Fisher1997) and GR knife (fatness measurement: defined as the total fat tissue depth over the 12th rib at a point 11 cm from the midline of the carcass; GR) was also measured (Kirton and Johnson, Reference Kirton and Johnson1979).
The left side of each carcass was quartered between the 5th and 12th ribs. The rib bone was cut at the lateral limit of the Serratus muscle. The weight of the loin piece collected was recorded (loin piece weight, LPW). The LT muscle section perimeter was traced on acetate paper. The cross-sectional area (LT5, LT12) and the major and minor diameters (DMN5, DMN12, DMJ5, DMJ12) of the 5th and 12th ribs were estimated by an imagine analysis technique (Adobe Acrobat 9 Pro.Extended program) of the section trace after being scanned.
IMF content analysis
The LT muscle was removed from the loin piece. Samples from this muscle located at the 12th rib were split into one 2.5-cm thick steak and used for assessment of the IMF content. This steak was individually packed under vacuum (97%) using a model EV-15-1-D (TECNOTRIP, S.A., Terrassa, Spain), refrigerated at 0 ± 2°C within the 48 h post mortem, and transported for 2 h to the Meat Technological Centre situated in Ourense (Spain) for chemical analysis. Samples were defrosted and cut clean from connective tissue and subcutaneous fat, and were homogenised in a meat blender. The determination of total IMF percentage was made by the Soxhlet method (ISO 1443-1973). All samples were analysed in duplicate.
Statistical analysis
Six cows did not fulfil the requirements for being included in the data analyses. The exclusion was due to mastitis and poor performance resulting from anorexia during the FP. Thus, the final data set comprised 26 cows. Data were analysed by analysis of variance for a completely randomised design using the General Linear Model procedure of the Statistical Analysis Software package SAS (SAS Institute Inc., 2006). The model used was

where Yijk is the observation of the feeding diet i and BCS j on animal k for any of the dependent variables such as animal live weight, traits and measurements, carcass weight, traits and measurements; μ is the overall mean; Wi is the effect of the feeding diet i (i = 1, 2); Sj is the effect of initial BCS (j = 1, 2); (WS) ij is the interaction between feeding diet and BCS; εijk is the residual random error associated with the observation ijk. When differences between feeding diets appeared (P < 0.05) a Duncan test was done. Least squares means were presented in the ‘Results’ section and feeding diet differences were considered significant at P < 0.05.
The correlation procedure of SAS was used to calculate Pearson's correlation coefficients.
Results
Feeding duration and intakes
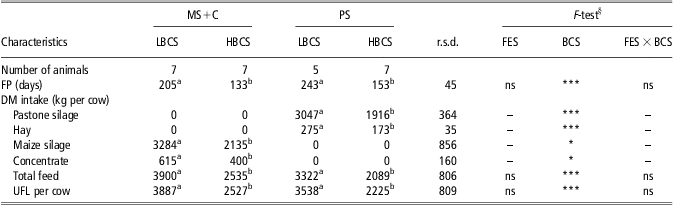
The least squares means for days of the FP, as well as for combinations of the initial BCSs with intake of several feeds such as pastone silage DM intake, hay DM intake, maize silage DM, concentrate intake and total feed intake (TFI), are presented in Table 2. Significant differences (P < 0.001) between the BCS groups were found for the duration of the FP (Table 2), considering that both groups of animals were slaughtered when they reached the required BCSs (a minimum carcass fat class of ‘4’ and a conformation class of ‘O’). The average duration of the feeding period for LBCS and HBCS groups was 224 and 143 days, respectively, which indicates a feeding period difference between groups longer than 2.5 months.
Effects of two feeding systems and two BCSs on the different diets consumed by HF cull dairy cows in the FP

BCSs = body condition scores; HF = Holstein–Friesian; FP = finishing period; MS + C = maize silage and concentrate; PS = pastone silage; LBCS = low BCS; HBCS = high BCS; r.s.d. = square root of the residual error of the ANOVA; FES = feeding systems; DM = dry matter; UFL = ‘Unité Fouragère Lait’.
UFL is the net energy for lactation equivalent to 1 kg standard air-dried barley.
Treatment means in the same row bearing different letters are significantly different (P < 0.05) under the Duncan test.
§Symbols ns, *, *** refer to non-significant, and significant at P < 0.05, 0.01 and 0.001, respectively; – means non-appropriate.
Table 2 shows mean intake per cow based on the measured intake per group. Average TFI (tonnes of DM/cow) was significantly lower (P < 0.001) for HBCS (2.31 t DM/cow) than for LBCS (3.61 t DM/cow) animals, whereas no significant differences for TFI were found between the two feeding diets. Similarly, the total UFL intake (TUFLI) was lower (P < 0.001) for the HBCS group (2376 UFL/cow) than for the LBCS group (3712 UFL/cow).
Live weights and performance traits
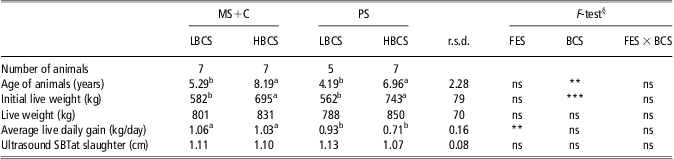
Least squares means for age of animals (AA), ILW, LW, ADG and final ultrasound SBT are summarised in Table 3 for the different feeding systems and the initial BCS groups. Significant difference (P < 0.001) for ILWexisted between the LBCS (572 kg/cow) and HBCS (719 kg/cow) groups, which is related to the initial assignation of animals to the two BCS groups. ADG values were greater (P < 0.01) for animals under the MS + C treatment than under the PS treatment (1.06 v. 0.93 kg/day per cow for LBCS, and 1.03 v. 0.71 kg/day per cow for HBCS).
Effects of feeding system and BCS on animal live recordings characteristics in HF cull dairy cows

BCS = body condition score; HF = Holstein–Friesian; MS+C = maize silage and concentrate; PS = pastone silage; r.s.d. = square root of the residual error of the ANOVA; LBCS = low BCS; HBCS = high BCS; FES = feeding systems; SBT = subcutaneous backfat thickness.
Treatment means in the same row bearing different letters are significantly different (P < 0.05) under the Duncan test.
§Symbols ns, *, *** refer to non-significant, and significant at P < 0.05, 0.01 and 0.001, respectively.
SBT determinations during the animal life were frequently assessed by ultrasound one-dimensional measurements on the 12th thoracic vertebrae, and were used as a criterion for determining the slaughter time when the aimed backfat thickness was reached. The final backfat thickness sought with the ultrasound predictor was 1.1 cm. The SBT overall mean was 1.1 cm (Table 3). No differences were found for final SBT values between both the feeding treatments and the BCS groups (Table 3). As result of achieving similar and adequate fatness and CS in all animals, no differences were found between both the feeding treatments and the BCS groups for LW, which averaged 795 and 841 kg/cow for LBCS and HBCS animals, respectively.
Carcass characteristics
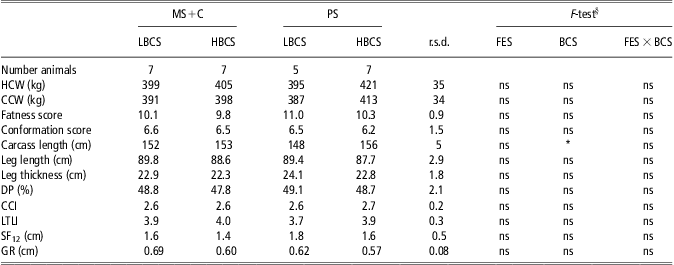
Least squares means estimates for HCW and CCW, carcass classification (FS, CS) and carcass measurements, such as CL, LL, LT, DP, CCI, LTLI, SF12 and GR, are presented in Table 4. All animals were slaughtered when they had reached a similar body condition. This may explain that no differences were found among the BCS and finishing treatments for carcass weight and classification and most of the other carcass measurements, except CL (Table 4).
Effects of two feeding systems and two BCSs on carcass traits in HF cull dairy cows

BCS = body condition scores; HF = Holstein–Friesian; MS + C = maize silage and concentrate; PS = pastone silage; r.s.d = square root of the residual error of the ANOVA; LBCS = low BCS; HBCS = high BCS; FES = feeding systems; HCW = hot carcass weight; CCW = Cold carcass weight; DP = dressing percentage; CCI = carcass compactness index; LTLI = leg transversal length index; SF12 = subcutaneous fat thickness 12th rib; GR = GR knife 12th rib.
Treatment means in the same row bearing different letters are significantly different (P < 0.05) under the Duncan test.
§Symbols ns and * refer to non-significant and significant at P < 0.05.
The overall average weight for CCW was 398 kg. All carcasses were classified above of 4− (averaging 10.3 for FS) and O+ (averaging 6.4 for CS). Thus, adequate carcasses classification for marketing high-value loin steaks was reached in all animals. The fatness carcass measurements as GR and SF12, showed no differences between the two different finishing systems (Table 4) with averages of 0.62 cm for GR and 1.6 cm for SF12.
Sampling pieces measurements and analysis
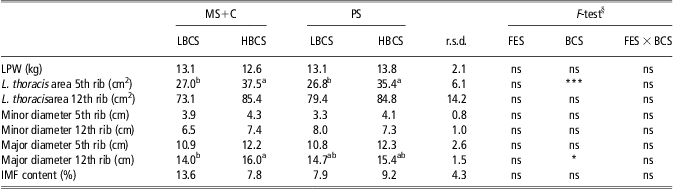
Measurements of the LPW, the LT muscle cross-sectional area (LT5, LT12), the minor and major diameters of the 5th and 12th ribs (DMN5, DMN12, DMJ5, DMJ12, respectively), and the IMF content of the muscle were summarised in Table 5. No differences were found between main effects of the two feeding systems for all the sampling pieces measurements and analysed traits. Data show that the cull dairy cows achieved an adequate fatness and CS for commercialising loin pieces with similar characteristics, regardless of the different feeding diets.
Effects of feeding system and two BCSs on the sampling pieces and IMF content traits of HF cull dairy cows

BCS = body condition scores; IMF = intramuscular fat; HF = Holstein–Friesian; MS + C = maize silage and concentrate; PS = pastone silage; r.s.d. = square root of the residual error of the ANOVA; LBCS = low BCS; HBCS = high BCS; FES = feeding systems; LPW = loin piece weight.
Treatment means in the same column bearing different letters are significantly different (P < 0.05) under the Duncan test.
§Symbols *, *** refer to significant at P < 0.05, 0.01 and 0.001, respectively; ns means not significant.
However, significant differences were found between the main effects of the BCS groups for two traits, LT5 and DMJ12, showing higher values in the HBCS than in the LBCS group; 37.5 v. 27.0 cm2 in MS + C and 35.4 v. 26.8 cm2 in PS (P < 0.001) for the LT5 trait; and 16.0 v. 14.0 cm in MS+C and 15.4 v. 14.7 cm in PS (P < 0.01) for the DMJ12 trait. These differences could be accounted for a higher initial corporal condition and body weight in the HBCS animals compared with the LBCS animals.
Correlation coefficients: animal live, carcasses and sampling pieces
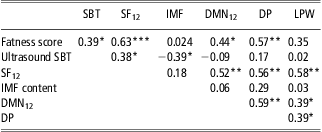
Simple Pearson's correlation coefficients among several animal, carcass and sample piece measurements (SBT, FS, DP, SF12, LPW, DMN12 and IMF) are summarised in Table 6. The ultrasound live animal measurement on the 12th thoracic vertebrae for determination of the SBT was positively related to the carcass classification score (FS; r = 0.39, P < 0.05) and the subcutaneous fat at 12th rib carcass measurement (SF12) (r = 0.38, P < 0.05) and negatively related to the IMF content (r = −0.39, P < 0.05).
Pearson's correlation coefficients among several characteristics of carcasses in HF cull dairy cows

HF = Holstein–Friesian; SBT = subcutaneous backfat thickness; SF12 = subcutaneous fat thickness 12th rib; IMF = intramuscular fat; DMN12 = minor diameter 12th rib; DP = dressing percentage; LPW = loin piece weight.
§Symbols *, **, *** refer to significant at P < 0.1, 0.05, 0.01 and 0.001, respectively.
The SF12 trait showed the highest number of significant correlation coefficients and the strongest correlation with the other traits, such as with FS (r = 0.63, P < 0.001), minor diameter of the 12th rib (DMN12; r = 0.52, P < 0.01), DP(r = 0.56, P < 0.01), LPW; r = 0.58, P < 0.01), and the SBT as mentioned above.
No significant correlation coefficients were found between IMF content and carcass traits (FS, SF12, DMN12, DP, LPW), likely because these correlations involve measurements from different types of fat (i.e. intramuscular and subcutaneous). The negative correlation coefficient between IMF and SBT can also be explained by the same argument.
Discussion
Duration and feed intake of the FP
The duration of the FP was estimated for the different BCS groups of animals (Table 2) and was determined by the speed at which individual cows achieved the required BCS (Minchin et al., Reference Minchin, Buckley, Kenny, Monahan, Shalloo and O'Donovan2010). Large differences were found between the BCS groups for the length of the FP, which can be explained because all animals were slaughtered when they reached the same fattened body condition, using as predictor the recorded ultrasound SBT (Table 3), as showed by Indurain et al. (Reference Indurain, Carr, Goñi, Insausti and Beriain2009).
The different lengths of the feeding periods between the BCS groups also determined significant differences in the amount of diet intake for the different feeds (pastone, hay, maize silage and concentrate). A period shorter than 4.5 months (HBCS animals in Table 2) may not be enough to accomplish the aimed fat body condition, because adaptation to energy-dense diets may take as much as 50% of the feeding period and the DM intake may be low with conventional ad libitum adaptation strategies (Matulis et al.,Reference Matulis, McKeith, Faulkner, Berger and George1987).
TFI was computed for the different groups of animals (Table 2). The highest TFI value was found in LBCS animals, finished on an MS+C diet. The TFI mean effect was higher in animals fed with MS+C than those fed with pastone in agreement with Minchin et al. (Reference Minchin, Buckley, Kenny, Monahan, Shalloo and O'Donovan2010) who also found higher TFI in the group of animals finished with concentrate. Significant differences were found in TFI between the groups of BCS animals. Cows with an initial LBCS needed to be fed for a longer period (2.5 months more) to achieve the target carcass CS, which resulted in an increase in their net energy intake of 1.3 t DM/cow in comparison with HBCS animals.
Animal live recording characteristics
The ILW values for the different groups of CS were indicated in Table 3, and these significant differences are related to the initial assignation of animals to the two BCS groups of animals. The HBCS animals classified with a CS > 5 (HBCS; Richards et al., Reference Richards, Spitzer and Warner1986) had a higher ILW than the LBCS animals. As planned, no significant differences between both BCS groups were found at the end of the experiment for LW, because the aim was to achieve an adequate and similar fattened body condition ⩾‘O’ and ‘4’, for conformation and fatness, respectively.
Gain efficiency patterns were reflected in ADG values (Sawyer et al., Reference Sawyer, Mathis and Davis2004), which can be related to daily energy intake. The significant difference between the two high-energy forage finishing diets (Table 3) for ADG can be explained because the MS+C treatment supplied higher energy intake than the PS treatment, as result of a higher daily DM feed and UFL intakes (Table 2). Sawyer et al. (Reference Sawyer, Mathis and Davis2004) showed that different management feeding strategies in cull cows had a significant effect on ADG response. Minchin et al. (Reference Minchin, Buckley, Kenny, Monahan, Shalloo and O'Donovan2009) reported ADG of 1.15 kg/cow for cull cows offered grass silage and 9 kg concentrate/day for the entire fattening period. In our study (Table 3), the performance of the higher energy diet (maize silage and 3 kg/day of concentrate) showed 1.04 kg/day per cow of ADG. Previous studies have shown that Holstein cows finished on a higher energy diet gained up to 1.43 kg/day (Jones and Macleod, Reference Jones and Macleod1981). The length of the FP did not affect the ADG in cull dairy cows finished during periods shorter than 4 months (Vestergaard et al., Reference Vestergaard, Madsen, Bligaard, Bredahl, Rasmussen and Andersen2007); however, other authors reported a decreasing ADG after longer fattening periods, especially with high concentrate feeding (Malterre et al., Reference Malterre, Robelin, Agabriel and Bordes1989).
Carcass traits and measurements
Results of Minchin et al. (Reference Minchin, Buckley, Kenny, Monahan, Shalloo and O'Donovan2009) showed that carcass trait differences were non-existent irrespective of the diet offered, provided that finishing criteria were set up at given carcass conformation and fat scores, and cows were fed during the necessary time to meet these criteria. Similarly, carcass characteristics (HCW, CCW, FS, CS, CL, LL, LT, DP, CCI, LTLI, SF12, GR) were not affected by dietary treatments in the present study (Table 4), which agrees with Juniper et al. (Reference Juniper, Aikman, Green and Phipps2006).
Feeding treatments had no effect on DP values (Table 4). This agrees with other studies that reported no effect of varying diet concentrate level on DP of cull cows (Minchin et al., Reference Minchin, Buckley, Kenny, Monahan, Shalloo and O'Donovan2009). Differences in DP were associated with higher carcass conformation (Keane and Allen, Reference Keane and Allen1998); however, no differences in DP between BCS group of animals were found in our study (Table 4).
Some studies (Minchin et al., Reference Minchin, Buckley, Kenny, Monahan, Shalloo and O'Donovan2009) have shown that less intensive finishing treatments compared with more intensive treatments yielded similar overall performance and carcass characteristics; however, days to slaughter were different. In our study, animals under the PS treatment needed an average of 34 more days for reaching similar carcass characteristics than animals under the MS+C treatment, although this difference was not significant (Table 2). Generally, this and other experiments support the fact that duration of the FP is important for the relative effect on muscle v. fat deposition (Vestergaard et al., Reference Vestergaard, Madsen, Bligaard, Bredahl, Rasmussen and Andersen2007).
Correlation analyses: animal live and carcass characteristics
Our results (Table 6) showed a significant correlation (r = 0.38, P < 0.05) between the ultrasound live animal measurement on the 12th thoracic vertebrae (SBT) and the subcutaneous fat at the 12th rib carcass measurement (SF12). However, higher correlation coefficients between carcass and ultrasound measurement of the 12th rib (SBT and SF12) were shown by Bullock et al. (Reference Bullock, Bertrand, Benyshek, Williams and Lust1991; r = 0.79), Brethour (Reference Brethour1992; r = 0.9) and Greiner et al. (Reference Greiner, Rouse, Wilson, Cundiff and Wheeler2003; r = 0.86) in beef cattle. Our predicted SBT average values were lower than the SF12 values (1.1 v. 1.6 cm, respectively; Tables 3 and 4), in accordance with the results from Greiner et al. (Reference Greiner, Rouse, Wilson, Cundiff and Wheeler2003) study. Some studies reported an average absolute low difference between ultrasound and carcass measurement in the 12th rib fat (SBT and SF12) for steers, such as 0.16 cm (Greiner et al., Reference Greiner, Rouse, Wilson, Cundiff and Wheeler2003) and 0.19 cm (Brethour, Reference Brethour1992). However, our results showed averaged differences of 0.5 cm for cull dairy cows, likely because the magnitude of the differences between SF12 and SBT increases as SF12 increases (Brethour, Reference Brethour1992; Greiner et al., Reference Greiner, Rouse, Wilson, Cundiff and Wheeler2003). SF12 and SBT determined the subcutaneous fat thickness on the 12th rib by different methods. It should be considered that graders from the Official Carcass Classification Score for fatness, that is, FS, focused most of their attention on the subcutaneous fat rather than in an accurate assessment of other fatness parameters (Indurain et al., Reference Indurain, Carr, Goñi, Insausti and Beriain2009). Therefore, these three characteristics (FS, SF12 and SBT) are related among them because they are considered different estimators of the subcutaneous fat accumulated on the carcass.
No significant correlation coefficients were found between the IMF content and the two carcass traits FS and SF12 (Table 6), which agrees with Indurain et al. (Reference Indurain, Carr, Goñi, Insausti and Beriain2009) who showed a no significant and low r-value (r = 0.292) when studying the carcass fat grade, that is, FS, and the IMF chemical determination. The lack of correlation between these two fat estimators can be explained because their fat estimates are taken from different parts of the carcass.
Conclusions
Animals with a higher corporal condition score had a greater potential to respond to finishing diets, because they need a smaller TFI (kg DM/cow) and a shorter FP. The averaged feed budget necessary to finish cull dairy cows with minimum scores ‘O’ and ‘4’ for carcass classifications regardless of dietary treatments was 3.61 and 2.31 t DM/cow for LBCS and HBCS animals, respectively. The offer of a lower energy finishing diet significantly reduced ADG but not days to slaughter; however, the offer of a higher energy diet may increase feed budget costs because of unstable concentrate prices. No differences were found between diets for carcass characteristics, and loin muscle features, such as weight, diameter and IMF, provided that the planned finishing criteria were met. Results from this study indicate that ultrasound measurements of fat thickness in live animals can fairly predict the slaughter time when the intended carcass fatness and conformation are reached. Thus, ultrasound techniques can be used for selection and management decisions when finishing cull cows.
The data generated provided valuable information on which to base the strategy for feeding cull dairy cows depending on animal corporal condition, expected FP and energy content of available diets. However, the initial variability of factors affecting the culling and the own animal characteristics could be a problem in identifying cows that have the potential either for undergoing a finishing feeding period or for being slaughtered immediately. Further research should be conducted on this subject.
Acknowledgements
Research partially funded by the project 07MRU001CT of the Consellería de Investigación, Desarrollo e Innovación from Xunta de Galicia, Spain. The authors are grateful to J. M. Barbeito, F. Piñeiro, R. López and M. A. Vilasuso for the farm managing work; to S. Carracedo, E. Rodríguez and S. Castro for their assistance in the laboratory activities; to C. Bragado and A. Escariz for the factory carcasses assistance; to J. Moreno-González for critical reading of the manuscript.