



1. INTRODUCTION
Income inequality is at the center of many debates. Political power, economic development or taxation are all related to the distribution of resources in any given country — or the world. This study takes a dynamic national perspective and investigates how inequality changed during a period of transition from dictatorship to democracy.
The contribution of the paper is twofold. On the one hand, it is inserted in the debate about the distributional consequences of political transitions, providing an example where income inequality did not substantially decrease after democratisation. Second, it does so by applying a correction methodology to the main historical source, namely the Household Budget Surveys, which leads to results challenging the prior consensus.
The literature on income distribution has undertaken many changes in the last decades. After the popularisation of Kuznets’s (Reference Kuznets1955) theory about structural change and the decrease in inequality in advanced industrial countries, recent work has indicated a new upsurgeFootnote 1 . Among its causes, globalisation and skill-biased technological change hold pre-eminent places (Atkinson Reference Atkinson2000; Krugman Reference Krugman2000; Easterly Reference Easterly2004). The slowdown of economic growth after the oil crises and the rise of unemployment could also have played a role in certain contexts.
This phenomenon, however, cannot be analysed as a purely economic issue. On the contrary, it is connected to political developments, such as the present rise of neo-liberalism and the deep crisis in social democracy in post-industrial societies. Levy and Temin (Reference Levy and Temin2007) argue that the widening of income inequality in the United States since 1980 is largely related to the institutional context, which is shaped politically. Labour market regulation, the education system and fiscal redistribution all have strong distributive effects, as has also been underlined by Piketty (Reference Piketty2003) for the latter.
In this context, transitions from dictatorship to democracy are expected to bring about a decrease in income inequality, as a result of the increased influence of the distributive goals of lower classes (Meltzer and Richard Reference Meltzer and Richard1981 and related literature). However, as Acemoglu et al. (Reference Acemoglu, Naidu, Restrepo and Robinson2013) note, the issue of transition might be complex and nuanced: the new regime can be «captured» by the elites and not result in fully democratic policies, and it can also lead to economic liberalisation and increased market inequalities.
The Spanish transition (1976-1982) is an interesting example for this discussion. Democratisation came when the oil crises hit the country, and the early period of the new regime was marked by industrial restructuring and international integration, as well as by an unprecedented and dramatic increase in unemployment. The intensification of structural transformation and the development of welfare-state functions brought about by the ascent of social democracy to power could have pushed the income distribution in different directions. So which force prevailed? Was democratisation a strong enough driver for equality?
Generally, studies on Spanish income inequality for the period 1970-1990 have found that differences between the poor and the rich shrank very substantially (e.g. Alcaide Reference Alcaide2000; Ayala et al. Reference Ayala, Jurado and Pedraja2006). This result is consistent with a positive impact of the political transition and the subsequent development of the welfare state in the country. This work, however, reaches different conclusions.
The main data source for the income distribution in this period are the Household Budget Surveys. These suffer from a widely known problem of under-reporting of earnings, particularly those coming from self-employment and capital, which can potentially bring about a misrepresentation of the real levels of inequalityFootnote 2 . I address the issue with an upwards correction of household incomes by revenue sources, using both internal and external information, and ultimately adjusting the flows to the National Accounts. Similar approaches have been widespread in Latin American studies (ECLAC 1991; Engel et al. Reference Engel, Galetovic and Raddatz1999; Barreix et al. Reference Barreix, Bès and Roca2009), and have also been recently applied by an extensive literature focusing on inequality measurement issues in several rich countries (Accardo et al. Reference Accardo, Bellamy, Consales, Fesseau, Laidier and Raymaud2009; McColl et al. Reference McColl, Billing, Kindermann and Burgess2010; Neri and Zizza Reference Neri and Zizza2010; Fixler and Johnson Reference Fixler and Johnson2012)Footnote 3 . The majority of these works, however, are very recent and focus on the latest years available. This paper takes a step forward by adopting a historical perspective and measuring the inequality trend over several decades.
After scaling up the income data, I find inequality to be higher than in the original data, and to have experienced only a slight decrease in the transition from dictatorship to democracy. This suggests that, in Spain, the democratic transition was not sufficiently strong to impact positively on distributional dynamics. It also implies that under-reporting has to be taken into account in the study of income distribution and its changes over time. Differential rates of income concealing by source will not only mean higher inequality than that directly observed, but may also affect its trend, fundamentally in the presence of significant changes in the factorial distribution.
The rest of the paper is organised as follows. Section 2 discusses the procedures and conclusions of previous literature on the topic, while also presenting the main data source used, the Household Budget Surveys. The methodology and process of correction of the data are presented in section 3, and the results and some of their implications are reported in section 4. Section 5 concludes.
2. THE STORY OF PERSONAL INCOME EQUALISATION
Literature has shown a widespread consensus on the fact that inequality decreased very substantially in Spain between the 1970s and the 1990s. This has been related to structural economic change and to an increase in the redistributive role played by the state in the second half of the period, due to democratisation.
These studies are generally derived from the Household Budget Surveys (henceforth HBSs): consumption and income investigations conducted by the National Statistical Institute (INE, from now on) more or less on a 10-year basis since 1964Footnote 4 . They provide information on socio-economic classes, total household disposable income and expenditure in different categories of goods and services. The detail and quantity of information have improved over time. Estimations of home consumption and imputed income from owner-occupied housing are also provided (thus indicating if the family rents or owns their house), as are the households’ size and some information on their age composition. The income data always refer to disposable income, so each component is net of direct taxes: this is also the definition used throughout this paper.
There are significant differences in the results obtained from this source. Some studies use the original income data provided by the surveys, while others rely on different correction procedures, since some troubling problems are widely known to be present in the HBSs. I will first review the results based on the original data and then proceed to discuss the quality issues in the surveys. Finally, I will show the corrections proposed by previous literature.
2.1 Working with the Raw HBS Data
The studies which use the raw HBS data are surveyed in Table 1. They observe a significant reduction of inequality through these decades, attaining levels comparable to those of other developed European countries by 1990. Many of these studies acknowledge the problems in the data, such as under-reporting, and therefore call for caution or test for possible impacts with techniques such as trimming (Cowell et al. Reference Cowell, Litchfield and Mercader-Prats1999) or a comparison with National Accounts (Oliver et al. Reference Oliver, Ramos and Raymond-Barà2001).
INCOME INEQUALITY IN STUDIES USING THE RAW HBSs

Notes: 1Oliver et al. (Reference Oliver, Ramos and Raymond-Barà2001)’s source is a different survey (Encuesta Continua de Presupuestos Familiares) which was initiated in 1985. The value for that year is introduced in the 1980 column in the table.
2Income definition: TDI is Total Disposable Income, MDI is Monetary Disposable Income, MDOI includes only ordinary revenues.
3Equivalence scales: SR means square root of household size, B(0.5) Buhmann et al. (Reference Buhmann1988)’s scale with elasticity of 0.5, «no» means total household income is used with no adjustment, «per capita» involves dividing it by real household size.
4Weighting: I stands for individual, H for household.
Source: References in column 1.
The values of the inequality indices vary depending on each author’s methodological choices, such as the income definition, the equivalence scale applied, or the weighting unit. All these are important conceptual decisions to be made by the researcher. I deem preferable an income definition as wide as possible (TDI in the table, which includes in kind elements such as imputed owner-occupier income — but, we should remember, excludes direct taxation), and individual weighting. This last aspect may not have a large quantitative impact on the indices, but implies giving the same value in our calculations to all individuals (while weighting by households effectively means attaching less importance to those living in large families). In any case, these choices do not change the qualitative result here: a decrease in inequality along with the political transition.
Alternatively, many authors are interested in working with inequality of consumption instead of income, or along with it (e.g. Del Río and Ruiz-Castillo Reference Del Río and Ruiz-Castillo1996; Martín-Guzmán et al. Reference Martín-Guzmán1996; Goerlich and Mas Reference Goerlich and Mas2001; Gradín Reference Gradín2002; Gradín et al. Reference Gradín, Cantó and Del Río2008). They generally also find a decrease in inequality during the decades of 1970-1990Footnote 5 . The rationale for this approach is that, in the context of the life-cycle and permanent income theory, consumption is a better indicator of welfare. An excellent survey of the debate is provided by Gradín et al. (Reference Gradín, Cantó and Del Río2008), who compare the results of using income or consumption. Morelli et al. (Reference Morelli, Smeeding and Thompson2015) argue that income is conceptually a better indicator, since it measures potential consumption and therefore does not lead to the confusion of need with chosen frugality (following Sen Reference Sen1992), and because current consumption may not mirror permanent income in the presence of obstacles to lifetime smoothing (especially borrowing constraints)Footnote 6 .
The use of consumption can also arise from the acknowledgement that income is under-assessed, and therefore reported consumption would actually be closer to real income than the stated revenue amounts. Expenditure data are not free of measurement issues, such as the difficulty of capturing consumption of durable goods correctly. However, income is truly known to be under-estimated in many surveys, and remarkably in our case. I turn to this now.
2.2 Biases in the Sources
The quality of the HBSs data is highly uneven. There are no micro-data available for the 1964-1965 survey, so it is only possible to work with aggregate results published by the INE. In the other cases (1973-1974, 1980-1981 and 1990-1991)Footnote 7 , micro-data are available on-line. In this work, I am using the files provided by Carlos III University, which undertook a project to facilitate their usageFootnote 8 .
Several issues on the reliability of HBSs (and that of their counterparts in other countries) have been put forward by the literature, starting with the publications of the INE itself. As may be seen in Table 2, household surveys underestimate inequality for a number of reasons. Some of them seem more worrying than others: the exclusion of the homeless might be insurmountable, but its quantitative impact is limited. Undistributed profits can be considered as part of the economic capacity of the individuals they accrue to, but may be left aside from an annual income analysis (as is indeed most common in the literature)Footnote 9 .
BIASES IN THE HOUSEHOLD BUDGET SURVEYS
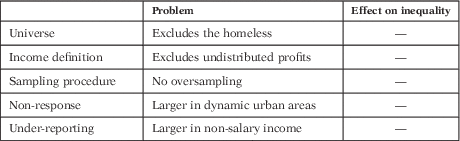
Source: Compiled with information in Garde et al. (Reference Garde, Martínez and Ruiz-Huerta1996).
The remaining issues appear more troubling. Oversampling the higher-income strata (urban areas with wealthy inhabitants) would have helped to provide better estimates of income for rich families, since the variability among them is usually higher (this is a common method in modern statistics). On the other hand, non-response and under-reporting entail a likely under-representation of the rich both in quantity and income levels. Not correcting for these effects implies a potentially important bias. The problem is relatively common in this kind of survey, stemming from lack of accounting control in the families, hiding of income from informal activities, fear of tax inspection, and so on.
Trying to confront the issue, some statistical work was already undertaken during the 1970s. At least part of the unit non-response bias is corrected by the INE with the scaling-up factors provided with the results, which give higher population weights to observations in strata where unit non-response was more acuteFootnote 10 . However, under-reporting clearly remains an issueFootnote 11 . A simple comparison of the data on total income and total expenditure (plus net savings) tells us that something is wrong: only 30-40 per cent of the households spend less than their yearly income, while around 10 per cent would consume more than twice its level (Table 3; see also the distribution disaggregated by decile in Appendix A).
HOUSEHOLDS AND BUDGET CONSTRAINT: DISTRIBUTION ACCORDING TO THE RATIO (EXPENDITURE+NET SAVINGS)/INCOME

Notes: Households in the first column spend within their budget constraint. A ratio of 2, for example, means that the family reported having spent twice as much as its yearly income.
Source: Calculated from Household Budget Surveys.
Certainly, not all families in a given year spend less than they earn, but the high ratios in the table seem implausible, especially given that total net household savings in those years were positive, according to the Spanish National Accounts.
In fact, another possible evidence of under-reporting is a comparison with National Accounts data, which are normally taken as a more reliable source for the aggregates. Disposable income totals are contrasted in Table 4 (a disaggregated comparison can be found in the tables of Appendix C). Disposable incomes in the surveys are only around 70 per cent of those estimated in national accounting for the household sector, which reinforces our suspicion that in the HBSs they are under-assessed to a considerable extent. The fact that this problem affects richer areas and non-salary income to a greater degree (as stated by, e.g., Alcaide and Alcaide Reference Alcaide and Alcaide1974 and Sanz Reference Sanz1995) should warn us against the use of these data without enough criticism. The under-estimation of incomes in the surveys seems more acute in the 1970s than in 1990, which could indicate an improvement in the accuracy of the source and therefore a non-homogeneous bias over time — thus affecting inter-temporal comparisonsFootnote 12 .
DISPOSABLE INCOME IN HBSS AND NATIONAL ACCOUNTS (MILLIONS OF NOMINAL PESETAS)

Sources: Author’s calculations and Pena Trapero (Reference Pena Trapero1996).
2.3 Literature with Correction of HBSs
The problems surveyed in the previous subsection were known by both the INE and the research community at the time. As a result, some corrections were attempted in the data. Table 5 displays the original distribution from the HBSs, together with the main adjusted estimates available.
DISTRIBUTION OF DISPOSABLE INCOME ACROSS DECILES (PERCENTAGE OVER TOTAL)2

Notes: 1Alcaide’s calculations for 1990 are based on a different survey, the ECPF, and therefore not strictly comparable to those of the HBS analysed here.
2The unit of analysis is the household and the income definition used corresponds to total disposable income (not per capita, not equivalised); except for Pena Trapero’s study, where it is income per capita. The Gini indices given in the cited studies are calculated out of the aggregated data, and thus underestimated with respect to those obtainable from micro-data.
Sources: Calculated on the basis of HBSs, Alcaide (Reference Alcaide2000), Instituto Nacional de Estadística (1977), Estruch (Reference Estruch1996) and Pena Trapero (Reference Pena Trapero1996).
The original distributions show a constant increase in the shares of the bottom five deciles, together with a decrease in the part accruing to the top (deciles 9-10). The Gini index corresponds to that given by Goerlich and Mas (Reference Goerlich and Mas2001) in their second row in Table 1. According to these data, the period of the democratic transition was very positive for the Spanish poor and middle classes.
The other columns in the table present distributions corrected for under-reporting with different procedures. J. Alcaide was the first researcher to tackle the issue, contemporaneously to the surveys. In Alcaide (Reference Alcaide2000) he showed an abrupt decrease in disposable income inequality starting at some point between 1973 and 1980, and continuing with less intensity in the following years. His corrections on the HBSs are based on the difference between total income and total expenditure data, taking the latter as more reliable (since they adjust better to the National Accounts and households may have felt less reluctant to report them). His first step thus consisted of an upwards adjustment of income to expenditure, with data aggregated by socio-economic groups, and he later scaled-up the corrected income figures to National AccountsFootnote 13 . These results have been widely accepted since. Table 5 shows that his procedure provided higher inequality figures than the raw HBSs data. Because the difference is much larger for 1973-1974, Alcaide’s calculations depict a more powerful retreat of inequality during the years of the political transition than in the following decade. Estruch (Reference Estruch1996) used a very similar methodology, applying it to the 1990-1991 data, in his work on public spending.
Alternatively, it can be accepted as economically normal that some households consume above their yearly income, up to a certain extent. Such an approach was taken by the INE’s study of the 1973-1974 survey, for the volume La Renta Nacional y su Distribución 1976 (Instituto Nacional de Estadística 1977): they accepted as «honest» those households where the difference between total expenditure (plus net savings) and income was not larger than 5 per centFootnote 14 . With those, a log-log relationship was estimated between consumption and income and used to correct the under-reported incomes. The result was also a more unequal distribution. The authors themselves considered it as a lower cap on inequality, since «honest» families were found mostly in the poorer deciles: if expenditure-income elasticity is not constant but decreasing, the concentration of income would be greater than estimated.
A similar procedure was applied by Pena Trapero (Reference Pena Trapero1996). They first obtained under-reporting correction factors by socio-economic categories, again derived from the relationship of declared income with consumption (ranging from 1.63 to 1.11). However, these were not applied directly on the total income of the household: 1.06 was assigned to salaries and 1.03 to public benefits, following the results in Díaz and Fernández (Reference Díaz and Fernández1993); which implies that the correction factors for other income sources resulted higher as a consequence. In a second step, they applied a uniform adjustment to the National AccountsFootnote 15 . Their result is also higher inequality than in the original surveys, with a lower reduction over time than the figure according to AlcaideFootnote 16 .
In the next section I present an alternative procedure to deal with income under-reporting, which leads to different conclusions.
3. ADJUSTING HOUSEHOLD SURVEYS
My methodology is similar to that of Alcaide and Pena Trapero in the basic intuitions; namely using income-expenditure discrepancy and scaling-up to National Accounts. However, the specific calculations differ, and so do the results. I first follow Pissarides and Weber (Reference Pissarides and Weber1989) and Martínez-López (Reference Martínez-López2012) to obtain the relative level of under-reporting of the self-employed, using only information from the surveys. Then I resort to comparison with National Accounts, but instead of employing the aggregate disposable income I make separate contrasts for the different sources of household revenue, as suggested by Oliver (Reference Oliver1997). This makes it possible to obtain particular adjustment factors and therefore a more realistic view of the distribution.
3.1 Relative Under-Reporting of the Self-Employed
It is widely believed that the self-employed under-report their incomes both in tax assessments and income surveys. Pissarides and Weber (Reference Pissarides and Weber1989) were the first to suggest an estimation of this concealing of incomes by means of contrasting their expenditure levels (on food) with those of wage-earners in household surveys. Their idea was based on the basic assumptions of accurate reporting of: (a) the incomes of wage-earners and (b) the food expenditures of both kinds of households. The intuition is that wage-earners can more easily know their exact income (because of its regularity) and also have fewer tax-fraud incentives to hide it in a survey (since they have less capacity to evade anyway, given withholding at source). Expenditures are generally known to be better declared than income in household surveys, and especially in the case of food, with ratios near 90-100 per cent with respect to National Accounts.
Pissarides and Weber (Reference Pissarides and Weber1989) concluded for Britain in 1982 that incomes reported by the self-employed should be multiplied by a factor of 1.55 to obtain their true earnings. After them, a wide literature has undertaken similar calculations for other countries and time-periods, with some further methodological contributions (Lyssiotou et al. Reference Lyssiotou, Pashardes and Stengos2004; Johansson Reference Johansson2005; Engström and Holmlund Reference Engström and Holmlund2009; Tedds Reference Tedds2010; Martínez-López Reference Martínez-López2012; Hurst et al. Reference Hurst, Li and Pugsley2014). Here I follow Engström and Holmlund (Reference Engström and Holmlund2009), who calculated a factor of 1.30 for Sweden around the year 2000, and Martínez-López (Reference Martínez-López2012), who estimated 1.25 for Spain in 2006-2009. Martínez-López stressed that this coefficient was relative to the wage-earners’ own under-reporting rate — something which is important in the Spanish case and in a historical analysis, where salaried workers might not be completely reliable.
The procedure is based on the estimation of an Engel curve with the following form:
 $$\ln F=\alpha {\plus}\beta \ln Y^{D} {\plus}\gamma {\rm SE}{\plus}\delta {\rm Z}{\plus}{ u}$$
where F being declared food expenditure, α the subsistence level, Y D total declared income, SE a dummy for self-employed households (defined as those where at least the household head or the spouse is so), Z a vector of control variables (family size, town size, and so on), and u the error term. γ is expected to be positive, implying an apparent higher consumption of food among the self-employed, which is interpreted as income under-reporting. The idea can be seen in Figure 1, where γ would be the vertical difference between both regression lines, β the slope (estimated elasticity) and lnF* the log of reported food consumption by two households with the same real incomes Y R , but different reported incomes Y D .
PISSARIDES-WEBER’S MODEL Source: Adapted from Engström and Holmlund (Reference Engström and Holmlund2009)

The difference between real income Y R and declared income Y D (in logs, horizontal distance between both vertical lines in the graph) is given by:
 $$\ln Y^{R} {\minus}\ln Y^{D} =\gamma /\beta $$
because of the formula to calculate the slope of the regression line in Figure 1
 $$(\beta =\gamma /(\ln Y^{R} {\minus}\ln Y^{D} ))$$
. Then we can further obtain:
 $$Y^{R} /Y^{D} ={\rm exp }\ (\gamma /\beta )=k$$
where k being the factor by which the self-employed person’s declared income should be multiplied in order to obtain their real income (under the assumption that the wage-earners’ reporting is correct — i.e. relative to it).
Food expenditure is used as the dependent variable for various reasons: it is one of the most accurately reported expenditures in the surveys (in terms of the adjustment with National Accounts of total resulting consumption), and we can safely assume that it is less affected by preferences than other goods. Rural households are excluded from the estimation, since they might obtain a significant part of their food supply outside the market and not report it correctly. The variable F is defined as expenditure on food (excluding alcohol and tobacco) plus foodstuff self-supply and free meals provided by companies to their employees. It is thus supposed to capture total food consumption, except for meals at restaurants and similar establishments.
In order to make the results more robust, I have made an alternative estimation with energy consumption as the dependent variable. In the surveys, this item was requested as the last bill, so it could be easier to report correctly, without the need to note down and control purchases associated with food expenditure. It is also less affected by the issue of eating at the firm, outside home and so on. The energy consumption reported is only that of the household as a family: that is explicitly excluding expenditures associated with unincorporated businesses.
The results of the estimation are shown in Table 6. Taking the average k derived from both models, for each year, the self-employed would under-report their incomes by around 14-20 per cent more than the recipients of salary incomeFootnote 17 . This result could be applied directly to the data, estimating the effects of the under-reporting of the self-employed independently from the other issues identified (see Appendix B). The impact, however, is limited. In this paper, I prefer to retain this coefficient underlining its relative nature, to integrate it in the next exercise.
REGRESSION FOR RELATIVE UNDER-REPORTING OF THE SELF-EMPLOYED

Notes: Robust standard errors in parentheses. ***P<0.01, **P<0.05, *P<0.1.
Controls include: household size, age of household head, dummies for municipality size and survey seasonality, meals in restaurants in columns (1), (3) and (5), a dummy for cold climate in columns (2), (4) and (6), and a constant.
Source: See text.
3.2 Scaling-Up to National Accounts
The other source of correction is external information: a comparison of the totals for each type of income obtained from the surveys with those in National Accounts, which are considered more reliable for the aggregate results, and supposed to capture at least a part of the black economy. This micro-macro contrast of aggregates is a common and desirable practice, as stated by the Canberra Expert Group (2011). The step is common in the analysis of survey data in other countries, as can be seen, for instance, in ECLAC’s reports, Engel et al. (Reference Engel, Galetovic and Raddatz1999) and Barreix et al. (Reference Barreix, Bès and Roca2009).
Complete income accounts for households are available in the Spanish National Accounts since 1980 (the different economic flows are disaggregated by sectors, one of which is the households, together with private non-profit institutions). Data for 1973 are taken from Pena Trapero (Reference Pena Trapero1996), with the exception of capital incomes, which have been approximated using the percentage of dividend and interest income in «incomes from property and enterprise» in the household sector in 1969 and 1980 (the two closest available years)Footnote 18 .
There are some coverage differences between the surveys and the National Accounts data: namely, in the latter, households appear aggregated with Private Non-Profit Institutions, and they also include people living in collective arrangements (e.g. retirement homes), who are not present in the surveys. For an extensive discussion, see Sanz (Reference Sanz1995). These differences are considered minor and not dealt with hereFootnote 19 . The adjustment procedure needs to take into account that Household Surveys provide incomes net of taxes, while the figures in National Accounts are gross. The corresponding taxes have therefore been subtracted from the latter before calculating the relationship between magnitudes. Imputed incomes are not corrected, since they do not mostly derive from the respondents’ answers but were estimated by the INE; hence, they are also extracted a priori from both sourcesFootnote 20 . Scaling-up factors for each source of income have been calculated with the following formula:
 $$m_{i} =(X_{{i;{\rm NA}}} \,{\minus}\,I_{i} -T_{i} )/(X_{{i;{\rm HBS}}}\, -\,I_{i} )$$
with X i;NA meaning the gross amount in National Accounts, I i the imputed (non-monetary) incomes in category i if they exist, T i the associated taxes, and X i;HBS the net amount given by the Household Budget Survey. See Table 7 for the correspondence between magnitudes in both sources.
MATCHING HOUSEHOLD SURVEYS WITH NATIONAL ACCOUNTS

Sources: Compiled with information based on Sanz (Reference Sanz1995) and Pena Trapero (Reference Pena Trapero1996).
The general procedure, however, is modified for the cases of Net Operating Surplus (NOS) and Transfers. NOS includes self-employment monetary income, self-employment imputed income (not corrected) and income from real estate rentals. A total adjustment to National Accounts would be incorrect, since these include undistributed profits of unincorporated enterprises, which are not present in the surveys (see section 2.2): the procedure applied here yields a difference of around 20 per cent under total adjustment. It is based on the factor for self-employment obtained thanks to the Pissarides-Weber regressions in subsection 3.1: m SE is the product of the previously estimated k and the factor for Labour income (since the equation yielded under-estimation relative to wage-earners). The same coefficient has been applied to rental incomes, which form part of the same category in National AccountsFootnote 21 .
Regarding transfers, from the surveys of 1973 and 1980 it is only possible to obtain a joint correction factor for the total (which includes social benefits together with assorted private flows). However, applying this number to all households equally would underestimate inequality because benefits are better reported than the rest of transfers, and both kinds of revenue have very distinct distributions (as shown by the separate estimates for 1990). To account for this problem, I have used a different correction factor for each decile, based on the results in 1990. Since for this year the survey provides both variables, it is possible to obtain a different «general transfer factor» (total corrected transfers/total reported transfers) in each decile, the variation of which responds to the composition between private and public ones. The changing relation of this factor with the total m TR (1.65 in 1990) is used to generate variation in the factors to apply in 1980 and 1973. This means that the correction factor of transfers increases with incomeFootnote 22 .
The resulting scaling-up factors m i are shown in Table 8. As can be seen, they tend to decline over time, showing what seems to be the increasing reliability of the surveys.
CORRECTION FACTORS BY SOURCES OF INCOME

Notes: The table displays the factors m i , obtained with expression (4), which serve to scale-up the income data to the totals in National Accounts.
Source: See text.
However, this is not the case with capital income, which has the highest estimated factors (together with private transfers). This may be a reflection of structural and regulatory change. A decrease in capital income concentration could be accompanied by growing non-reporting: a rising number of households receiving small quantities of capital income and neglecting to include them in the surveys’ questionnairesFootnote 23 . On the other hand, the increase in the associated tax burden and financial sophistication could have implied increased covering-up of such incomesFootnote 24 .
The application of these coefficients to each type of income, at the micro-data level, yields a different compound correction factor to each household, as well as to every possible socio-economic sub-group, by composition effect. Table 9 shows the resulting factors by deciles. The profiles have a J-shape, being lower at the middle part of the distribution and attaining the highest values at the very top.
CORRECTION FACTORS BY DECILES (MEAN FACTOR APPLIED-WEIGHTED AVERAGE)

Note: Deciles are built on the corrected resulting disposable income.
Source: See text.
4. THE EVOLUTION OF THE SPANISH INCOME DISTRIBUTION (1973-1990): AN ALTERNATIVE PICTURE
The final outcome of the correction is a set of higher inequality estimates, compared with those resulting from the original INE data, as was originally expected. Table 10 displays the Gini indices obtained, following two different calculations. The first row shows inequality of disposable income across households, with no adjustment for household size and using them as the unit of analysis (thus giving the same importance in the estimation to a one-member household and to a six-member one); the second uses equivalent income and individual weights (i.e. each person is assigned the equivalent per capita income of its household and has the same importance in the estimation). The latter approach provides a better measure of inequality between individuals, but it requires some assumptions about the distribution of resources within the family and economies of scale in consumptionFootnote 25 . Unsurprisingly, inequality is lower between individuals than between households, because larger families tend to have higher aggregate incomesFootnote 26 .
SPANISH INCOME INEQUALITY (1973-1990) IN THE SCALED-UP DATA (GINI INDEX)

Note: Equivalent incomes are obtained using the OECD scale.
Source: Calculated from HBSs.
As can be seen, the correction of under-reporting also implies a change in the observed trend of inequality. While the unadjusted data and the corrections from previous literature reviewed earlier showed an abrupt improvement in the distribution over time, the new corrected incomes show a much smaller change over these decades (around 1.5 Gini points). We can thus talk about considerable persistence in inequality. This result contrasts with most of the literature presented in section 2, but is not necessarily at odds with studies based on tax or macroeconomic data, which are reviewed in Appendix F.
4.1 Relative Inequality and its Composition
The inspection of decile shares based on the corrected disposable income data allows a deeper analysis of the evolution of income distribution. In Table 11 inequality among households is shown to have been quite stable over these decades (consistent with the Gini indices in the first row of Table 10). Interpersonal inequality, which is approached by the distribution of equivalent income in columns 5-7, is slightly lower. In any case, the absence of a clear trend remains. The bottom-half deciles increased their share, but the changes are small and erratic.
SHARES OF DISPOSABLE INCOME ACROSS DECILES (PERCENTAGE)

Note: Equivalent incomes are obtained using the OECD scale.
Source: See text.
It is nonetheless most likely that the roots of inequality in the economy changed during these decades. The capital-labour ratio had been decreasing in the last years of the dictatorship as a short-term response to the crisis, and could have increased again later because of liberalisation. Most advanced industrial economies have experienced a recent increase in wage and salaries dispersion. These trends, together with the increase in unemployment, could have counteracted to some extent the equalising force of public benefits expansion and the introduction of progressivity in the tax systemFootnote 27 .
Entering such a debate in depth is beyond the scope of this paper, but the decomposition of disposable income in Figure 2 can provide an idea of the forces behind inequality change. Apart from wages, self-employment income, capital income and transfers, two kinds of imputed incomes are included. These are non-monetary flows accruing to households, that have been given an approximate value in the survey. «WE imputations» (those related to wage-earning activities) include in-kind compensation and meals at the workplace, while «SE imputations» (related to self-employment) are home consumption and housing services in owner-occupied housingFootnote 28 .
COMPOSITION OF DISPOSABLE INCOME Source: Calculated using sgini module for STATA by Philippe van Kerm.

Employment incomes were clearly the main components of disposable household resources but their share decreased over time (accounting each year for 53, 50 and 43 per cent, respectively). The items gaining weight were mainly transfers (due to the development of the welfare state: total transfers increased from 14 to 25 per cent) and capital income (from 4 to 7 per cent). Because capital income is concentrated at the top, while public benefits go mainly to the bottom, both changes could have counteracting effects on total inequality. Also self-employment imputations had a growing participation (from 7 to 13 per cent), mainly due to the imputed rentals from owner-occupied housing.
This general composition of disposable income is of course very variable along the social ladder, as can be seen in Figure 3. In the bottom deciles transfers and salary income make up most revenues. Social benefits and private transfers are, regrettably, not disaggregated in the 1973 and 1980 data, but the progressive nature of the former can be seen clearly in 1990. Wages have maximum participation in the middle deciles and self-employment income is somewhat skewed to the top in the first years. Revenues from capital are the most concentrated: almost absent in the lower classes, they constitute over 10 per cent of income for the upper decile and around 30 per cent for the top 1 per cent. This pattern is similar in other countries (e.g. Piketty Reference Piketty2003).
INCOME COMPOSITION BY DECILES Notes: In all cases incomes are equivalised by household size, using the OECD scaleSource: Calculated using sgini module for STATA by Philippe van Kerm.

Figure 4 plots inequality for each component of income, following the decomposition method originally developed by Lerman and Yitzhaki (Reference Lerman and Yitzhaki1985). It shows that employment incomes became slightly more concentrated over the period: wages and salaries went from 50.6 to 53.2 Gini points, and self-employment income from 84.1 to 86.5Footnote 29 . The element with the most uneven distribution is capital income (99-95 Gini points), the increasing participation of which also pulled up total inequality. These forces were offset by a more homogeneous distribution of SE imputations and transfers, income sources which, as we have seen, experienced substantial growth over the period.
GINI INDICES FOR COMPONENTS OF DISPOSABLE INCOME Notes: *In all cases incomes are equivalised by household size, using the OECD scale. «WE imp.» means imputed incomes from labour activity, while «SE imp.» refers to non-monetary self-employment incomes such as that from owneroccupied housing.Source: Calculated using sgini module for STATA by Philippe van Kerm.

4.2 Inequality in Levels
As we can see, the near stability of the Gini index does not imply the absence of several interesting distributive changes. A further image emerges if we take a look at the levels of income: in order to do so, Table 12 displays mean disposable per capita equivalent income by deciles, in constant 1990 pesetas. It makes it possible to observe that all deciles experienced an increase in their purchasing power during the periodFootnote 30 . The profiles of growth are however dissimilar in the two sub-periods: while during the seventies growth was higher at the lower-mid levels, in the nineties it was the extremes which benefited the most (pointing towards the expansion in welfare state transfers in the case of the low-income households). If we look at the top 1 per cent, we even find stagnation in the first sub-period (the oil crisis decade) and a very significant recovery in the second. The ratios in the last rows confirm the same impression of a weak decrease in economic distances.
LEVELS AND GROWTH OF DISPOSABLE EQUIVALENT INCOME

Notes: Deciles of individuals based on disposable per capita equivalent income, obtained with the OECD scale.
Sources: Calculated using GDP deflators from Prados de la Escosura (Reference Prados De La Escosura2003).
Let us recall that the Gini index and other related indicators measure relative inequality (i.e. independent from the scale: constant if all incomes are multiplied by the same factor). If absolute differences in income are also thought to be important, we can calculate an absolute Gini, which is the same index without normalisation to the mean (as put forward by Ravallion Reference Ravallion2003). Carrying out this exercise for the 3 years, we obtain an increase in the absolute inequality index of 24 per cent between 1973 and 1990. Relative economic distances did not change that much, but they did in absolute terms, in actual consumption capacityFootnote 31 .
5. CONCLUDING REMARKS
In this paper I have analysed the sources available for disposable income distribution in Spain during the years surrounding the transition to democracy. The main data come from the Household Budget Surveys conducted by the INE, which contain very rich information but need to be used with caution. It is widely known that they suffer from severe under-reporting — and, furthermore, that this is not homogeneous across income sources. Such a problem means that the under-estimation of incomes is not homogeneous across income levels, biasing the inequality indices readily obtained from the data.
I have performed a two-step correction procedure, trying to identify under-reporting first with an Engel’s curve approach (contrasting the self-employed with the wage-earners in their incomes and food/energy expenditure) and then with an aggregate adjustment to the magnitudes of the household sector given in National Accounts. The results allow us to question the conventional wisdom that inequality strongly diminished in Spain during these decades. The Gini indices of all surveys are pulled up by the correction and the trend across the years significantly weakens.
This leads directly to a further question. Did the transition to democracy not introduce significant distributive improvements? Political economy theory would expect from democracy an inclination to favour the lower classes (at least, relative to a right-wing dictatorship as Spain had recently suffered), via labour market regulation, welfare state benefits, and progressive taxation. We do witness an increase in the importance of transfers received by the households at the bottom of the distribution, reflecting welfare state development in the years after 1977. However, they did not outdo forces pulling in the opposite direction. The tax system did not become progressive, as pointed out by Torregrosa (Reference Torregrosa-Hetlandn.d.). The absolute gains from growth went mostly to the upper classes.
Economic growth and decline in inequality in the years after 1950 have been said to facilitate the transition in the 1970s. Prados de la Escosura (Reference Prados De La Escosura2008) interpreted in this way the elimination of absolute poverty and the growth of the middle class, which would have permitted the stabilisation of democracy, contrary to what happened in the interwar period. This evolution, however, does not seem to have gone much further. Liberalisation brought about new distributive forces, while in the context of general economic distress in Europe, the new political system did not turn out to disproportionately favour the less well-off. At least, it could not effectively counteract market forces towards growing inequality.
This is, of course, a political choice, reflecting the equilibrium between classes or interest groups in the young parliamentary state. In this sense, the lack of economic equalisation could be enlightening about the access to political power. Future work will explore the relationship between inequality and political transitions in a broader comparative context, with special attention to Latin American countries, which could provide valuable insights.
Appendices to «Sticky income inequality in the Spanish transition (1973-1990)»
Sara Torregrosa Hetland
A. HOUSEHOLDS AND BUDGET CONSTRAINT BY DECILES
Table A1 depicts the distribution of households according to the relation between their incomes and expenditures, extending the data shown in the main text by breaking down deciles of income. We already knew that the number of households spending more than they claimed to earn was decreasing as we moved to more recent surveys. Here, we can also see significant differences across the (reported) income distribution in each sample.
DISTRIBUTION ACCORDING TO THE RATIO (EXPENDITURE+NET SAVINGS)/INCOME

In all three surveys, the percentage of households spending less than or equal to their yearly income is increasing with income. This, of course, is not surprising since part of the explanation lies in the real behaviour of households with different economic means. In almost all deciles, however, the majority of households lie within the 1-2 interval.
Casual observation of this table leads to the conclusion that adjusting incomes to expenditures will bring up the revenues of the poor more than those of the rich (in percentage terms), leading to lower levels of inequality. To the extent that some households do spend more than their yearly income in a given year, and that households with positive savings are also under-reporting their earnings, such an adjustment can only be a small part of the solution and could even introduce additional biases.
B. EFFECTS OF ADJUSTING SELF-EMPLOYMENT EARNINGS EXCLUSIVELY
In this paper, the estimation of under-reporting of the self-employed à la Pissarides-Weber is part of a wider strategy, to obtain adjustment of all incomes to National Accounts. We can, however, ask ourselves what would be the result in terms of inequality of up-scaling earnings after this first under-reporting inquiry. This is shown in Table B1.
EFFECT OF CORRECTING ONLY THE UNDER-REPORTING OF THE SELF-EMPLOYED

The exercise has only a limited effect on the Gini indices, which are slightly increased (compare with the original data in the first columns of Table 5). This is because I apply here coefficients of 1.21, 1.26 and 1.17 (as resulting from Table 6, and significantly smaller than those applied in the adjustment to NA exercise, Table 8), and only to self-employment incomes, which are a limited part of the total (always under 25%).
C. DATA AGGREGATES COMPARISON
The following tables show the data involved in each calculation of scaling-up factors, following the scheme in Table 7 of the text. Note that m corresponds to the net definition (leaving imputations aside). The value for NOS is not applied in the up-scaling procedure (the results from Pissarides-Weber equation are used instead), as is explained in the text, because adjustment to the National Accounting framework in this flow should not be complete.
D. ROBUSTNESS: OTHER EQUIVALENCE SCALES AND INDICES
Only the preferred estimates are shown in the text, which use the Gini index and the OECD equivalence scale. Other indicators have been calculated, leading to similar results: higher inequality in up-scaled data, slight and erratic decrease over time.
E. ROBUSTNESS: ALTERNATIVE ADJUSTMENTS OF TRANSFERS
The up-scaling of transfers undertaken in the main estimation attempts to distinguish between private flows and public benefits. Both have been found to have significantly different reporting behaviour in the 1990 survey, which is the only one of the three where they are explicitly differentiated in the data. An approximation has been made in the previous years to the distinct profiles of compliance, based on those results. However, the procedure might introduce a significant level of uncertainty.
HBS AND NA HOUSEHOLD INCOME AGGREGATES, 1973

HBS AND NA HOUSEHOLD INCOME AGGREGATES, 1980

HBS AND NA HOUSEHOLD INCOME AGGREGATES, 1990

INCOME INEQUALITY ACCORDING TO OTHER EQUIVALENCE SCALES AND INDICES

In order to look more closely at the problem, I have performed two alternative calculations (see Table E1). The first does not correct transfer incomes at all, and thus leaves the original data for this component untouched, combining it with the other up-scaled incomes to obtain the total. The second procedure applies a uniform correction to all transfer income in all deciles (even for 1990, in order to establish the bias).
GINI INDICES UNDER ALTERNATIVE ADJUSTMENTS OF TRANSFER INCOME

As can be seen, generally the preferred calculation (Table 10) depicts intermediate levels of inequality with respect to the other alternatives presented here (no up-scaling generating higher levels, and uniform up-scaling resulting in lower levels). The exception is equivalent incomes in 1990, where our more precise estimate yields higher inequality than these ones. This could suggest that our approximation under-estimates the effect of this distinct behaviour of private transfers and public benefits, thus leading to inequality still being downward biased in the results. The implication, however, is dependant on the distribution of both components being homogeneous across the years, something unlikely given the development of the welfare state at the time.
F. COMPARING WITH OTHER APPROACHES TO SPANISH INEQUALITY
The results in this paper differ from those previously obtained using the survey data, because I estimate a higher level of inequality and a smaller decrease over time. This includes the studies reviewed in section 2, based on the HBSs, and also those which have used a different source, the Encuesta Continua de Presupuestos Familiares. This is a rotating household panel also provided by the INE, with quarterly data and households staying in the sample for a maximum of 2 years.
The ECPF consistently displays lower levels of inequality than the HBSs (EPFs). One reason for this might be that it suffers from a larger downward bias, because of sample size and the definition of income employed (notably excluding certain capital incomes). According to some reputable sources, this results in its low reliability for the study of inequality (Eurostat 1999; Goerlich and Mas Reference Goerlich and Mas2001). Its higher discrepancy with respect to National Accounts can be seen in Pou and Alegre (Reference Pou and Alegre2002).
For this reason, differences between my results and those of analyses based on the ECPF are to some extent not surprising. Both Oliver et al. (Reference Oliver, Ramos and Raymond-Barà2001) and Pijoan-Mas and Sánchez-Marcos (Reference Pijoan-Mas and Sánchez-Marcos2010), for example, provide an account of falling inequality between 1985 and 1996/2000, partially overlapping with the period analysed hereFootnote 32 . The differing trends, however, are not completely irreconcilable: in fact, a decrease in inequality in the second half of the 1980s could be compatible with general stability when the whole decade is considered (especially knowing that a whole cycle of recession and growth took place during the eighties, and rates of unemployment were similar at the beginning and the end of the decade, around 15%). Falling inequality in labour market revenues of household heads is also found for the entire decade in the HBSs by Abadie (1997) and in my scaled-up dataFootnote 33 .
My results can also be compared with studies on the evolution of inequality based on other kinds of data. Prados de la Escosura (Reference Prados De La Escosura2008) provided a long-run estimation based on a macroeconomic approach, calculating dispersion within and between the incomes of «workers» and «capitalists». His series show a rapid decrease in inequality in Spain between the mid-1950s and the mid 1960s, followed by a much slower diminishing trend since then and until the second half of the 1990s, when inequality would have started to go upwards again. The persistence I obtain is therefore quite consistent with Prados de la Escosura’s calculations.
For the post-transition period it is also possible to use income tax data and assess the evolution of inequality in taxable income. By definition, however, the levels and trend do not need to coincide with those of disposable income: between both lie direct taxes, transfers and the impact of fraud. There are also other methodological differences, discussed in Ayala and Onrubia (2001): generally, tax-based studies use the taxpayer as the unit of analysis (as opposed to the household, and without applying equivalence scales) and have different universes (given by the effective income threshold to personal direct taxation). This category of taxpayers was also changing over the years: new taxpayers were coming in because the tax was being introduced, and also as an effect of fiscal drag. All of this explains why tax data generally show a higher level of inequality than survey data, and a worsening in (reported taxable) income distribution during the eighties (e.g. Lambert and Ramos 1997; Ayala and Onrubia 2001). The study closest to our discussion is that by Onrubia et al. (2007), which includes calculations for the «fiscal household» (thus homogenising the periods before and after the introduction of the separate filing option for married couples). The pre-tax income Gini index (taxable base with some adjustments) was found to increase continuously from 1982 to 1991 (31.68-42.00).
Alvaredo and Saez (Reference Alvaredo and Saez2009) studied top income shares, obtaining the revenues from tax data and the population total (denominator) from National Accounts (therefore, their approach has the same comparability problems with my estimates, namely different income concept and no equivalisation). Their results show that the top 0.1% share was fairly constant over the 1960s and 1970s (around 1.87%), with concentration starting to increase in the second half of the eighties (2.14% in 1990)Footnote 34 . The same trend is shown in the share of the top 1% (7.5-8.37% in 1981 and 1990) and the top 10% (32.61-35.35% in the same years). It should come as no surprise that the figures are lower for disposable income: in my work, I obtain for the top 1% of households 6.47% in 1973, 6.03% in 1980 and 7.15% in 1990. Nevertheless, the increasing concentration in the last years is seen in both shources.



