Introduction
Traditional tillage practices use a whole field approach in which the tillage effect is applied uniformly across the whole field. Management decisions on which tillage machinery to use and how deep to operate it at are usually decided on historical management or occasionally based on information derived from a soil profile inspection. This universal approach is attractive to growers because it requires little specialist knowledge of the soil, therefore often relying on cultivator design to achieve a satisfactory result.
There are several disadvantages to this approach. Firstly from an economic perspective, disturbing the soil unnecessarily in areas where the soil structure and condition is not required is wasteful of time and fuel (Keskin et al., Reference Keskin, Khalilian, Han and Dodd2011). Secondly, incorrect tillage depth can cause damage to the soil structure by smearing wet plastic soil (Gill and Vandenberg 1965). This problem can lead to the formation of an impervious layer, restricting the development of plants roots, negatively impacting on yield. Finally inappropriate tillage may lead the soil to be susceptible to erosion where nutrients are not retained in the soil but are lost to the environment through leaching and runoff (Halcro Reference Halcro2013). An alternative approach to traditional tillage is variable depth tillage (VDT) (Fulton et al., 1996).
VDT requires the state of the soil to be measured through the profile, in advance of tillage or on-the-go, to determine the optimum tillage depth spatially (Adamchuk et al., 2004). Utilising VDT has both physical benefits to the soil, in terms of preventing tillage damage to the soil profile (Gill and Vandenberg 1965) and economic benefits to the grower by optimising fuel consumption (Keskin et al., Reference Keskin, Khalilian, Han and Dodd2011). The objective of this research was to develop a new soil compaction measurement system which utilised a multisensory data fusion approach to determine the extent of VDT treatment zones spatially and with depth.
Materials and Methods
A 2.43 ha agricultural field, situated in Lincolnshire, UK was selected as the research site. The organic clay site is part of a cereal and root crop rotation, which is typical of the area. At the time of the study the field was fallow and had not been cultivated. To conduct the experiment an area 90×270 m area was divided into 243, 10×10 m grid squares. At the centre of each grid square a hydraulic penetrometer was used to measure the soil resistance, every 20 mm, down to 450 mm. Two depth ECa data was collected using both HCP & PRP arrays from a DUALEM 1 S instrument (Dualem, Inc., Milton, ON, Canada) along 10 m transects which intersected each penetrometer point.
It was not economically feasible to take soil samples from each of the 243 penetrometer sample points. Therefore the number of samples and their location was determined from homogeneous zones derived from the ECa. Using a GPS device (NOMAD, Trimble, USA), pre-loaded with the interpolated ECa plan, four sample sites were identified to collect bulk density (BD) and soil moisture (MC). A further three sites were selected to collect samples for particle size distribution analysis, thereby determining clay content (CC) of each homogeneous zone.
Bulk density and soil moisture samples by depth were collected using the Kopecky ring method. At each sample location a 5 cm deep ring was hammered into the ground collecting 100 cc of soil per sample. In total 8 undisturbed soil samples were taken sequentially every 5 cm down the profile. For the clay content three soil pits (50 cm×50 cm×50 cm) were manually excavated. From the side of each of pits, 4×10 cm samples of soil were carefully removed. Soil moisture content of the soil was determined by drying the soil samples in an oven at 105°C for a minimum of 24 hours (BS 7755, 1994). The moisture content measurement was deduced by calculating the difference between the mass of the wet samples and the samples after drying. Bulk density was determined by subtracting the dry weight values from the moisture content analysis and dividing them by the volume (100 cm3) of the soil core. Percentage clay content was determined using a sieve and sedimentation method according to BS 7755 section 5.4 (BSI, 1998).
Data Fusion
Each measured soil property was interpolated using inverse distance weighting (IDW) and then transformed into a common 10 m raster using Manifold GIS (Manifold Software Ltd, Wanchai, HK). The raster squares of the soil property layer were then converted into a grid of common points by spatially joining the mid-point of each raster square. The output from this process was a 10 m grid of point values.
Multivariate clustering
To determine the spatial extent of VDT zones within the field, both of the physical and proximal soil measurements for each depth layer were clustered into three groups using the k-means algorithm within STATISTICA 12 (Statsoft. Inc. OK, USA).The newly delineated clusters were plotted for the 8 individual soil layers using a nearest neighbour interpolation.
Packing Density
Bulk density measurements are sensitive to changes in soil texture making it unsuitable as a measure of compaction for VDT where soil texture is expected to change significantly in a short distance across the field and through the soil profile. Overcoming this limitation is therefore important and can be achieved by adopting the packing density of the soil instead of the bulk density. By extrapolating the appropriate clay content (CC) values, according to ECa, across all 243 grid nodes then transforming the bulk density value into a clay independent indicator by adding a correction term given as the product of clay content with the slope of the regression lines, the packing density was derived for each 5 cm depth layer (Kaufmann Reference Kaufmann2008) using the following equation.
 $${\rm Packing\ density =BD\, \plus \,(0.009\,\times \,CC)}$$
where - PD is packing density, bulk density is bulk density (g/cm3) and 0.009 CC is the correction term given as a product of clay content clay content with the slope of the regression lines (Renger Reference Renger1970).
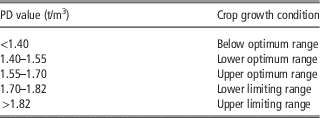
Determining the need for tillage and more specifically the depth of tillage was decided based on the effect of packing density values on crop growth. In this work values≥1.7 t/m3 were used to determine the need for variable depth tillage.
VDT plan
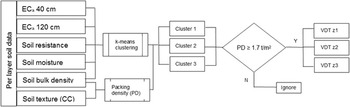
A three zone VDT plan was developed by filtering each cluster with the packing density classifications from table 1. Values of packing density ≤ 1.7 t/m3 were ignored as no tillage required and values≥1.7 t/m3 were recorded and allocated a VDT zone by layer (Figure 1).
Scheme illustrating VDT plan logic by layer.

Packing density classifications for crop growth (Kaufmann Reference Kaufmann2008)

Results
Analysis of site parameters
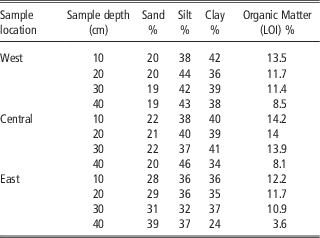
Analysis of the soil texture and organic matter (OM) were taken at three locations across the site and revealed a predominately clay texture to the west of the site with an increasing sand fraction to the east (Table 2). As is typical for the area, there was a high OM range of 10.9% to 14.2% in the top 35 cm of the soil profile. A noticeable reduction of OM was observed at 40 cm where the subsoil layer began.
Particle size distribution analysis results by sample location and depth interval.

Apparent ECa
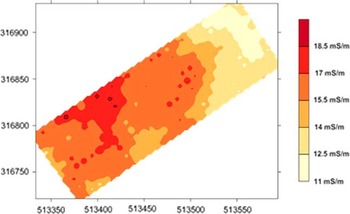
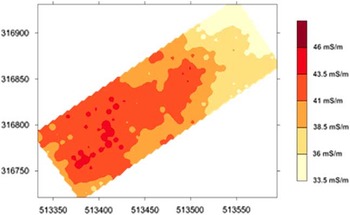
The measures ECa values corresponded with the soil texture analysis with the higher EC values being observed in the west of the site and the lowest values in the east here the sand content increased between 10–20% (Figure 2, 3).
Spatial variation of ECa at 0–40 cm.

Spatial variation of ECa at 0–120 cm.

Multivariate k-means clustering
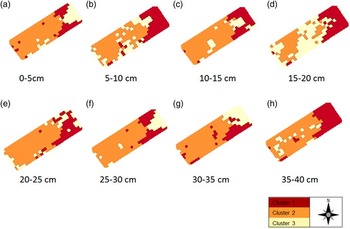
Using only three clusters, the pattern of variation is very distinct (Figure 4). Underlying trends of soil type are evident. Cluster 1 on the eastern side of the site, has an increased sand fraction when compared to the higher clay content soil on the western side which visually compares very well with the ECa results. Cluster 3 demonstrated the most spatial variation across all depths.
Visualisations of the spatial extent of each tillage zone cluster created using nearest neighbour interpolation.

In the 0–5 cm and 5–10 cm there was a distinct change in cluster location from the small triangular area at the eastern extent 0-5 cm manifesting itself in a more general way at 5–10 cm. This was caused by the reducing bulk density values between a shallow layer of surface compaction and the looser soil just below. Cluster 3 has the most significant change in spatial extent occurring at 20 cm which was a result of the close alignment of normalised means of penetration resistance, bulk density and moisture content variables. Initially the map looked like a layer of compaction but this was discounted by the low bulk density means. A possible reason behind the spatial extent is the wide range of bulk density and penetration resistance values indicated a transient layer between the regularly cultivated surface and the less frequently cultivated subsoil. Below the 20 cm layer the clusters are spatially more stable, adding further evidence that 20 cm is a transient layer.
Derivation of packing density
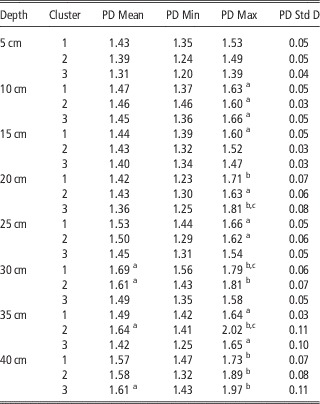
According to the packing density classes in Table 1, values of packing density≥1.7 t/m3 were deemed to be yield and root growth limiting and tillage should be carried out. Results shown in Table 3 illustrate the overall packing density range across the soil profile extends from 1.20 to 2.02. However, this range can be further sub-divided between values above 25 cm, mean packing density of 1.45–1.53 t/m3, and below 30 cm, mean packing density range of 1.49–1.69 t/m3. The reason for this stepped increase in packing density between the these two observed layers can be attributed to historical tillage practices where ploughing for root crops would often extend down to 25 cm, regularly disturbing the upper soil and potentially compacting the deeper sub soil with large vertical and shear forces. Typically if a grower had identified a compacted layer like this he would look to remediate it with homogeneous deep tillage, which is an expensive and time consuming operation (Mouazen and Neményi, Reference Mouazen and Nemenyi1999). However with this approach of packing density cluster analysis it is possible to identify areas below 30 cm that do not require deep tillage offering the potential to reduce tillage depth saving money and resources. Examining the maximum packing density calculated per cluster in Table 3 reveals that values exceeding 1.6 t/m3 already appear on the top layer of 5–10 cm deep, indicating the presence of surface compaction, and suggesting a gentle surface tillage to be considered down to 10 cm in the entire field. After this layer another layer but with critical values on crop growth can be observed at 15-20 cm layer in cluster 1 & 3, suggesting tillage of these two clusters only, whereas no tillage is needed for cluster 2. Going further down in the profile, one can observe the presence of hard pan at cluster 1 and 2 at 30 cm layer, and that expand into cluster 2 at 35 cm layer, where the highest packing density of 2.02 t/m3 is observed. This may suggest the need for subsoiling down to 35 cm in cluster 2 in particular. At depth of 40 cm another compacted layer can be observed in the entire field with the three clusters.
Descriptive statistics of packing density by cluster and by depth.

a Indicates packing density values≥1.6 (tillage may be required).
b Indicates packing density≥1.7, where tillage required.
c Indicates the final depths of tillage used for the VDT plan.
Variable depth tillage (VDT) plan
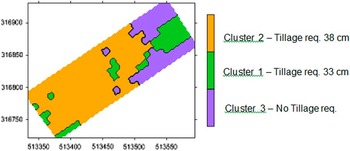
A VDT plan scaled in cm depth was developed where tillage depth was calculated as the depth of the maximum packing density value per cluster of each grid node+3 cm. The additional 3 cm was to ensure that the cultivator tine was sufficiently deep as to fully remove the compacted layer. The 40 cm depth layer was excluded from the tillage plan because of the distinctly different nature of the soil at that depth. Using the new depth attributes the data was interpolated using a nearest neighbour method to create a VDT plan (Figure 5).
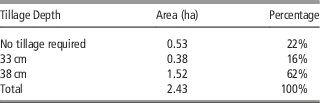
Variable depth tillage plan illustrating the spatial variation of tillage depth based on the mean packing density values. Cluster 1– Tillage req. 33 cm, Cluster 2– Tillage req. 38 cm, Cluster 3– No Tillage req.

The summary results in Table 4 illustrates that cluster 1 requires deep tillage to 33 cm where as cluster 2 requires deep tillage to 38 cm and cluster 3 requires no deep tillage at all. This is because at 23 cm the soil would be cultivated when the field is ploughed as part of the farms normal cultivation practice.
Summary results indicating the percentage area of tillage required for each cluster.

Conclusions
From the results of this research the following conclusions were made:
1. The multi-sensor data-fusion approach can be used successfully to provide key information sufficient to derive a soils state of compactness as an indicator of whether to cultivate or not to a certain depth.
2. As a preliminary assessment of data fusion for the creation of VDT plans it was found that K-means multivariate clustering enabled the factors affecting physical soil compaction to be fused together to delineate management zones suitable for variable depth tillage.
3. Because packing density is dependent on soil texture (e.g. percent clay), it is a more suitable indicator of soil compaction than bulk density in fields with varied soil textures and therefore is ideally suited as a variable depth tillage solution.
Acknowledgements
This project was funded by the UK AgriFood ATP. We would like to thank SOYL for the kind loan of the DUALEM ECa sensor and Amity Penetrometer.