Introduction
Type 1 diabetes mellitus is an insulin-dependent chronic disease with chronic hyperglycaemia. Reference Cooke and Plotnick1 The most important cause of morbidity and mortality in diabetes mellitus is cardiovascular system involvement. Reference Laing, Swerdlow and Slater2 It has been reported that the risk of sudden death is high in children with type 1 diabetes mellitus. Reference Freeman3
In studies in the literature, studies in type 1 diabetes mellitus are often performed on the basis of repolarisation anomalies, and depolarisation anomalies are ignored. Recently, a new parameter that evaluates both repolarisation and depolarisation simultaneously, the cardiac electrophysiological balance index, has been defined. Reference Lu, Yan and Gallacher4
Our aim in this study is to evaluate the risk of cardiac arrhythmia in children with type 1 diabetes mellitus with the cardiac electrophysiological balance index and to analyse the possible arrhythmia mechanism with the parameters of transthoracic echocardiography, heart rate variability along with disease duration and metabolic control.
Methods
Our study included 100 consecutive type 1 diabetes mellitus patients who were diagnosed and followed-up in the Pediatric Endocrinology Outpatient Clinic and 100 healthy children who applied to the Pediatric Cardiology Outpatient Clinic and had no cardiac pathology as a result of the evaluations. Type 1 diabetes mellitus patients with comorbidities such as Hashimoto’s disease and coeliac disease were not included in our study.
Our study is a prospective case-control study. Ethics committee approval for our study was obtained from the ethics committee of Gazi Yaşargil Training and Research Hospital (Date: 03/03/2023, decision no = 358).
Ages of all patients were expressed in years, body weight in kilograms, and height in centimetres. Reference Rewers, Pihoker, Donaghue, Hanas, Swift and Klingensmith5 After the patients rested for 15 min, systolic blood pressure and diastolic blood pressure were measured. Age at diagnosis, type of diagnosis, duration of disease, mean haemoglobin A1C in the last year, and haemoglobin A1C level at the time of application were obtained from the hospital system of DM patients.
The DM group was divided into two groups according to their gender. All patients were evaluated by the same Pediatric Cardiologist, anamnesis was taken, and detailed physical examination was performed.
Echocardiography was performed in all patients in the left lateral decubitus position (Vivid S60, General Electric Healthcare, GE Vingmed, Norway). Using a 1.5–4 MHz transducer, 2D, colour mode, M-mode evaluations were made using apical four, two, three-chamber, parasternal long-axis and short-axis images and recordings were made. Reference Schiller, Shah and Crawford6
Diastolic interventricular septal thickness, left ventricular posterior wall thickness, left ventricular end-diastolic diameter, left ventricular ejection fraction, and left ventricular fractional shortening were measured by parasternal long-axis M-mode echocardiography. Reference Mitchell, Rahko and Blauwet7,Reference Lang, Bierig and Devereux8
By placing the PW doppler cursor on the mitral valve tip in the apical 4-chamber position; E velocity, A velocity, E/A ratio, deceleration time, by placing the PW doppler cursor at the apical five cavity position at the mitroaortic junction; isovolumetric contraction time, isovolumetric relaxation time, ejection time were measured, myocardial performance index (isovolumetric contraction time + isovolumetric relaxation time)/ejection time was calculated. Reference Nagueh, Smiseth and Appleton9,Reference Tei, Nishimura, Seward and Tajik10
All patients underwent 12-lead electrocardiography (Econet Cardio M Plus, Germany; filtered 0.5–150 Hz, 25mm/s, 10mm/mV). At least five consecutive waves and intervals were calculated in leads V5 and DII.
The difference between the maximum P wave length (Pmax) and the minimum P wave length (Pmin) was defined as P wave dispersion. Reference Dilaveris and Gialafos11
The study evaluated ventricular depolarisation time (QRS), depolarisation dispersion (QRS-d), repolarisation times (QT, QTc), repolarisation dispersion time (QT-d, QTc-d), transmural repolarisation dispersion (Tpe, Tpe/QT ratio), and the cardiac electrophysiological balance index, which includes the ratios QT/QRS, Tpe/QRS, Tpe/(QT × QRS), and QTc/QRS. Reference Turrini, Corrado, Basso, Nava, Bauce and Thiene12–Reference Sivri and Çelik19,Reference Lu, Yan and Gallacher4
Electrocardiography measurements were made manually by transferring the images to a computer and using Adobe Photoshop programme by magnifying the images 200 times. Reference Rautaharju, Surawicz and Gettes20,Reference Khattab and Soliman21 Measurements were made blindly by two different paediatric cardiologists. The averages of the two measurements were taken.
Twenty-four-h electrocardiography recording and heart rate variability software based on holter electrocardiography recordings (DelMar Reynolds lifeCard CF; Impresario Software). Time and frequency-based parameters were obtained by evaluating the RR intervals every five minutes. From time-based parameters; Mean heart rate from RR intervals, Standard deviation of normal-normal beats (SDNN) standard deviation of RR intervals, SDNN index standard deviation of RR intervals per five minutes, SDSD of consecutive RR intervals SDSD, mean of RR intervals per five minutes SDANN, mean of differences of consecutive RR intervals square root rMSSD, percent values of RR change exceeding 50 ms were expressed as pNN50. Frequency-based parameters; The spectrum band between 0.04 and 0.15 Hz was defined as low frequency, and the spectrum band between 0.15 and 0.4 Hz was defined as high frequency. 22
Analyses were performed using the IBM SPSS (SPSS, Chicago) analysis programme. Kolmogorov–Smirnov test was used to evaluate the normal distribution. Continuous variables were expressed as mean±standard deviation or median (minimum-maximum), and categorical variables were expressed as percentages. Chi-square test was used to compare categorical variables, Student’s t test or Mann–Whitney U test was used to compare continuous variables, depending on whether the parameters showed normal distribution. In correlation analysis, Pearson correlation test and Spearman’s correlation test were used according to whether the parameter distribution was normal or not. Receiver operator characteristic curve analysis was performed to analyse the usability of the parameters. The cut-off point that could achieve a precision of at least 80% with the highest Youden’s index was chosen. Reference Fluss, Faraggi and Reiser23 p values less than 0.05 were considered statistically significant.
Results
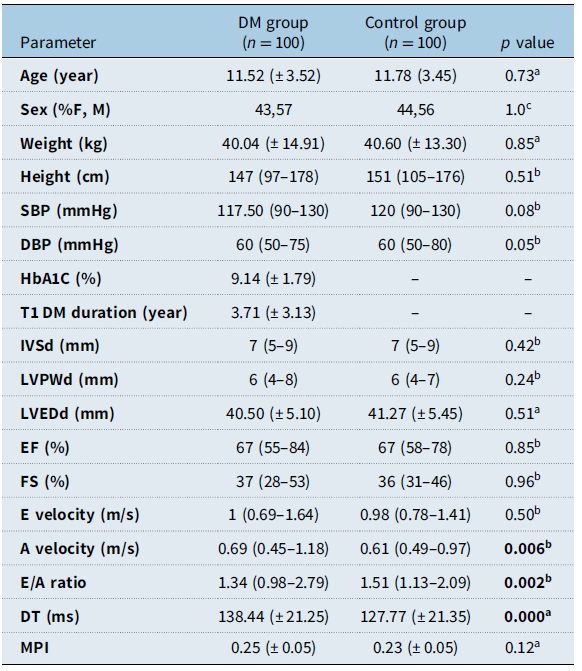
Fifty seven (57%) of our type 1 diabetes mellitus group and 56 (56%) of the control group were male. The mean age of the type 1 diabetes mellitus group was 11.52 years (± 3.52) and the mean age of the control group was 11.78 years (± 3.45).
Gender, age, body weight, height, systolic blood pressure, and diastolic blood pressure values in the type 1 diabetes mellitus group and the control group were similar in both groups and there was no statistical difference.
When the duration of the disease of type 1 diabetes mellitus patients was evaluated, 25% of the patients had the disease for <1 year, 50% of the patients had the disease for 1–5 years, and 25% of the patients had the disease for >5 years. Of the type 1 diabetes mellitus patients, 61% were diagnosed with diabetic ketoacidosis, 25% with ketosis clinic, and 13% with symptoms of hyperglycaemia, and they were diagnosed with diabetes mellitus.
In the type 1 diabetes mellitus group, the mean haemoglobin A1C value was 9.14% (± 1.79) and the mean disease duration was 3.71 years (±3.13).
The left ventricular wall thickness (diastolic inteventricular septum thickness, left ventricular posterior wall thickness), left ventricular end-diastolic diameter, left ventricular ejection fraction, fractional shortening, myocardial performance index, and left ventricular mitral early diastolic velocity (E) values were similar between the groups. Mitral early diastolic velocity deceleration time and mitral late diastolic velocity (A) were significantly higher in the type 1 diabetes mellitus group compared to the control group, and the E/A ratio was significantly lower in the type 1 diabetes mellitus group compared to the control group (p values 0.000, 0.006, 0.002, respectively) (Table 1).
Demographic data and transthoracic echocardiography parameters table in comparison of diabetes mellitus group and control group

a student t test, bmann-whitney test, cchi-square test, IVSd: diastolic inteventricular septum thickness; LVPWd: left ventricular diastolic posterior wall thickness; LVEDd: left ventricular end-diastolic diameter; EF: ejection fraction; FS : fractional shortening; DT: deceleration time; MPI: myocardial performance index; E: early diastolic velocity; A: late diastolic velocity.
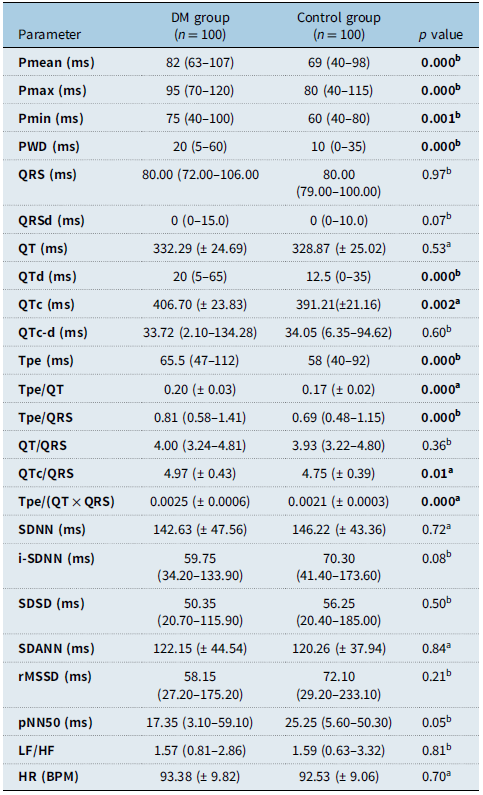
Pmean, Pmax, Pmin, and P wave dispersion values were significantly higher in the type 1 diabetes mellitus group than in the control group (p values 0.000, 0.000, 0.000, 0.001, respectively).
Although the QT value was similar between the groups, the QTc value was significantly higher in the type 1 diabetes mellitus group than in the control group ( p = 0.002).
Tpe and Tpe/QT ratios were significantly higher in the type 1 diabetes mellitus group (p values 0.000, 0.000, respectively).
Although the QT/QRS ratio was similar between the groups, the QTc/QRS, Tpe/QRS, and Tpe/(QT × QRS) ratios were significantly higher in the type 1 diabetes mellitus group than in the control group (p values 0.01, 0.000, 0.000, respectively).
Mean heart rate SDNN, SDNN index, SDSD, SDANN, RMSSD, pNN50, and low frequency/high frequency ratio were similar between the groups, and there was no statistical difference (Table 2).
Comparison table of electrocardiography and heart rate variability parameters of diabetes mellitus group and control group

astudent t test, bmann-whitney test, P: mean p duration; Pmax: maximum p wave duration; Pmin: minimum p wave duration; PWD: p wave dispersion; Tpe: The time between the peak of the T wave and its end; SDNN: standard deviation of each RR intervals; i-SDNN: standard deviation of RR intervals per five-minute; SDSD: standard deviation of consecutive RR intervals; SDANN: mean of RR intervals of each five-minute; rMMSSD: mean square roots of consecutive RR intervals; pNN50: percentage of RR intervals variation exceeding 50 ms; LF/HF: low frequency/high frequency ratio.
No correlation was found between disease duration and haemoglobin A1C level, heart rate variable parameters and electrocardiography parameters (repolarisation times, corrected repolarisation times, repolarisation dispersion times, corrected repolarisation dispersion times, cardiac electrophysiological balance indices, corrected electrophysiological balance indices).
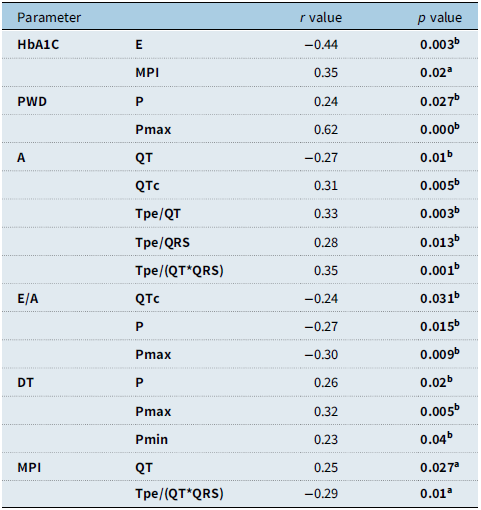
Correlation relationship of various parameters is given in Table 3. There is a moderate negative correlation with haemoglobin A1C level and Mitral E velocity, and a moderate positive correlation with myocardial performance index (Table 3).
Table showing the correlation relationship between transthoracic echocardiography diastolic parameters and electrocardiography parameters

apearson test,
bspearman’s test, E: early diastolic velocity; A: late diastolic velocity; DT: deceleration time of E wave; MPI: myocardial performance index; P: mean P duration; Pmax: maximum P wave duration; Pmin: minimum P wave duration; PWD: P wave dispersion; Tpe: The time between the peak of the T wave and its end; HbA1C: haemoglobin A1C.
There was a correlation between P wave dispersion and P and Pmax, between E/A ratio and P and Pmax, and between deceleration time and P and Pmax (Table 3).
While no correlation was found between P wave dispersion and heart rate variable and echocardiography parameters, there was a weak positive correlation between P wave dispersion and Tpe, Tpe/QT ratio, Tpe/QRS ratio, and Tpe/(QT × QRS) ratio (Table 3).
There was no correlation between P wave dispersion and echocardiography and heart rate variable parameters.
A negative correlation was observed between A velocity and QT, and a positive correlation between A velocity and QTc, Tpe/QT ratio, Tpe/QRS ratio, and Tpe/(QT × QRS) ratio (Table 3).
There was a negative correlation between the E/A ratio and QTc, and a positive correlation between myocardial performance index and QT.
Clinically significant tachycardia was not detected in any type 1 diabetes mellitus patient.
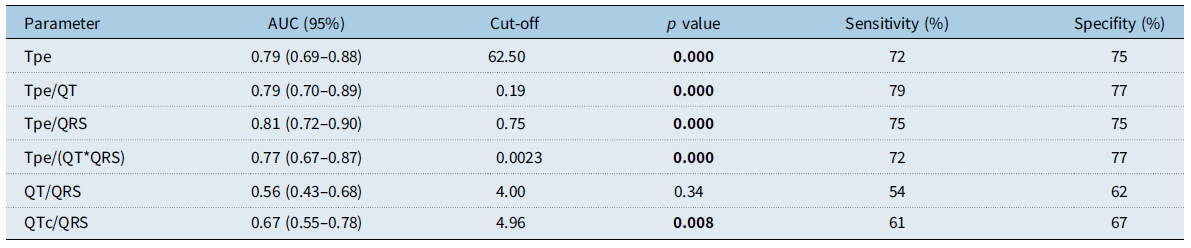
Table 4 shows the cutoff, sensitivity, and specificity values of the Tpe, Tpe/QT ratio, QT/QRS ratio, QTc/QRS ratio, Tpe/QRS ratio, and Tpe/(QT × QRS) ratio.
Electrocardiography parameters receiver operator characteristic analysis table values

Discussion
Diabetic cardiomyopathy mechanisms; impaired metabolism of fatty acids and carnitine, myocardial fibrosis caused by its interaction with angiogensin II and other cytokines, vasculopathy caused by endothelial dysfunction, impaired autonomic function, change in the duration of repolarisation due to changes in membrane ion current, increased free oxygen radicals due to hyperglycaemia, insulin is thought to be hypokalaemia secondary to treatment. Reference Fang, Prins and Marwick24–Reference Tse, Lai, Tse and Yeo26
In diastolic dysfunction, E velocity decreases, A velocity increases, E/A ratio decreases, deceleration time and myocardial performance index increase. Reference Nagueh, Smiseth and Appleton9 In our study, in parallel with the literature, high A velocity, low E/A ratio, and significantly higher deceleration time in the type 1 diabetes mellitus group indicate diastolic dysfunction in the type 1 diabetes mellitus group. Reference Khattab and Soliman21,Reference Köken, Demir, Sen, Kundak, Oztekin and Alpay27
The ventricular myocardium consists of three layers: endocardial, midmyocardial, and epicardial layer. The electrophysiological properties of the three layers are different from each other. The action potential duration is the shortest in the epicardium, and the action potential duration of the midmyocardial cells is the longest. Reference Lukas28
Increasing repolarisation times and repolarisation time dispersion creates a substrate for re-entrant arrhythmias. Reference Antzelevitch, Shimizu, Yan and Sicouri29 Since the repolarisation dispersion may change depending on the heart rate, there are studies showing that the use of Tpe/QT ratio will provide more accurate information in the evaluation of transmural repolarisation dispersion. Reference Gupta, Patel and Patel17
In our study, it was shown that the risk of ventricular arrhythmia is high in the type 1 diabetes mellitus group, in line with the studies in the literature based on repolarisation time (QTc), repolarisation dispersion (QTd, Tpe, Tpe/QT) times. Reference Arildsen, May, Christiansen and Damsgaard30–Reference Zorlu and Ömür39
The depolarisation wavelength (λ) is the distance that the depolarisation wave travels in the tissue exiting the refractory period. The invasively measured λ is considered to be equivalent to cardiac electrophysiological balance index. A significant advantage of cardiac electrophysiological balance index is that it can be easily calculated noninvasively. An increase or decrease in cardiac electrophysiological balance index may cause torsadogenic and nontorsadogenic ventricular tachyarrhythmias, respectively. Reference Lu, Yan and Gallacher4 While the QT/QRS ratio can be used in the evaluation of cardiac electrophysiological balance index, Tpe/QRS and Tpe/(QT × QRS) ratio can also be used. Reference Lu, Yan and Gallacher4,Reference Tse18 It has been reported that cardiac electrophysiological balance index is superior to Tpe, Tpe/QT ratio in determining the risk of arrhythmia. Reference Lu, Yan and Gallacher4
Cardiac electrophysiological balance index is basically the parameter based on the (repolarisation time)/(depolarisation time) ratio. Thus, both depolarisation and repolarisation are evaluated. This index, first proposed by Lu HR et al., has recently been used frequently in clinical practice. Reference Lu, Yan and Gallacher4 Besides QT/QRS, Tse G suggested using a new index based on the (transmural repolarisation dispersion time)/(depolarisation time) ratio for this index. Reference Tse18 For this purpose, the Tpe/QRS and Tpe/(QT × QRS) ratios can be used. Reference Tse18 The QTc/QRS ratio can be used as the heart rate-corrected cardiac electrophysiological balance index value. Reference Sivri and Çelik19
In our study, cardiac electrophysiological balance index and corrected cardiac electrophysiological balance index parameters were significantly higher in the type 1 diabetes mellitus group than in the control group, parallel to a study conducted in adults with type 1 diabetes mellitus. Reference Zorlu and Ömür39 We believe that cardiac electrophysiological balance index parameters, especially Tpe/QRS ratio, can be easily measured at the bedside, used in clinical practice, and provide useful information in predicting the risk of arrhythmia, due to the practicality of measurement.
When evaluating with parameters based only on repolarisation times, depolarisation is ignored. Evaluating possible repolarisation changes in depolarisation pathologies is seen as an incomplete approach. In this context, we believe that cardiac electrophysiological balance index will provide more useful information in predicting ventricular tachyarrhythmias, taking into account both depolarisation and depolarisation changes.
P wave dispersion is the difference between the maximum P wave duration and the minimum P wave duration measured in different leads. P wave dispersion demonstrates the heterogeneity of electrical propagation to the atrial tissue. Increased P wave dispersion is a risk factor for atrial tachyarrhythmias. Reference Dilaveris and Gialafos11 In parallel with the literature in our study, P wave dispersion was significantly higher in the type 1 diabetes mellitus group compared to the control group. Reference Köken, Demir, Sen, Kundak, Oztekin and Alpay27 There was no relationship between disease duration, haemoglobin A1C level, heart rate variable parameters, and P wave dispersion.
P wave duration is associated with sympathovagal tone. Sympathetic activity shortens P duration, parasympathetic effect increases P duration. Reference Cheema, Ahmed, Kadish and Goldberger40 While no correlation was found between heart rate variable parameters and P, Pmax, Pmin, and P wave dispersion in our study, there was a negative correlation between Pmax and E/A, and a positive correlation between Pmax and deceleration time. The moderate correlation between P wave dispersion and Pmax in our study and the increase in P wave dispersion in the type 1 diabetes mellitus group may be indirectly related to left ventricular diastolic dysfunction, contrary to the studies in the literature. Reference Köken, Demir, Sen, Kundak, Oztekin and Alpay27 More work needs to be done on this.
In addition to studies showing that autonomic involvement is common in children with type 1 diabetes mellitus, both the sympathetic system and parasympathetic system are affected, there are studies showing that the parasympathetic system is affected more frequently and the sympathetic system is affected more frequently. Reference Boysen, Lewin, Hecker, Leichter and Uhlemann41–Reference Tanaka, Hyllienmark and Thulesius44 There are studies showing that ventricular repolarisation abnormalities and autonomic dysfunction may be related to DM and that cardiac autonomic dysfunction may cause sudden death. Reference Tanaka, Hyllienmark and Thulesius44,Reference Watanabe, Kobayashi and Tanno45
Standard deviation of consecutive RR intervals (SDSD), Mean square roots of consecutive RR intervals (rMSSD), Percentage of RR intervals variation exceeding 50 ms (pNN50) parameters indicate parasympathetic activity, low frequency/high frequency ratio indicates sympatovagol balance. 22 It has been reported that autonomic dysfunction is not associated with disease duration and glycemic control in children with type 1 diabetes mellitus. Reference Aytemir, Aksöyek, Ozer, Gürlek and Oto31 In our study, time and frequency-based heart rate variables parameters SDNN, SDNN-i, SDSD rMSSD, pNN50, and low frequency/high frequency ratio were similar in both groups. Based on these data, it can be said that there is no autonomic dysfunction in the type 1 diabetes mellitus group. In addition, no correlation was found between heart rate variable parameters and disease duration, haemoglobin A1C level, and electrocardiography parameters. It has been reported that complications such as diabetic neuropathy will develop 5-10 years after the onset of the disease. Reference Cho, Craig and Hing46 In our study, the mean duration of the disease was 3.71 (±3.13) years. The absence of autonomic dysfunction may be a relatively short disease duration.
In our study, we think that there is a high arrhythmia risk in children with type 1 diabetes mellitus with repolarisation-based parameters and that cardiac electrophysiological balance index and especially the measurement of Tpe/QRS ratio can provide more specific information in demonstrating ventricular arrhythmia due to its practicality, high sensitivity and specificity.
In a study conducted in adult type 1 diabetes mellitus patients, they stated that there was a correlation between haemoglobin A1C levels, along with an increased risk of ventricular arrhythmia in DM patients. Reference Inanır, Gunes, Sincer and Erdal33 In our study, we determined that electrocardiography parameters were not correlated with disease duration, blood haemoglobin A1C level, heart rate variable parameters, but were correlated with diastolic dysfunction parameters. We think that repolarisation abnormality is especially dependent on the late repolarisation time and may be a promising treatment in the prognosis of cardiovascular complications, especially with treatments regulating late repolarisation.
Conclusions
The result of our work; children with type 1 diabetes mellitus are at risk for atrial and ventricular arrhythmias without valvular disease, ischaemic heart disease findings, and diastolic dysfunction despite normal systolic functions. No correlation was found between disease duration, metabolic control, autonomic function parameters, and arrhythmia risk, but it was associated with diastolic function parameters.
We have shown that cardiac electrophysiological balance index parameters can be used to indicate increased risk of ventricular arrhythmias. It is the first study in the literature to use cardiac electrophysiological balance index to show the risk of ventricular arrhythmia in children with type 1 diabetes mellitus. In our study, similar values were found in adult type 1 diabetes mellitus patients in parallel with cardiac electrophysiological balance index studies. Reference Boysen, Lewin, Hecker, Leichter and Uhlemann41
The biggest limitation of the study is that it was conducted in a single centre and the haemoglobin A1C level was not measured in the control group. Considering that the most basic pathology in our study is late repolarisation pathology, we think that it would be beneficial to conduct the study by arranging the channels regulating late repolarisation in diabetic animal experiments in terms of predicting possible risks and developing treatments for this.
Acknowledgements
None.
Financial support
None.
Competing interests
None.
Ethical standard
The authors assert that all procedures contributing to this work comply with the ethical standards of the relevant national guidelines on human experimentation and with the Helsinki Declaration of 1975, as revised in 2008, and has been approved by the institutional committees (Ethical Committee of the Gazi Yaşargil Training and Research Hospital, with approval number 358/2023).