Implications
The methods of processing dietary ingredients may affect milk protein profiles through the modification of digestion and utilization within the cow’s body. Proteomic approaches have identified 13 protein spots in milk from cows fed four diets with differently processed corn grain and soybean meal, suggesting that a rumen degradable nitrogen supply affects the synthesis and secretion of milk proteins in the lactating cow’s mammary gland.
Introduction
Cows’ milk represents an important contribution to human nutrition. Protein components of cows’ milk, comprising of about 80% casein (CN) (α S1-, α S2-, β- and κ-CN) and 20% whey (α-lactalbumin (LA) and β-lactoglobulin (LG)) (Dziuba et al., Reference Dziuba, Minkiewicz, Darewicz and Dziuba2010; Bendixen et al., Reference Bendixen, Danielsen, Hollung, Gianazza and Miller2011), exert specific biological functions that have been reviewed previously (Bendixen et al., Reference Bendixen, Danielsen, Hollung, Gianazza and Miller2011; Kishore et al., Reference Kishore, Mukesh, Sobti, Mishra and Sodhi2013). Milk production is a defining feature of dairy cows. Several factors, such as cow health, environment, lactation stage, genetics and diet, can influence milk protein content and yield (Schingoethe, Reference Schingoethe1996; Boehmer et al., Reference Boehmer, Bannerman, Shefcheck and Ward2008). In addition, synchronizing the degradation of ruminal carbohydrate and protein by changing diet ingredients can theoretically maximize microbial protein synthesis to support milk production (Casper et al., Reference Casper, Maiga, Brouk and Schingoethe1999; Cole and Todd, Reference Cole and Todd2008). For example, cows in early lactation fed slowly fermentable synchronized diets or asynchronous diets produced less milk than cows that were fed a synchronous diet for fast rumen degradable energy and nitrogen (N) (Herrera-Saldana and Huber, Reference Herrera-Saldana and Huber1989; Herrera-Saldana et al., Reference Herrera-Saldana, Gomez-Alarcon, Torabi and Huber1990). Despite extensive work on carbohydrate and CP synchronization for rumen and milk yield (review in Cabrita et al., Reference Cabrita, Dewhurst, Abreu and Fonseca2006), its effects on the milk protein expression profile remain poorly understood.
Proteomics is an attractive approach for studying milk protein expression in dairy cows. The proteome is a complete set of translated proteins in a given biological sample (O’Donnell et al., Reference O’Donnell, Holland, Deeth and Alewood2004). Proteomics have been used to investigate bovine milk protein fractions either CN (Galvani et al., Reference Galvani, Hamdan and Righetti2001), major whey components (Galvani et al., Reference Galvani, Hamdan and Righetti2001), low abundance proteins (Yamada et al., Reference Yamada, Murakami, Wallingford and Yuki2002) or milk fat globule membrane proteins (Reinhardt and Lippolis, Reference Reinhardt and Lippolis2006). Further, phosphorylation and glycosylation of bovine κ-CN have also been characterized by Holland et al. (Reference Holland, Deeth and Alewood2006). However, the published comparative proteomic analyses have mostly focused on host defense proteins in bovine milk that protect the neonate/mammary gland against infection or diagnostic markers of mastitis in affected animals (Boehmer et al., Reference Boehmer, Bannerman, Shefcheck and Ward2008). Few published reports have studied the effects of dietary nutrient supply on expression profile changes in milk protein composition using proteomics. Daniels et al. (Reference Daniels, Webb, McGilliard, Meyer, Van Amburgh and Akers2006) described that the elevated (950 g/day of daily gain) or restricted dietary (650 g/day of daily gain) nutrition affected mammary protein including 131 protein spots and 15 specifically identified proteins such as transferrin. In addition, milk β-CN A2, α S1-CN variant, and albumin were up-regulated when the cows received duodenal infusion of 400 g/day of α-linolenic acid (Yang et al., Reference Yang, Wang, Yuan, Bu, Yang, Sun and Zhou2013). Thus, the proteomic method can be used to identify protein profile of milk in dairy cows fed diets with different nutrient synchronicity.
Corn and soybean meal are main components of concentrate mixture as energy and protein source, respectively, for lactating dairy cows. Their ruminal degradation can be changed through processing methods to alter nutrient synchronicity. We hypothesized that milk protein secreted by mammary gland of the cow are altered by the feed processing methods.
The objective of this experiment was to characterize expression changes of individual milk proteins in response to altered nutrient synchronicity in the rumen owing to variable corn grain and soybean meal processing methods.
Material and methods
Animals and treatments
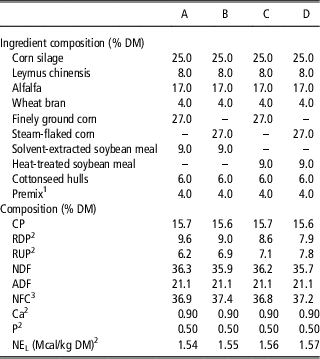
A total of 12 multiparous Holstein dairy cows (BW=594±31 kg; days in milk=130±14 days; milk yield=31.3±1.8 kg) were used in a triplicate 4×4 Latin square design with 21 days periods and a 2×2 factorial arrangement of dietary treatment. Each experimental period consisted of 14 days of dietary adaptation and 7 days for sample and data collection. The main factors assessed were corn (finely ground (FGC) v. steam-flaked (SFC)) and soybean meal (solvent-extracted (SSBM) v. heat-treated (HSBM)). The FGC was prepared in the same batch with an average geometric mean particle size of 1030 μm. The SFC was prepared by steaming whole corn in a 300 kg vertical stainless steel chamber at 100°C to 110°C for about 50 min to raise moisture to ~18% to 19%, then flaking through a prewarmed roller miller (50×75 cm) to obtain a flake of 360 g/l of density. Both SBM were commercial products ( provided by Shanghai Bright Holstan Co., Ltd, Shanghai, China). Rumen starch degradability of SFC and FGC was 66.9% and 46.9%, and rumen protein degradability of SSBM and HSBM was 54.2% and 29.3%, respectively (Shen and Liu, Reference Shen and Liu2013). The SFC and SSBM were mixed to synchronize rapid fermentation, and the FGC and HSBM were mixed to synchronize slow fermentation. Two unsynchronized diets with a rapidly and a slowly fermenting component were formulated by mixing the SFC with HSBM or the FGC with SSBM. From these combinations, four complete mixed diets with the same basal ingredient were formulated according to the Feeding Standard of Dairy Cattle (Ministry of Agriculture of P. R. China, 2004, Table 1).
Ingredients and chemical compositions of experimental diets (DM basis)

DM=dry matter; RDP=rumen degradable protein; RUP=rumen undegradable protein; NFC=nonfiber carbohydrate; NEL=net energy for lactation.
1 Formulated to provide (per kg of DM) 1% CP, 15% ether extract, 6% crude fiber, 7% Ca, 1.3% P, 10% Salt, 3% Mg, 1.5% K, 1% Met, 260 mg of Cu, 260 mg of Fe, 1375 mg of Zn, 500 mg of Mn, 112 500 IU of vitamin A, 29 500 IU of vitamin D3 and 700 IU of vitamin E.
2 Calculated based on individual feedstuffs in the Ministry of Agriculture, China (2004).
3 NFC=100−(%NDF+%CP+%Fat+%Ash).
Cows were housed in indoor tie stalls bedded with sand with an individual feed bunk and free access to feed and water. The diets were offered as total mixed ration three times daily at 0630, 1330 and 2000 h at an ~5% feed refusal. The feed offered and orts were weighed for 4 consecutive days from day 16 to day 19 of each period. The cows were milked three times daily at 0700, 1400 and 2030 h.
Sample collection and preparation
Milk samples were collected on days 18, 19 and 20 of each period. Two 50 ml milk samples from individual cows collected from the three daily milking times were mixed completely at a ratio of 4 : 3 : 3. The milk samples were centrifuged at 3000×g at 4°C for 15 min. After removing the upper fat, the fat-free protein was collected and stored at −20°C until analysis. Concentration of milk protein was measured by the Super-Bradford Protein Assay Kit (CWBIO, Beijing, China) using bovine serum albumin as a standard, according to the manufacturer’s protocol. Briefly, 5 μl of diluted serum albumin standard (final concentration 0, 125, 250, 500, 1000, 1500 and 2000 μg/ml) and diluted milk samples were pipetted into individual wells of a 96-well plate and 250 μl of Bradford protein assay reagent was added later into all wells containing the standard or sample. Absorbance at 595 nm was read after incubation for 10 min at room temperature. The concentration of individual milk protein was calculated based on the standard curve of albumin.
Two-dimensional gel electrophoresis (2DE)
Milk protein samples (280 μg) were diluted to 350 μl with a rehydration solution composed of 8 M urea, 4% 3-[(3-cholamidopropyl)-dimethylammonio]-1-propanesulfonate, 6.5 mm dithiothreitol, 0.2% (w/v) immobilized pH gradient (IPG) buffer and 0.001% bromophenol blue. The samples were then rehydrated on 17 cm, pH 4 to 7 IPG strips (Bio-Rad Laboratories, Hercules, CA, USA) in the hydration plate. After 12 h of passive rehydration, isoelectric focusing was performed in an Ettan IPG Phor unit (GE Healthcare, Waukesha, WI, USA) as described by the manufacturer and focused in six steps (100 V, 1 h; 500 V, 1 h; 1000 V, 1 h; 4000 V, 1 h; 8000 V, 1 h and 8000 V, 65 000 Vhr). Subsequently, focused IPG strips were first incubated for 15 min in 10 ml of 6 M urea, 2% SDS, 20% glycerol, 0.375 M Tris-HCl pH 8.8 and 2% dithiothreitol and then incubated in the same buffer solution containing 2.5% iodoacetamide instead of dithiothreitol. The strips were transferred onto a 12.5% polyacrylamide gel for second dimension separation using an Ettan DALTtwelve Electrophoresis Unit (GE Healthcare). Finally, the gel strips were overlaid with 0.5% (w/v) agarose in running buffer containing bromophenol blue. Electrophoresis was performed at 20°C to 25°C at 50 V for the first 1 h and then at a constant voltage of 200 V. The power supply was turned off when the bromophenol blue dye front was within 1 cm of the edge of the gel (after approximately 8 h). After electrophoresis, 2D-PAGE gels were fixed for 30 min with Milli-Q water–glacial acetic acid–ethanol (5 : 1 : 4) solution and then stained for 6 h with Coomassie Brilliant Blue G-250 as described in a study by Candiano et al. (Reference Candiano, Bruschi, Musante, Santucci, Ghiggeri, Carnemolla, Orecchia, Zardi and Righetti2004). For the technical replication, three gels were run for an individual animal in one sampling day of each period, and all sample gels were electrophoresed under identical conditions.
Image analysis
All gels were digitized at 300 dpi using the GS-800 Calibrated Densitometer (Bio-Rad Laboratories). Raw gel images were incorporated into the ImageMaster 2D Platinum software, version 6.0 (GE Healthcare), where they were cropped, filtered, compiled into a Matchset and manually confirmed. To analyze protein intensity, triplicate biological 2D gels were compared with each other, and a master gel was obtained. In each master gel, protein spot position, shape and optical density were averaged and volumes were corrected by the background. Thus, the individual spot intensity volume was normalized with the total intensity volume. At least five well-defined landmarks were used for matching gels. Protein spots that exhibited a greater than twofold change in their normalized volume were considered as differentially expressed, and the analysis of values were then performed for statistical significance (Goncalves Lda et al. Reference Goncalves Lda, Soares, Nogueira, Garcia, Camisasca, Domont, Feitosa, Pereira Dde, Zingali and Alves2010).
In-gel digestion and peptide extraction
A total of 13 spots were excised manually using pipette tips. Each gel spot was placed into a 1.5 ml microtube and washed with 100 mm ammonium bicarbonate in 30% acetonitrile. After freeze-drying, the gel fragments were digested in 5 μl of digestion buffer containing trypsin (Promega, modified sequencing grade) at a final concentration of 10 ng/μl in 100 mm ammonium bicarbonate and incubated for 20 h at 37°C. The tryptic peptides were extracted from the gel pieces by incubating with 100 μl of 60% acetonitrile in 0.1% trifluoroacetic acid with sonication for 15 min. The supernatants were pooled and concentrated to near dryness.
Matrix-assisted laser desorption/ionization-time of flight/time of flight (MALDI-TOF/TOF) MS analysis
Each sample was resuspended in 2 μl of 20% acetonitrile; 1 μl of the solution was directly applied onto the ABI 4800 target plate (384 Opti-TOF 123×81 mm ss, Applied Biosystems, Foster City, CA, USA) followed by 0.5 μl of the supersaturation α-cyano-4-hydroxycinnamic acid matrix solution in 50% acetonitrile/0.1% trifluoroacetic acid and left to dry. The data for protein identifications were acquired using the 4800 Plus MALDI-TOF/TOF Analyzer (Applied Biosystems). Both MS and MS/MS data were obtained with a neodymium-doped yttrium aluminum garnet (Nd : YAG) laser with a 355 nm wavelength. An accelerating voltage of 2 kV was used. The mass spectrometer was set to perform data acquisition in the positive ion mode with a selected mass range of 800 to 4000 Da. Eight of the most intense ions with a signal-to-noise ratio above 50 were selected as precursors for MS/MS acquisition. The collision energy was set at 2 kV and the collision-induced dissociation in MS/MS spectra was closed. To identify the proteins, a database search with the analyst peptide mass fingerprinting was performed against the NCBI nonredundant database (http://www.ncbi.nlm.nih.gov). The search parameters were set as follows: taxonomy as ‘mammalia;’ enzyme as ‘trypsin;’ fixed modification as ‘carbamidomethyl (C);’ peptide mass tolerance at ‘±100 ppm;’ fragment mass tolerance at ‘±0.4 Da; max missed cleavages at ‘1’ and ‘monoisotopic’.
Western blot analysis
Skimmed milk proteins were separated by SDS-PAGE and transferred to a polyvinylidene fluoride membrane. The membrane was blocked with tris-buffered saline Tween-20 containing 3% swine serum for 1 h at room temperature and then incubated with primary antibody (rat anti-bovine β-CN antibody, diluted 1 : 1 000) (BPI, Beijing, China) for 1 h at 37°C. After washing with tris-buffered saline Tween-20, the membrane was incubated for 1 h with goat anti-rat antibodies diluted 1 : 2000 and visualized with an ECL chemiluminescence system (Boster, Wuhan, China) according to the manufacturer’s protocol. One blot was run per cow of each period. The relative quantity of β-CN was defined as the gray scale of the X-ray using the Quantity One software (v 4.6.2, Bio-Rad).
Statistical analysis
The densitometric values of protein spots detected in milk of dairy cows and relative β-CN quantity values were analyzed for significance using the GLM procedure of SAS (SAS Institute, 2000). Statistical analysis of densitometric values was performed by ANOVA and Duncan’s multiple range tests. Fixed effects in the model included dietary treatment. Statistical differences were considered significant at P⩽0.05. In the present study, three biological replications (three cows) and three technical replications (individual cows) of the densitometric values of protein spots and relative β-CN quantity values were performed for the statistical analysis.
Results and discussion
Bovine milk protein expression profiles
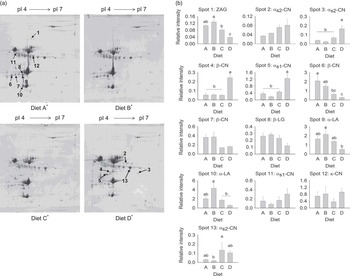
In this study, milk samples were separated by 2DE and the resulting protein profiles evaluated. Image analysis showed that three replicate 2DE gels for each cow were reproducible. The representative gel images from each diet are displayed in Figure 1 to illustrate changes in milk protein expression. Statistical analysis identified 13 spots with variable abundance of protein profile (Figure 1). Among the 13 protein spots submitted for MS, no protein profile differences were observed between the FGC and SFC-fed gels in the cows fed SSBM.
Two-dimensional gel electrophoresis (2DE) maps and densitometric values of protein spots of milk protein. (a) 2DE maps for milk protein expression in dairy cows fed diet A, B, C or D, respectively. The numbered spots are listed in Table 2. (b) Densitometric values of protein spots (numbered in Figure 1a) detected in milk of dairy cows fed diet A, B, C or D. Bars indicate s.e.m. (n=3).a,b,c Means within the same spot with different superscripts differ (P<0.05). *Diet A contains 27% finely ground corn (FGC) and 9% solvent-extracted soybean meal (SSBM), diet B contains 27% steam-flaked corn (SFC) and 9% SSBM, diet C contains 27% FGC and 9% heat-treated soybean meal (HSBM), and diet D contains 27% SFC and 9% HSBM. CN=casein; LG=lactoglobulin; LA=lactalbumin; ZAG=zinc-alpha-2-glycoprotein.

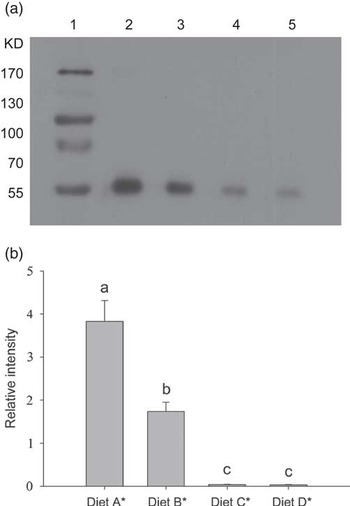
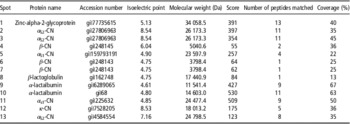
The milk yield was 28.5, 28.6, 28.5 and 28.2 kg/day and milk protein yield was 0.98, 0.97, 0.97 and 0.96 kg/day for SFC (SSBM and HSBM) and FGC (SSBM and HSBM), respectively (Shen et al., Reference Shen and Liu2013). Neither was influenced by the corn types, nor by soybean meal types (Shen and Liu, Reference Shen and Liu2013). However, abundance of one α s2-CN (spot 3) and one α s1-CN (spot 5) fragments was higher in the cows fed the SFC-HSBM than in those on SFC-SSBM, whereas the fragments of α-LA and zinc-alpha-2-glycoprotein (ZAG) were down-regulated in SFC-HSBM-fed cows compared with SFC-SSBM-fed cows (Figure 1; Table 2). There was no significant change in α s2-CN (spot 13) between corn type and soybean meal type. In addition, no difference was found in κ-CN and β-LG among different treatments (Figure 1b). The fragment of β-CN on spot 6 was down-regulated in HSBM-fed cows compared with SSBM-fed cows (Figure 1b). However, β-CN fragments on spot 4 had a higher expression in the SFC-HSBM-fed cows compared with the SFC-SSBM-fed cows (Figure 1b). The relative decrease in β-CN fragment observed on spot 6 was validated by western blot (Figure 2), in agreement with the MS data. The numbers that correspond to the protein names, NCBI protein accession numbers, approximate molecular weight (MW) and isoelectric point (pI) for these protein spots were listed in Table 2.
Western blot analysis of β-casein (CN) in the milk from dairy cows fed differentially processed corn grain or soybean meal. (a) Western blot analysis of β-CN; Lane 1, molecular weight markers; Lane 2, 3, 4 and 5, milk from dairy cows fed diet A, B, C or D, respectively. (b) Densitometric analysis of β-CN. Bars indicate s.e.m. (n=3).a,b,c Means within the same spot with different superscripts differ (P<0.05). *Diet A contains 27% finely ground corn (FGC) and 9% solvent-extracted soybean meal (SSBM), diet B contains 27% steam-flaked corn (SFC) and 9% SSBM, diet C contains 27% FGC and 9% heat-treated soybean meal (HSBM), and diet D contains 27% SFC and 9% HSBM.

Characterization of milk protein expression in cows fed differently processed corn grain and soybean meal by MALDI-TOF/TOF MS

MALDI-TOF/TOF=matrix-assisted laser desorption/ionization-time of flight/time of flight.
The effects of synchronizing N and energy availabilities on rumen function and production responses to dairy cows have been well evaluated by Cabrita et al. (Reference Cabrita, Dewhurst, Abreu and Fonseca2006). Briefly, diet synchronicity can be manipulated by changing dietary ingredients. Although the synchrony effects may be less important in vivo than was theoretically expected (Cabrita et al., Reference Cabrita, Dewhurst, Abreu and Fonseca2006), the positive effects of the synchrony on microbial protein synthesis and milk production should be an aspect of consideration to some extent (Casper et al., Reference Casper, Maiga, Brouk and Schingoethe1999). The decision to use corn-based diets and soybean-based diets as the N and energy sources resulted in a different synchrony. In addition, different methods used to process corn grain and soybean meal can effectively overcome the differences in the ingredient types (Dewhurst et al., Reference Dewhurst, Davies and Merry2000). Further, identifying which milk protein expression was affected by which processing method would be vital for further study. Accumulating evidence suggests that fast N and energy synchronized diet-fed cows produce more milk than those fed synchronized diets that slowly release N and energy or those fed asynchronous diets (Herrera-Saldana et al., Reference Herrera-Saldana, Gomez-Alarcon, Torabi and Huber1990; Cabrita et al., Reference Cabrita, Dewhurst, Abreu and Fonseca2006).
In the current study, two milk proteins (α-LA and ZAG) displayed higher expressions with diets synchronized for a fast N and energy release than diets synchronized for a slow or asynchronous release. Partly, these observations could be attributed to a higher microbial protein synthesis, which could be promoted in dairy cows fed a diet synchronized for fast rumen degradation of energy and N (Herrera-Saldana et al., Reference Herrera-Saldana, Gomez-Alarcon, Torabi and Huber1990). In addition, microbial protein accounts for ~66.5% amino acid (AA) N of the total N and is rich in most of the essential AA for milk and milk protein synthesis (Clark et al., Reference Clark, Klusmeyer and Cameron1992). Therefore, the above observation may indicate that maximizing microbial growth would promote a more efficient utilization of the nutrients being supplied to dairy cows and thereby increasing milk protein expression. This observation may be attributed to the higher expression of whey protein (α-LA and ZAG). Results shown that only one of the major milk protein components (α s2-CN on spot 13) exhibited a higher expression with diets synchronized for a slow release of N and energy, which may be owing to the smaller content of α s2-CN (10% in total CN) than α s1 (40% in total CN) or β-CN (45% in total CN) (Dziuba et al., Reference Dziuba, Minkiewicz, Darewicz and Dziuba2010). However, there was no increased milk protein expression because the milk protein yield was not changed by the treatments. We speculated that the compensation effect, which occurred in dairy cows with diet for a different synchronous N and energy release, might result in unchanged milk and milk protein yield.
ZAG
Protein spot 1 was identified as a ZAG (Figure 1a; Table 2). The ZAG is a 43 kDa secreted soluble glycoprotein that was first isolated from human plasma (Burgi and Schmid, Reference Burgi and Schmid1961) and has been subsequently identified in most body fluids, including serum (Burgi and Schmid, Reference Burgi and Schmid1961), saliva (Tada et al., Reference Tada, Ohkubo, Niwa, Sasaki, Tateyama and Eimoto1991), milk (Senda et al., Reference Senda, Fukuda, Ishii and Urashima2011) and urine (Hirai et al., Reference Hirai, Hussey, Barber, Price and Tisdale1998), and is also found in secretory epithelial cells of the liver and the gastrointestinal tract (Tada et al., Reference Tada, Ohkubo, Niwa, Sasaki, Tateyama and Eimoto1991). The ZAG is a member of the immunoglobulin gene superfamily and is highly homologous to the major histocompatibility complex (MHC) class I family of proteins in its crystal structure (Sanchez et al., Reference Sanchez, Chirino and Bjorkman1999). Similar to MHC class I proteins, the ZAG harbors a large groove that serves as the binding site for hydrophobic ligands such as fatty acid-like moieties and may be relevant for ZAG’s lipid catabolism function (Sanchez et al., Reference Sanchez, Chirino and Bjorkman1999). The biological functions of ZAG are unclear, but it has been purified from the urine of patients with cancer cachexia and can mobilize lipids (Todorov et al., Reference Todorov, McDevitt, Meyer, Ueyama, Ohkubo and Tisdale1998). The ZAG has been demonstrated to mediate fat loss in carcinomas, consistent with its roles in stimulating lipid breakdown in adipocytes and reducing fat stores in animals (Sanchez et al., Reference Sanchez, Chirino and Bjorkman1999). Senda et al. (Reference Senda, Fukuda, Ishii and Urashima2011) indicated that ZAG in bovine colostrums may relate to the immunological function of newborn calves. However, a proposed role for milk ZAG has yet to be defined. In the current study, expression of ZAG was down-regulated in milk from cows fed HSBM compared with SSBM-fed cows. Furthermore, the calculated MW and pI for bovine milk ZAG were 34 kDa and 5.13, respectively, as reported by D’Amato et al. (Reference D’Amato, Bachi, Fasoli, Boschetti, Peltre, Senechal and Righetti2009). However, the mechanism of HSBM-induced down-regulation of ZAG is not clear.
Caseins
The CN fraction of bovine milk comprises four proteins (α S1-CN, α S2-CN, β-CN and κ-CN), which represent ~80% of the total protein (Kishore et al., Reference Kishore, Mukesh, Sobti, Mishra and Sodhi2013). They aggregated into large colloidal micelles, the structure and stability of which are essential for processing milk into gelled products such as cheese and yogurt and to make them useful for different applications (Fox and Brodkorb, Reference Fox and Brodkorb2008).
β-casein
Protein spots 4, 6 and 7 were identified as β-CN (Figure 1a, Table 2). Up to 45% of bovine milk CN is comprised of β-CN, which consists of 12 genetic variants (Caroli et al., Reference Caroli, Chessa and Erhardt2009). The expression of the β-CN fraction in spot 4 was different from spot 6 and 7 expressions, reflecting the extensive genetic and posttranslational variation of this protein group. Expression of β-CN may have a compensation effect between the variants. The in vitro bovine mammary epithelial cell results indicated that not only did the cells grow but β-CN expression was also promoted with the addition of Lys to the media (Lu et al., Reference Lu, Li, Huang and Gao2013). Based on our findings, we hypothesize that concentrations of essential AAs, such as Lys, are higher in mammary gland cells because they can be supplemented by microbial protein in dairy cows fed SSBM, which displays a higher rumen degradable protein than HSBM. The higher Met content in β-CN than in α-CN may also be an attributable factor (Gordon et al., Reference Gordon, Semmett, Cable and Morris1949). As microbial protein can be a primary Met source for milk protein synthesis and knowing that heat treatment of SBM would increase the by-pass of a protein with low Met concentration, the SSBM diet could supply more microbial Met to the mammary gland. However, it is still unclear for the different changes between the variants in response to dietary treatments.
κ-casein
Protein spot 12 was identified as κ-CN (Figure 1a; Table 2), which is one of the major proteins in milk. It plays a key role in stabilizing the structure of CN micelles by forming a hydrophilic coating that prevents micelle association and aggregation (Huppertz, Reference Huppertz2013). Holland et al. (Reference Holland, Deeth and Alewood2006) identified the κ-CN phosphorylation and glycosylation sites and a pI of 4.47 to 5.81 with different κ-CN forms. Our 2D-PAGE experiments demonstrated that this protein exhibited an approximate MW of 18 kDa and a pI of 8.53. The different pI value may be owing to the fact that they belong to different κ-CN variant forms. No difference was found in κ-CN among different treatments, suggesting that κ-CN content in milk was stable and not affected by dietary treatment.
α s2-casein
Protein spots 2, 3 and 13 were identified as α s2-CN (Figure 1a; Table 2), which display molecular chaperone properties that protect a wide range of proteins from milk and nonmilk sources against aggregation and precipitation under stress conditions (e.g. heat, reduction) (Treweek, Reference Treweek2012). Prizant and Barash (Reference Prizant and Barash2008) documented that the AAs Lys, His and Thr negatively affect S6K1 phosphorylation in bovine mammary epithelial cells. The decreased α s2-CN levels in cows fed SSBM may have resulted from the up-regulation of the availability of an essential AA, such as Lys, to stabilize the CN structure. In the current study, the calculated MW and pI for milk α s2-CN were 26 kDa and 8.54, respectively.
α s1-casein
Protein spots 5 and 11 were identified as α s1-CN (Figure 1a; Table 2). The α s1-CN family constitutes up to 40% of all casein fractions in bovine milk (Dziuba et al., Reference Dziuba, Minkiewicz, Darewicz and Dziuba2010). The expression of the α s1-CN fraction was enhanced in the cows fed the SFC-HSBM than in those on SFC-SSBM, as in the case of α s2-CN. Also, the greater expression of α s1-CN fragments in SFC-HSBM might balance the decrease of β-CN to stabilize the CN structure.
In this study, a proteomic approach was used to investigate the effects of diets with differently processed N supplies on the milk protein profile of dairy cows. A total of 13 milk protein spots were characterized and most likely correlated with the cow feed. In cows receiving SFC, an abundance of α s1-CN and α s2-CN fragments increased more in cows fed HSBM than in SSBM-fed cows, whereas the reverse trend was observed for the β-CN, α-LA and ZAG fragments. These results may further deepen our understanding of how milk protein expression is affected by differences in dietary supply (Figure 1b).
Acknowledgments
This research was supported by grants from the National Basic Research Program of the China Ministry of Science and Technology (Grant No. 2011CB100801). The authors gratefully thank Prof. Dr Kyu-Ho Myung from Chonnam National University, Republic of Korea, for providing critical review of the manuscript. We also thank Yvonne Wong from University of Illinois at Urbana and Champaign, USA, for improving the language of the manuscript.