Introduction
The southern Pampas of Argentina preserve one of the most complete late Neogene–Quaternary continental records in midlatitude South America, offering a key setting for reconstructing environmental and climatic evolution. However, despite numerous stratigraphic, faunal, and palynological studies, major uncertainties persist regarding the timing, magnitude, and regional expression of climatic fluctuations, particularly the interplay between aridity/humidity cycles, vegetation shifts, and fluvial reorganization (e.g., Borromei, Reference Borromei1995; Zárate, Reference Zárate2005; Quattrocchio et al., Reference Quattrocchio, Borromei, Deschamps, Grill and Zavala2008). Within this context, the Sauce Grande River Basin (SGRB), stands out as a critical yet under-integrated archive of fluvial, alluvial, and aeolian successions that has not been examined through a comprehensive multiproxy framework.
Paleosols provide exceptionally sensitive records of past surface conditions, as their development is governed by parent material, time, relief, organisms, and climate, whose interactions generate diagnostic pedofeatures (Mack et al., Reference Mack, James and Monger1993; Retallack, Reference Retallack2001). Examining ancient soils has long been central to Quaternary stratigraphy (Ruhe, Reference Ruhe1969; Gile et al., Reference Gile, Hawley and Grossman1981; Birkeland, Reference Birkeland1984; Beilinson, Reference Beilinson2012; Beilinson et al., Reference Beilinson, Gasparini, Soibelzon and Soibelzon2015). Among the most informative approaches is the identification of pedotypes—recurring soil types and pedogenic features that reflect specific environmental conditions (Retallack, Reference Retallack, Amundson, Harden and Singer1994). Their mineralogical, geochemical, and isotopic signatures, particularly those derived from pedogenic carbonates, offer insights into paleo-vegetation, soil moisture, and paleotemperature (Cerling, Reference Cerling1984; Sheldon and Tabor, Reference Sheldon and Tabor2009).
The δ13C values of pedogenic carbonates record the isotopic composition of soil CO₂, which is primarily derived from the respiration of C₃ and C₄ plants. Because these photosynthetic pathways have distinct δ13C ranges (−26‰ to −20‰ for C₃; −14‰ to −10‰ for C₄), the carbonate δ13C provides a reliable proxy for reconstructing the relative abundance of C₃ versus C₄ vegetation through isotopic mixing models (Cerling, Reference Cerling1984; Cerling et al., Reference Cerling, Harris, MacFadden, Leakey, Quade, Eisenmann and Ehleringer1997). Meanwhile, δ1⁸O values reflect the isotopic composition of the soil water from which carbonates precipitate. Soil water δ1⁸O is linked to the δ1⁸O of meteoric precipitation, which varies systematically with temperature, precipitation amount, moisture source, and evaporative enrichment during arid conditions (Cerling and Quade, Reference Cerling, Quade, Swart, Lohmann, McKenzie and Savin1993; Ferguson et al., Reference Ferguson, Cerling and Quade1999; Dworkin et al., Reference Dworkin, Nordt and Atchley2005). Thus, δ1⁸O provides a proxy for paleotemperature and hydrological balance. Combined δ13C–δ1⁸O analyses therefore serve as a powerful tool for reconstructing paleo-vegetation dynamics, soil moisture regimes, and climatic fluctuations in continental environments.
During the Quaternary, the distribution and location of the Earth’s continental masses were broadly similar to the present, and thus oceanic and atmospheric circulation patterns were also comparable. However, cyclical variations in Earth’s climate occurred, alternating between glacial and interglacial periods. In southern South America, these climatic oscillations produced significant glacioeustatic sea-level fluctuations, as evidenced by marine terraces and coastal deposits along the Atlantic margin (Isla et al., Reference Isla, Bértola, Farenga and Cortizo2001). Glacioeustatic processes, combined with climate, directly affected the balance between sediment supply and accommodation space. Gradual transitions to colder and drier conditions in the Late Pleistocene strongly influenced the development of paleosols on floodplains and the establishment of fluvial systems with diverse drainage patterns (Beilinson, Reference Beilinson2011). Although the glaciations did not directly affect the Pampa Interserrana in Buenos Aires Province, their influence is evident in the paleosols, reflecting the conditions they imposed on the region. The late Pliocene to Holocene formations of the SGRB in Buenos Aires Province of Argentina (Fig. 1) provide outcrops of continental deposits that accumulated in fluvial and alluvial environments, where calcareous paleosols developed and were later covered by aeolian deposits (loess) typical of the Pampas plain (Zárate, Reference Zárate2005). Together, these exposures offer an opportunity to refine the regional paleoenvironmental framework and address long-standing discrepancies among existing proxies. The purpose of this study is to reconstruct the paleoenvironmental conditions from the late Pliocene to Holocene in the SGRB, and its temporal evolution, considering relative sea-level changes and glacioeustatic processes. To achieve this, the main analytical tool is the study of paleosols, which serve as valuable records of past environmental and climatic conditions. Through detailed analysis of paleosols, this study contributes to understanding the environmental evolution of southern South America during the Plio-Pleistocene transition and the Quaternary. It provides valuable insights into sedimentary and pedogenetic processes in midlatitude, non-glaciated fluvial systems.
Location map of the Sauce Grande River basin in Argentina. Red stars indicate localities studied: 1, Balneario Saldungaray; 2, La Toma; 3, Corte Ruta 72; 4, Chacra La Blanqueada; 5, El Divisorio; 6, Bajo San José.

Figure 1 Long description
The map depicts the Sauce Grande River basin in Argentina, highlighting studied localities with red stars. The inset shows Argentina with the Pampas and Patagonia regions. Key features include cities like Saldungaray and Bahia Blanca, marked by black dots. The Paso Piedras Dam is indicated by a blue symbol. Provincial routes are labeled as 51 and national routes as 33. Studied localities are numbered: 1, Balneario Saldungaray; 2, La Toma; 3, Corte Ruta 72; 4, Chacra La Blanqueada; 5, El Divisorio; 6, Bajo San Jose. The map includes geographic coordinates and a scale bar for distance measurement.
Geological Background
The SGRB is located in southwestern Buenos Aires Province, Argentina, originating in the Ventania Range and draining its eastern slopes. The SGRB, oriented N-S, flows across the plain, receiving a few tributaries before discharging into the Atlantic Ocean. The basin covers an area of approximately 4600 km2 (Fig. 1).
During the middle Miocene, the Andean uplift triggered the activation of sedimentary basins that developed sequentially from west to east, driven by arc magmatism and the advance of the deformation front (Folguera et al., Reference Folguera, Zárate, Tedesco, D’Avila and Ramos2015). This tectonic phase was marked by high sedimentation rates, interrupted by the Paraná marine transgression in the middle to late Miocene (Marengo, Reference Marengo2006). In Buenos Aires Province and central Argentina, extensive Neogene continental deposits, including Mio-Pliocene sediments, accumulated with thicknesses reaching 100–200 m (Folguera and Zárate, Reference Folguera and Zárate2011). However, these deposits are often concealed by a thin Late Pleistocene–Holocene aeolian cover (Folguera and Zárate, Reference Folguera and Zárate2009).
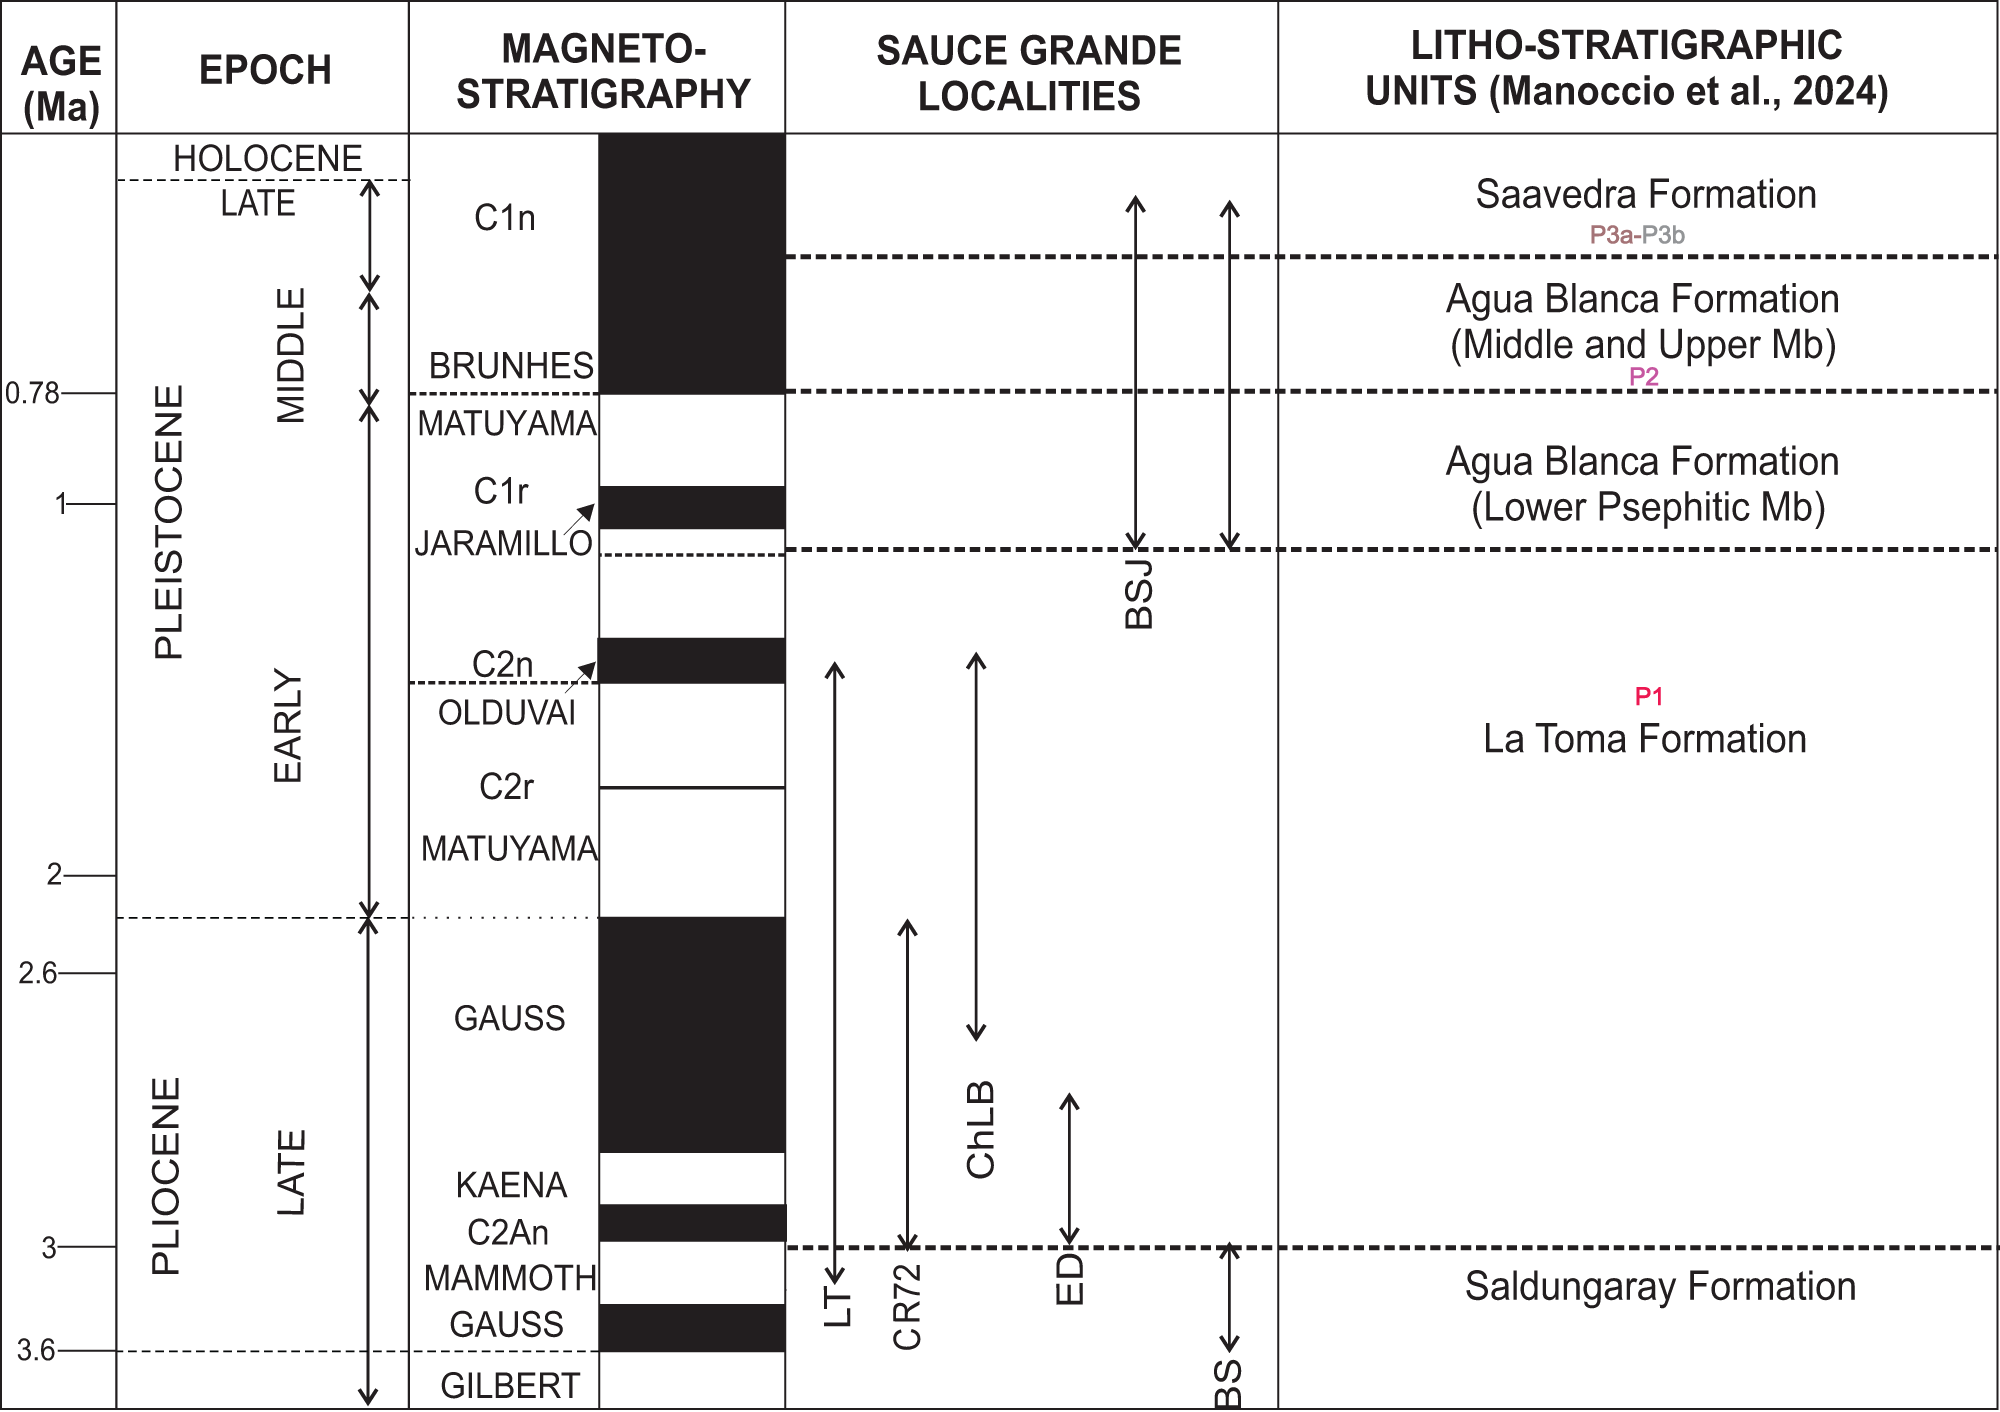
During the mid-late Pliocene to Early Pleistocene, regional erosion carved wide valleys into the Mio-Pliocene substrate, including the SGRB (Rabassa, Reference Rabassa1982; Zavala and Quattrocchio, Reference Zavala and Quattrocchio2001). Positive accommodation resumed afterward, initiating Pleistocene deposition. Previous studies (Manoccio et al., Reference Manoccio, Beilinson, Raigemborn, Gasparini, Barendregt, Clague and Rabassa2024) on the evolution of the SGRB, using methodologies such as geomorphological and paleomagnetic analyses, established temporal relationships and relative ages for the sedimentary units in the region (Fig. 2).
Late Pliocene to Holocene stratigraphy of the study area in the Sauce Grande River basin in Argentina (modified from Manoccio et al., Reference Manoccio, Beilinson, Raigemborn, Gasparini, Barendregt, Clague and Rabassa2024). Ages range for BSJ and BS taken from Rabassa, Reference Rabassa1989. LT, La Toma; CR72, Corte Ruta 72; ChLB, Chacra La Blanqueada; ED, El divisorio; BSJ, Bajo San José; BS, Balneario Saldungaray. P1, Calcisols; P2, Calcic Protosols; P3, Protosols.

Figure 2 Long description
The chart has five columns: Age (Ma), Epoch, Magneto-stratigraphy, Sauce Grande Localities and Litho-stratigraphic Units. Row 1: Age 0.78 Ma, Epoch Holocene Late, Magneto-stratigraphy C1n, Localities blank, Litho-stratigraphic Units Saavedra Formation. Row 2: Age 1 Ma, Epoch Pleistocene Middle, Magneto-stratigraphy Brunhes, Localities blank, Litho-stratigraphic Units Agua Blanca Formation (Middle and Upper Mb). Row 3: Age 2 Ma, Epoch Pleistocene Early, Magneto-stratigraphy Matuyama, Localities BSJ, Litho-stratigraphic Units Agua Blanca Formation (Lower Psephitic Mb). Row 4: Age 2.6 Ma, Epoch Pliocene Late, Magneto-stratigraphy Gauss, Localities LT, CR72, ChLB, ED, BS, Litho-stratigraphic Units La Toma Formation. Row 5: Age 3 Ma, Epoch Pliocene Late, Magneto-stratigraphy Kaena, Localities blank, Litho-stratigraphic Units Saldungaray Formation.
Fluvial terraces preserved at multiple levels record alternating phases of incision and infilling, incorporating alluvial, aeolian, and ephemeral fluvial deposits to the succession (Zárate, Reference Zárate2003, Reference Zárate2005). The Neogene substrate is dominated by brown silts and sandy silts of fluvial origin, with paleosols that have carbonate features such as nodules and rhizoconcretions observed throughout the sequence (Folguera and Zárate, Reference Folguera and Zárate2011).
The deposits analyzed in this study span the late Pliocene to the Holocene. The oldest unit comprises reddish silts of the Saldungaray Formation, attributed to the late Pliocene based on stratigraphic relationships and fossil content (Furque, Reference Furque1973). Overlying these are the fluvial deposits of the La Toma Formation, which have undergone pedogenetic modification and are assigned to the late Pliocene–Early Pleistocene, late Gauss chron (C2An) based on lithological characteristics, paleomagnetic data, and fossil records (Manoccio et al., Reference Manoccio, Beilinson, Raigemborn, Gasparini, Barendregt, Clague and Rabassa2024). The Quaternary infill of the SGRB starts with the Agua Blanca Formation (Mid–Late Pleistocene) (Rabassa, Reference Rabassa1989). The middle member of this formation, assigned to the Brunhes chron (C1n; Manoccio et al., Reference Manoccio, Beilinson, Raigemborn, Gasparini, Barendregt, Clague and Rabassa2024), exhibits the development of paleosols. Finally, the sequence is capped by the Saavedra Formation (middle Late Pleistocene–Holocene), characterized by fine sediments with paleosols (Fig. 2).
Detailed descriptions of facies, facies associations, and architecture of the formations that represent the late Pliocene to Holocene deposits of the SGRB are presented in Table 1 (modified from Manoccio et al., Reference Manoccio, Beilinson, Raigemborn, Gasparini, Barendregt, Clague and Rabassa2024).
Facies and facies associations in the Sauce Grande River basin, Buenos Aires Province, Argentina.

Table 1 Long description
Columns list facies associations, facies assemblages, geometry, and interpretation. Under, FA I fluvial channels, assemblage FA I a has facies, Gcm, St, Sh, Sm, ribbon bodies with concave up geometry from an irregular erosional base to an irregular surface, interpreted as simple fluvial sand channels. Assemblage FA I b has facies, Gmm, Gp, Sm, Fm, concave up geometry from an irregular erosional base, interpreted as simple fluvial gravel channels. Assemblage FA I c has facies, Gp, Gh, Gs, Gcm, Gmm, Ss, Sm, Sh, Fm, Gt, multiepisodic tabular channels, interpreted as multistory sandy gravel fluvial channels. FA II floodplain deposits list facies, Sm, Fl, Fm, tabular bodies with erosive surfaces and pedogenic features, interpreted as deposition from unconfined flow related to episodic overbank flows. FA III aeolian deposits list facies, Fm, Fl, tabular bodies, interpreted as distal floodplain, aeolian deposits.
The localities studied in this contribution focus on the upper basin, specifically Balneario Saldungaray (BS), La Toma (LT), Corte Ruta 72 (CR72), Chacra La Blanqueada (ChLB), El Divisorio (ED), and one locality in the middle basin, Bajo San José (BSJ) (Fig. 1). These outcrops, ranging from 4 to 8 m thick, are exposed in quarries and along riverbanks.
Methodology
Identification and description of the paleosols
This research presents a high-resolution study of the paleosols found in late Pliocene to Holocene deposits exposed in outcrops along both margins of the SGRB, where paleopedological profiles at a scale of 1:50 were described (Fig. 3), representing an extension and refinement of the stratigraphic framework proposed by Manoccio et al. (Reference Manoccio, Beilinson, Raigemborn, Gasparini, Barendregt, Clague and Rabassa2024) and incorporating additional observations from our fieldwork.
Stratigraphic profiles with pedotypes and locations of the stable isotopes and geochemistry analysis for the study area in the Sauce Grande River basin in Argentina.

Figure 3 Long description
Stratigraphic profiles from various locations in the Sauce Grande River basin, labeled from left to right as Balneario Saldungaray, Corte ruta 72, La Toma, Chacra la Blanqueada, El Divisorio and Bajo San Jose. Each profile is vertically segmented into different stratigraphic units, such as the Saavedra Formation, Agua Blanca Formation and La Toma Formation, indicated by abbreviations like Sav. Fm, AB. Fm and LT. Fm. The profiles display various lithologies, including gravel, silt-sand and mud-silt, represented by different patterns. Sedimentary structures like horizontal bedding, trough cross-bedding and massive structures are marked with specific symbols. Macropedological features such as bioturbation and carbonate nodules are also indicated. Facies associations are labeled as FA-Ia, FA-Ib, FA-Ic and FA-III, representing different depositional environments like simple sand channels and aeolian deposits. Pedotypes are marked as P1, P2 and P3, with geochemical and stable isotope sample locations denoted by stars and circles. A legend at the bottom provides explanations for the symbols and abbreviations used in the profiles.
Paleosols were identified as pedotypes based on field observations. Additionally, a micromorphological analysis was also undertaken. Macroscopic pedofeatures in each horizon, such as grain size, sedimentary structures, colors (described according to the Munsell Soil Color Charts [Munsell Color, 2013]), nodules, mottles, and rhizoliths, were described following Retallack (Reference Retallack2001).
Bulk and in situ samples were collected from the central sector of the horizons, and a Kubiëna box was used to preserve the structures. More than 40 samples were impregnated with epoxy resin, and petrographic thin sections were prepared in the Centro de Investigaciones Geológicas laboratory in order to determine the porosity, microstructure, pedofeatures, microfabrics, grain size, and groundmass.
Micromorphological descriptions of paleosols follow the terminology of Stoops (Reference Stoops2003) and Stoops et al. (Reference Stoops, Marcelino and Mees2018). Carbonate microfabrics are classified according to the alpha–beta system of Wright (Reference Wright1990). All thin sections (P1, P2, P3) are described following the structured sequence proposed by Bullock et al. (Reference Bullock, Fedoroff, Jongerius, Stoops and Tursina1985, appendix II), including components, c/f-related distribution, b-fabric, microstructure, voids, and pedofeatures.
Paleosols were first grouped into pedotypes, defined on the basis of field and laboratory characteristics. Classification was subsequently carried out using the specific paleosol classification proposed by Mack et al. (Reference Mack, James and Monger1993), followed by comparison with the Soil Taxonomy system (Soil Survey Staff, 2022) as adapted for paleosols by Nordt et al. (Reference Nordt, Stinchcomb, McCarthy and Driese2025).
Analytical methods
X-ray diffraction
To characterize mineralogy, X-ray diffraction (XRD) analyses were carried out on bulk powder (whole-rock) samples as well as on the <2 µm clay fraction (Table 2). Clay mineralogy was determined from XRD patterns. The PANalytical X’Pert PRO diffractometer (Centro de Investigaciones Geológicas, La Plata, Argentina) was applied, using Cu radiation (Kα = 1.5405 Å) and Ni filter and generation settings of 40 kV and 40 mA. Routine air-dried mounts were run between 2° and 32° 2θ at a scan speed of 2° 2θ/min. Ethylene glycol–solvated and heated samples were run from 2° to 27° 2θ and 3° to 15° 2θ, respectively, at a scan speed of 2° 2θ/min. Semi-quantitative estimations of the relative percentages of clay minerals were based on the peak area method (Biscaye, Reference Biscaye1965) on glycolate samples by applying empirical factors (Moore and Reynolds, Reference Moore and Reynolds1989; Raigemborn et al., Reference Raigemborn, Gómez-Peral, Krause and Matheos2014). The mineralogical components are classified according to the following percentages: extremely abundant (>80%); very abundant (60–80%); abundant (40–60%); moderate (20–40%); scarce (1–20%); traces (<1%). Diagnostic d-spacing values (Å) used for mineral identification included quartz (4.26, 3.34), calcite (3.85, 3.04), K-feldspars (3.24, 2.98), plagioclase (4.00, 3.19), illite (10.0, 5.0, 3.33), smectite (12.5–15 Å air-dried; 17 Å glycolated), and kaolinite (7.16, 3.58). Identification was based on peak position and relative intensity, supported by glycolation and heating to discriminate phyllosilicates.
X-ray diffraction (XRD) analysis of paleosol samples from the Sauce Grande River basin, Buenos Aires Province, Argentina.

Table 2 Long description
Columns list pedotypes and horizons, with whole rock values for Qtz, Fk, Plg, Clay, and Ca, and clay fraction values for Sm, I, and K. Pedotype P1 has horizons 2Bk, 2Bk, 3Bk1, and 3Bk2 with whole rock Qtz 10, 18, 32, and 18; Fk 2, 3, 10, and 3; Plg 2, 3, 9, and 4; Clay 7, 2, 5, and 7; and Ca 79, 74, 44, and 68. For P1 clay fraction, I is 95, 91, 40, and 17, and K is 5, 9, 60, and 83; Sm is blank in all P1 rows. Pedotype P2 horizon ACk has whole rock Qtz 56, Fk 6, Plg 30, Clay 4, and Ca 4, with clay fraction Sm 65, I 34, and K 2. Pedotype P3a has two Bw rows: first has whole rock Qtz 60, Fk 23, Plg 12, Clay 5, Ca blank, with clay fraction I 98 and K 2 and Sm blank; second has whole rock Qtz 62, Fk 17, Plg 9, Clay 10, Ca 2, with clay fraction I 98 and K 2 and Sm blank. Pedotype P3b horizon Bw has whole rock Qtz 64, Fk 16, Plg 16, Clay 4, Ca blank, with clay fraction I 54 and K 46 and Sm blank.
a Qtz, quartz; Fk, potassic feldspar; Plg, plagioclase; Ca, calcite.
b Sm, smectite; I, illite; K, kaolinite.
Geochemistry
Ten paleosol samples from diagnostic horizons (Bk and Bw) were analyzed using inductively coupled plasma mass spectrometry (ICP-MS) at ALS-Global (Mendoza, Argentina). Geochemical analyses of paleosol samples were performed on powdered materials from individual horizons and used to calculate paleosol molecular indices and characterize the pedogenic processes. Major oxide concentrations originally expressed as weight percentages were converted to molar proportions by dividing each oxide value by its molecular mass before solving the index equations.
For weathering processes, we used two indexes: Chemical Index of Alteration without Potassium (CIA-K; Maynard, Reference Maynard1992), where CIA-K = 100 × [(Al/(Al + Ca + Na))], and Paleosol Weathering Index (PWI; Gallagher and Sheldon, Reference Gallagher and Sheldon2013), where PWI = 100 × [(4.20 × Na) + (1.66 × Mg) + (5.54 × K) + (2.05 × Ca)]. Proxies for hydrolysis include alkaline earth elements, loss of exchangeable bases, Σ (Ca, Na, K, Mg)/Al (Retallack, Reference Retallack2001), and clayness (Al/SI) (Sheldon and Tabor, Reference Sheldon and Tabor2009). One additional chemical index was used to calculate dominant pedogenic processes in each paleosol, the Salinization Index, where SAL = (K2O + Na2O)/Al2O3 (Retallack, Reference Retallack2001), and the Ba/Sr ratio served as a proxy for leaching (Sheldon, Reference Sheldon2006).
Stable Isotopes
Paleosol samples were selected from carbonate-rich horizons in two representative profiles (Chacra La Blanqueada and Bajo San José; Fig. 1), based on the presence of pedogenic features such as nodules and rhizoconcretions. Pedogenic carbonate nodules and rhizoconcretions were ground using a drill in the Mesoscopic Laboratory at the Centro de Investigaciones Geológicas (Argentina). The proportions of δ13C and δ18O in calcite were determined by reacting approximately 1 mg of powdered material with 100% anhydrous phosphoric acid at 72°C for 4 hours. The stable carbon and oxygen isotopic compositions were analyzed using a Continuous Flow-Isotope Ratio Mass Spectrometer Thermo-Finnigan DeltaPlusXP, coupled with a Thermo-Finnigan Gas Bench II, at the ALS laboratory (Mendoza, Argentina). The δ13C and δ18O values are reported using the delta (δ) notation in per mil (‰) relative to Vienna Pee Dee Belemnite (VPDB) and Vienna Standard Mean Ocean Water (VSMOW), respectively, with a precision of 0.2‰. For comparative purposes, δ1⁸O values expressed in the VSMOW scale were converted to the VPDB scale using the following equation: δ1⁸O (VPDB) = δ1⁸O (VSMOW) − 30.86/1.03086 (Friedman and O’Neil, Reference Friedman and O’Neil1977).
For interpretative purposes, δ13C values of pedogenic carbonates are understood to reflect the isotopic composition of soil CO₂, which is dominated by the respiration of C₃ and C₄ vegetation with distinct isotopic ranges. Thus, δ13C enables inference of the relative contributions of C₃ versus C₄ plants. Similarly, δ1⁸O values track the isotopic composition of meteoric water incorporated during carbonate precipitation, which varies with temperature, precipitation amount, and evaporative effects. These principles underpin the use of δ13C–δ1⁸O as paleoenvironmental proxies.
Paleotemperatures were estimated from δ1⁸O values of pedogenic carbonates using the empirical relationship of Cerling and Quade (Reference Cerling, Quade, Swart, Lohmann, McKenzie and Savin1993) as applied by Dworkin et al. (Reference Dworkin, Nordt and Atchley2005), assuming equilibrium precipitation from meteoric water. Mean annual temperatures were calculated using:
 \begin{equation*}{{{\delta }}^{18}}\,{\bigcirc}_p {\text{c}}\left( {{\text{PDB}}} \right) = 0.49\;T - 12.65\end{equation*}
where T is temperature (in °C) and δ1⁸OPc corresponds to the isotopic composition of pedogenic carbonates measured in this study. The calculation assumes shallow-soil carbonate formation under meteoric water conditions consistent with regional paleohydrological settings (Cerling and Quade, Reference Cerling, Quade, Swart, Lohmann, McKenzie and Savin1993; Dworkin et al., Reference Dworkin, Nordt and Atchley2005).
Results
Stratigraphy and sedimentology
To the stratigraphic framework previously established by Manoccio et al. (Reference Manoccio, Beilinson, Raigemborn, Gasparini, Barendregt, Clague and Rabassa2024), two new profiles were added at the Bajo San José and Balneario Saldungaray localities (Figs. 1 and 3). There, a previously unrecognized architectural element was identified. This element was defined as Facies Association FA-I c and interpreted as multistory sandy-gravel channels (Table 1).
General descriptions of the paleosols
In the studied localities, several pedogenetically modified beds have been identified. Based primarily on macroscopic (field) and micromorphological observations, three main pedotypes were recognized (P1, P2, P3) (Table 3). Additional mineralogical (XRD), geochemical (ICP-MS), and isotopic analyses were conducted to further characterize their development and paleoenvironmental significance.
Main characteristics of the pedotypes in the Sauce Grande River basin, Buenos Aires Province, Argentina.

Table 3 Long description
Pedotypes P1, P2, P3a, and P3b are listed with profiles, facies associations, horizons, thickness in meters, macrofeatures, microfeatures, pedofeatures, clay minerals, carbon isotope values, oxygen isotope values, and a weathering index column. P1 includes four horizons in floodplain deposits, two 2Bk horizons each 1 m thick, plus 3Bk1 at 0.50 m and 3Bk2 at 1.7 m, with macrofeatures including fine sand colors from light brownish gray to reddish brown, massive to subangular blocky structure, carbonate rhizoliths, and Fe Mn oxide nodules. P1 clay minerals shift from smectite dominant in the 2Bk horizons at 95 percent then 91 percent, to illite dominant in 3Bk1 at 60 percent and 3Bk2 at 83 percent; delta 13C is listed for 3Bk1 as minus 8.7 to minus 8.7 and for 3Bk2 as minus 8.9 to minus 9.4, and delta 18O is listed for 3Bk1 as minus 4.90 to minus 5 and for 3Bk2 as minus 5.48 to minus 4.90. P2, from floodplain deposits and fluvial sandy channels, has horizon ACk with thickness 1 m and macrofeatures including light yellowish brown and grayish brown colors, carbonate rhizoliths with dimensions 1 cm by 3 to 4 cm and branching, concentric carbonate nodules, and Fe Mn nodules under 0.5 cm; clay minerals are smectite 65, illite 34 percent, and kaolinite 2 percent, with delta 13C listed as minus 7.4, minus 6.2, and minus 3.5 and delta 18O listed as minus 2.89, minus 3.85, and minus 3.85. P3a, from floodplain and aeolian deposits, has horizon Bw at 0.90 m with smectite 98 percent and illite 2 percent, and the weathering index column lists salinization index about 0.33, alumina ratio coefficient about 0.15, paleosol weathering index about 50, bases to aluminum about 1.08, and chemical index of alteration without potassium about 58. P3b, from Balneario Saldungaray, has thickness 0.63 m with smectite 54 percent and illite 46 percent, and the weathering index column lists salinization index about 0.40, alumina ratio coefficient about 0.14, paleosol weathering index about 45, bases to aluminum about 0.88, and chemical index of alteration without potassium about 68.
a ARC, Alumina Ratio Coefficient; CIA-K, Chemical Index of Alteration without Potassium; PWI, Paleosol Weathering Index; SAL, Salinization Index.
Pedotype 1 (P1)
This pedotype is represented in the upper basin, specifically in La Toma section. It develops on the upper part of the Saldungaray and La Toma formations, modifying deposits of floodplain origin (FA-II; see Table 1). It is characterized by massive silty clay to fine sand deposits (Fm-Sm) with light brownish-gray (10YR 6/2), pale brown (10YR 6/3), reddish-brown (5YR 5/4), and yellowish-brown (10YR 5/4) colors.
A thin A–C horizon corresponding to the modern soil overlies the exposure and is not considered part of Pedotype 1. Pedotype 1 has a total thickness of 2.20 m (4A and B). The vertical sequence can be summarized as A-C (actual soil)–2Bk-2C–3Bk1-3Bk2-3C.
The 2Bk horizon varies from 0.60 m to 1.5 m and shows fine sandy to clay textures with massive structure (4C) and high porosity. Macroscopically, Fe-Mn oxide nodules are observed. Microscopically, the microstructure is weak subangular blocky to massive, characterized by fine vughs, chambers, and irregular compound packing voids. Textures range from silty clay to very fine sand. The coarse fraction (>30 μm) includes quartz, feldspars, and plagioclase, whereas the micromass (<30 μm) is dominated by micritic carbonate and contains clay- and silt-sized particles and occasional siliceous spicules. The micromass displays a yellowish to light brown color and a stipple-speckled to locally crystallitic b-fabric. The coarse/fine (c/f30) ratio ranges from 1:99 to 10:90, with an open porphyric-related distribution pattern. Pedofeatures, such as rhizoconcretions (sensu Klappa, Reference Klappa1980), micritic and microsparitic coatings (4D), micritic nodules, and Fe-Mn oxide nodules, are common. Additionally, alveolar-septal structures, calcified pellets, and peloidal microaggregates are present (4E).
XRD analysis of the 2Bk horizons identified and semi-quantified the following mineral species: extremely abundant carbonate (71–79%), moderate quartz (10–18%), scarce clay (2–7%), scarce feldspar and plagioclase (3%). The clay mineralogy is dominated by smectite (91–95%) and minor illite (5–9%) (Fig. 4, Table 2). Geochemical analysis of the 2Bk horizons showed major oxide concentrations summarized in Table 4.
Pedotype 1 (P1): (A) field photograph of The La Toma site; (B) outcrops, macrofeatures, representative profile, and X-ray diffraction (XRD) analysis; (C) outcrops, macrofeatures, representative profile and XRD analysis; (D) Micritic and microsparitic calcite coating (XN); (E) alveolar-septal structure and peloidal microaggregates (PN); (F) sparitic nodules and Fe and Mn oxides (XN); (G) planar voids indicated with a yellow arrow and Fe and Mn oxide hypo-coatings marked with an orange arrow (PN); (H) granostriated b-fabric in the Bk horizon (XN); (I) needle-fiber calcite and microsparitic calcite coatings; (J) complete microsparitic calcite infilling indicated with a yellow arrow, micritic coating with a blue arrow, and Fe and Mn oxide nodules with a red arrow; (K) microphotograph of microsparitic calcite halos around voids and aggregates, and micritic nodules (XN). PN, parallel nicols; XN, crossed nicols.

Figure 4 Long description
The infographic is divided into sections labeled ′Macrofeatures and XRD Analysis′ and ′Microfeatures′ for Pedotype 1. In the macrofeatures section: - Image A shows a field photograph with yellow lines indicating different soil layers at 150 cm scale. - Image B displays a close-up of the outcrop scale with rhizoliths marked at 75 cm. - Image C illustrates soil profiles labeled 2Bk, 3Bk1 and 3Bk2 with corresponding depths of 2.10 m, 1.30 m and 2.20 m. - XRD analysis charts show clay mineralogy and whole rock composition for each profile, indicating percentages of illite, smectite and caolinite. In the microfeatures section: - Image D shows a microphotograph with a scale of 0.05 mm. - Image E displays another microphotograph at 0.5 mm scale. - Image F shows a microphotograph at 0.2 mm scale. - Image G highlights planar voids and hypo-coatings of Fe and Mn oxides with arrows at 0.1 mm scale. - Image H shows a microphotograph at 0.05 mm scale. - Image I highlights needle-fiber calcite at 0.2 mm scale. - Image J shows micritic coating and complete sparitic infilling with arrows at 0.2 mm scale. - Image K displays microsparitic halos at 0.2 mm scale.
Geochemical samples of the different horizons with the percentage weight of major oxides and pedogenetic indices of each horizon in the Sauce Grande River basin, Buenos Aires Province, Argentina.

Table 4 Long description
Ten samples labeled 3Bk2, 2Bk, ACk, and Bw report percent weight of major oxides for SiO2, Al2O3, Fe2O3, CaO, MgO, Na2O, K20, Cr2O3, TiO2, MnO, P205, SrO, and BaO. SiO2 spans 23.8 percent in sample 2Bk to 61.7 percent in sample 7 ACk, with most other samples between 47.9 and 61.6 percent. CaO ranges from 1.91 percent in sample 10 Bw to 33.3 percent in sample 2Bk, with sample 4 ACk also high at 25.3 percent. Al2O3 ranges from 6.41 percent in sample 2Bk to 16.05 percent in sample 3 ACk, and Fe2O3 ranges from 2.63 percent in sample 2Bk to 6.37 percent in sample 3 ACk. Minor oxides include Cr2O3 from 0.005 to 0.01 percent, TiO2 from 0.38 to 0.98 percent, MnO from 0.06 to 0.11 percent, P205 from 0.08 to 0.26 percent, SrO from 0.01 to 0.03 percent, and BaO from 0.02 to 0.06 percent. Pedogenic indices are listed for each sample: Bases, Al over bases, Al over Si, K plus Na over Al, CIA, CIA K, PWI, Ti over Al, Bases over Ti, and Ba over Sr. CIA ranges from 9.27 in sample 2Bk to 61.11 in sample 10 Bw, and PWI ranges from 44.94 in sample 10 Bw to 196.20 in sample 2Bk. Bases over Ti ranges from 12.83 in sample 3 ACk to 134.68 in sample 2Bk, and Ba over Sr ranges from 0.677 in sample 6 Bw to 1.35 in samples 2Bk, 7 ACk, 9 ACk, and 10 Bw.
The 3Bk1 horizon (0.50 m thick) develops in fine facies (Fm, Sm) and displays a massive structure with carbonated rhizoliths and concentric Fe-Mn oxide nodules (4B). At a microscale, it shows a weak subangular blocky microstructure composed of fine to very fine sand-sized peds. Porosity is dominated by fine to medium vughs and planar simple packing voids, locally interconnected to form compound packing voids. The coarse fraction (>30 μm) is made up of quartz, plagioclase, and feldspar with a low degree of alteration. The micromass (<30 μm) is composed mainly of micritic carbonate and clays, displaying a yellowish-brown color with a stipple-speckled b-fabric. The c/f ₃₀ ratio ranges from 2:98 to 15:85 with an open porphyric-related distribution pattern. Organic components are represented by rhizoliths and minor amorphous organic matter dispersed within the matrix. Pedofeatures include micritic coatings, complete dense microsparitic calcite infillings (crystallaria sensu Wright, Reference Wright1990), sparitic nodules with diffuse margins (4F), and Fe-Mn oxide nodules. This horizon exhibits specific characteristics of a Bk horizon (crystallitic b-fabric, grain size, disseminated carbonate, pedofeatures).
XRD analysis of the 3Bk1 horizon identified and semi-quantified the following mineral species: abundant carbonate (44%), moderate quartz (32%), scarce feldspar and plagioclase (9–10%), scarce clay (5%). The clay mineralogy is dominated by illite (60%) and smectite (40%) (Fig. 4, Table 2).
The 3Bk2 horizon (up to 1.70 m thick) develops in fine-grained facies (Fm), with a subangular blocky structure and Fe-Mn oxide concretions (4A and B). Microscopically, it displays a subangular blocky microstructure, with porosity dominated by fine to medium planar voids and irregular vughs, some of which are partially or completely filled with microsparitic to sparitic calcite (4G). The coarse fraction (>30 μm) consists of quartz, plagioclase, altered feldspar, and silty aggregates. The micromass (<30 μm) is dominated by micritic carbonate and clays, showing a yellowish-brown color with a granostriated b-fabric (4H). The c/f30 ratio ranges from 1:99 to 10:90, with an open porphyric-related distribution pattern. Organic constituents are rare or absent. Pedofeatures are abundant and include discontinuous diffuse Fe and Mn oxide hypo-coating (4G), needle-fiber calcite and microsparitic calcite coatings, complete crystallaria infillings (4I and J), microsparitic halos, and peloidal to grumose carbonate aggregates (4K). Crystalline carbonate domains associated with a crystallitic b-fabric. Concentric Fe-Mn oxide nodules and micritic carbonate nodules are also present.
XRD analysis of the 3Bk2 horizons identified and semi-quantified the following mineral species: very abundant carbonate (68%), moderate quartz (18%), scarce clay (7%), and scarce feldspar and plagioclase (3–4%). The clay mineralogy is dominated by illite (83%) and smectite (17%) (Fig. 4, Table 2).
Pedogenetic indices for a single 3Bk2 horizon were as follows: PWI = 72, CIA-K = 44.9, SAL = 0.32, Ti/Al =0.06, Ba/Sr = 1.12, Σ Bases/Al = 1.802, clayeyness = 0.16 (Table 4).
Pedotype 2
This pedotype is represented in Bajo San José and Chacra La Blanqueada profiles (Fig. 3), in sediments corresponding to the Middle Member of Agua Blanca Formation (Late Pleistocene–Holocene). The soil profile is poorly developed and consists of ACk horizons (5A). It develops over floodplain deposits (FA-II) and fluvial sandy channels (FA-I a; see Table 1).
Pedotype 2 (P2): (A) representative profiles of Pedotype 2 include details of clay mineralogy via X-ray diffraction (XRD); (B) ACk horizon with branched carbonate rhizoliths; (C) Fe-Mn oxide nodules in ACk horizons, highlighted with yellow dashed circles; (D) carbonate nodules indicated by yellow arrows; (E) microsparitic calcite coatings in voids, marked with a yellow arrow (PN); (F) sparitic and micritic carbonate nodules with edges outlined by yellow dashed lines (XN); (G) void coatings of Fe-Mn oxides (XN); (H) Typical Fe-Mn oxide nodules (PN). PN, parallel nicols; XN, crossed nicols.

Figure 5 Long description
A composite scientific figure arranged in two rows with eight labelled sub images, A through H, separated by two horizontal header bands. Text present in English includes, Pedotype 2, Macrofeatures and XRD analysis and Microfeatures. The image A showing a block style soil profile diagram with a depth scale labelled 0m at the top and 1.00m at the bottom. The horizon label reads ACk. The image B showing two grouped horizontal bar charts titled Clay Mineralogy and Whole Rock. Each chart has a percent scale with tick labels 0 percent, 50 and 100. A legend lists Clay Mineralogy, Illite, Smectite, Kaolinite and Whole Rock, Qz, Kf, Pl, Ar and C. Additional text below reads Carbonatic Nodules and Bioturbation. The image C showing a close view of soil material with a hand holding a brush. Text on the image reads Rhizoliths and ACk Hz. The image D showing two close views of soil material with overlaid labels. One label reads Fe Mn Nodules. Another label reads Carbonate nodules. A scale label reads 2cm. The image E showing a micrograph view with a scale label reading 0.1mm. The image F showing a micrograph view with text reading Micritic nodule and a scale label reading 0.1mm. The image G showing a micrograph view with text reading Hz AB and a scale label reading 0.2mm. The image H showing a micrograph view with text reading Fe Mn nodules and a scale label reading 0.2mm.
These ACk horizons (0.5–1 m), exhibit a silty to fine sand texture and light yellowish-brown (10YR 6/4) and grayish-brown (10YR 5/2) colors. The most conspicuous pedofeatures are calcium carbonate rhizoliths, which vary in size (1 cm wide by 3–4 cm high) and show different degrees of branching (5B) as well as concentric Fe-Mn oxide nodules, smaller than 0.5 cm in diameter (5C) and concentric carbonate nodules (5D). At the microscopic scale, the ACk horizons exhibit silt-clay and very fine sand textures and a predominantly massive to weakly granular microstructure. Porosity includes chambers and cavities (5E), locally interconnected to form irregular compound voids. The coarse fraction (>30 μm) is predominantly composed of quartz, followed by plagioclase, feldspar, biotite, oxides, and carbonates, with moderate to low alteration degree. Some organic remains, including tissue fragments, are also present. The micromass (<30 μm) is mainly composed of micritic carbonate with a yellowish-brown color. The c/f30 ratio ranges from 1:99 to 25:75, and the groundmass shows an open porphyric-related distribution. Pedofeatures include micritic nodules (5F), Fe-Mn oxide coatings within voids (5G), and typical Fe-Mn oxide nodules (5H).
XRD analysis of the ACk horizons revealed the presence of abundant quartz (56%), moderate plagioclase (30%), scarce feldspar content (6%), scarce carbonate (4%), and scarce clay (4%). The clay mineralogy is dominated by smectite (65%) and illite (34%), with minor kaolinite (2%) (5A, Table 2).
Geochemical analysis of the ACk horizons showed major oxide concentrations are represented in Table 4.
Pedotype 3
This pedotype is present in Balneario Saldungaray, Chacra La Blanqueada, and Bajo San José (Fig. 3). It developed in floodplain and aeolian deposits (FA-II–FA-III) (Table 1).
The soil profile consists of Bw horizons, which in some cases display vertic features (Pedotype 3a [P3a]), and in others, illuviation features (Pedotype 3b [P3b]) (Fig. 6). This pedotype is found in the Lower Member of the Saavedra Formation (Late Pleistocene–Holocene).
Pedotype 3 (P3): (A) representative profile of the pedotype P3a, including details of total rock mineralogy and clay mineralogy (X-ray diffraction [XRD] analysis); (B) Bw horizon with blocky aggregates; (C) striated b-fabric (PN); (D) planar voids forming wedge-shaped aggregates (PN); (E) micritic carbonate hypo-coatings, indicated by a yellow arrow (PN); (F) representative profile of the pedotype P3b, including details of total rock mineralogy and clay mineralogy (XRD analysis); (G) field photograph of the Bw horizon; (H) Fe-Mn oxide nodules in hand sample; (I) fabric-porosity and grain-striated features, with blue and orange arrows indicating the arrangement of clays (XN); (J) chambers with illuvial clay coatings (PN); (K) illuvial clay cutans marked with blue arrows, compound cutans, illuvial clay, Fe-Mn oxides with marked with yellow arrows, and Fe-Mn oxide nodules marked with red arrows (PN). PN, parallel nicols; XN, crossed nicols.

Figure 6 Long description
A two column scientific layout titled, PEDOTYPE 3. A header reads, MACROFEATURES AND XRD ANALYSIS and a lower header reads, MICROFEATURES. The left column is labeled, P3A and the right column is labeled, P3B. In the P3A column under, MACROFEATURES AND XRD ANALYSIS, a soil profile block is shown with depth marks, 0 m at the top and 0.90 m at the bottom. Next to it is a small chart area labeled, Clay Mineralogy and, Whole Rock, with percent scales marked 0, 50, 100. Text below reads, Bw and, Subangular blocky structure. A field photo includes the label, Bw hz and a scale label, 10 cm. In the P3B column under, MACROFEATURES AND XRD ANALYSIS, a soil profile block is shown with depth marks, 0 m at the top and 0.63 m at the bottom and the label, Bw. Next to it is a small chart area labeled, Clay Mineralogy and, Whole Rock, with percent scales marked 0, 50, 100. A field photo includes the labels, 75 cm, Fluvial channel and, Bw hz. Another photo includes the label, Fe-Mn Nodules. Under, MICROFEATURES, the P3A column shows three microscope images with scale labels, 0.1 mm, 0.5 mm and 0.5 mm. The rightmost microfeature image includes the text, Micritic Hipocoatings. Under, MICROFEATURES, the P3B column shows three microscope images with scale labels, 2 mm, 0.1 mm and 0.1 mm. The leftmost microfeature image contains multiple arrows. The rightmost microfeature image includes the labels, Clay infillings and, Clay and Fe-Mn infillings and, Fe-Mn nodules.
Pedotype 3a. The Bw horizon (0.90 m), is characterized by a fine sandy silt texture and light grayish-brown matrix colors (10YR 5/2), with an angular to subangular blocky aggregate structure (6A and B). Macroscale pedogenic features include iron-manganese oxide nodules and planar voids. In addition, a high content of sedimentary and volcanic lithics is present.
Microscopically, the Bw horizons display silty to very fine sand textures and a subangular blocky microstructure. The coarse fraction (>30 μm) consists of quartz, plagioclases, feldspars (locally highly weathered), lithic fragments, Fe-Mn oxides, and micritic carbonate. Phytoliths of variable sizes were also identified. The micromass (<30 μm) is light to dark brown and composed of clays, oxides, and subordinate micritic carbonate. The b-fabric is striated (6C). The c/f30 ratio ranges from 1:99 to 5:95, with an open porphyric-related distribution pattern. Void systems include planar voids and chambers; in some cases, planar voids form wedge-shaped aggregates, suggesting minor shrink–swell dynamics (6D). Pedality is moderate and strongly developed. The most conspicuous pedofeatures are associated with voids, such as impregnated hypo-coatings of micritic carbonate in planar voids (6E). Others pedofeatures include Fe-Mn oxide nodules, moderately impregnated, which exhibit typical textures.
XRD analysis of the Bw horizons revealed the presence of very abundant quartz (∼61%), moderate feldspar (∼20%), scarce plagioclase (∼10%), scarce clay (∼8%), and scarce carbonate (2%). The clay mineralogy is dominated by smectite (98%) with minor illite (2%) (6A, Table 2).
Geochemical analysis of Bw horizons revealed major oxide contents represented in Table 4. The Bw horizon exhibits a Σ Bases/Al ratio between 0.90 and 1.38, with an average of ∼1.08. The SAL is between 0.30 and 0.40, with an average of ∼0.33; clayeyness is between 0.14 and 0.16, with an average of ∼0.155; PWI is between 44.9 and 60.41, with an average of ∼50.30; and CIA-K is between 52.9 and 63.78 with an average of ∼58.34 (Table 4).
Pedotype 3b. These Bw horizons (0.63) (6F), are found in light brown (7YR 4/4) silty-sandy facies (Fm-Sm). At the macroscale, P3b is identified by a massive structure and Fe-Mn oxide nodules (6G and H).
Under the microscope, it shows a silty to very fine sand texture, with a higher proportion of fine than coarser particles. The coarse fraction (>30 μm) consists of quartz, manganese oxides, plagioclase, highly weathered feldspars, carbonates, and lithic fragments. The micromass (<30 μm) dominates the sample and contains clays and oxides. The b-fabric is granostriated (6I). The c/f₃₀ ratio ranges from 1:99 to 10:90, with an open porphyric-related distribution pattern. Chambers are preserved in the groundmass (6J). The pedofeatures are coatings of illuvial clay and clay mixed with Fe-Mn oxides, found in both voids and grains (6J and K). These coatings consist of clean clay and, in some cases, dark-colored oxides with a composite, non-laminated internal texture. Concentric Fe-Mn oxide nodules have also been identified.
XRD analysis of the Bw horizons revealed the presence of very abundant to abundant quartz (64%), moderate feldspar (16%), moderate plagioclase (16%), and clay (4%). The clay mineralogy is dominated by smectite (54%) and illite (46%) (6F, Table 2).
Geochemical analysis of Bw horizons revealed major oxide content represented in Table 4. The Bw horizon exhibits a Σ Bases/Al ratio of 0.88. The SAL is 0.40; clayeyness is 0.14; PWI is 44.9; and CIA-K is 67.86 (Table 4).
Stable isotope composition
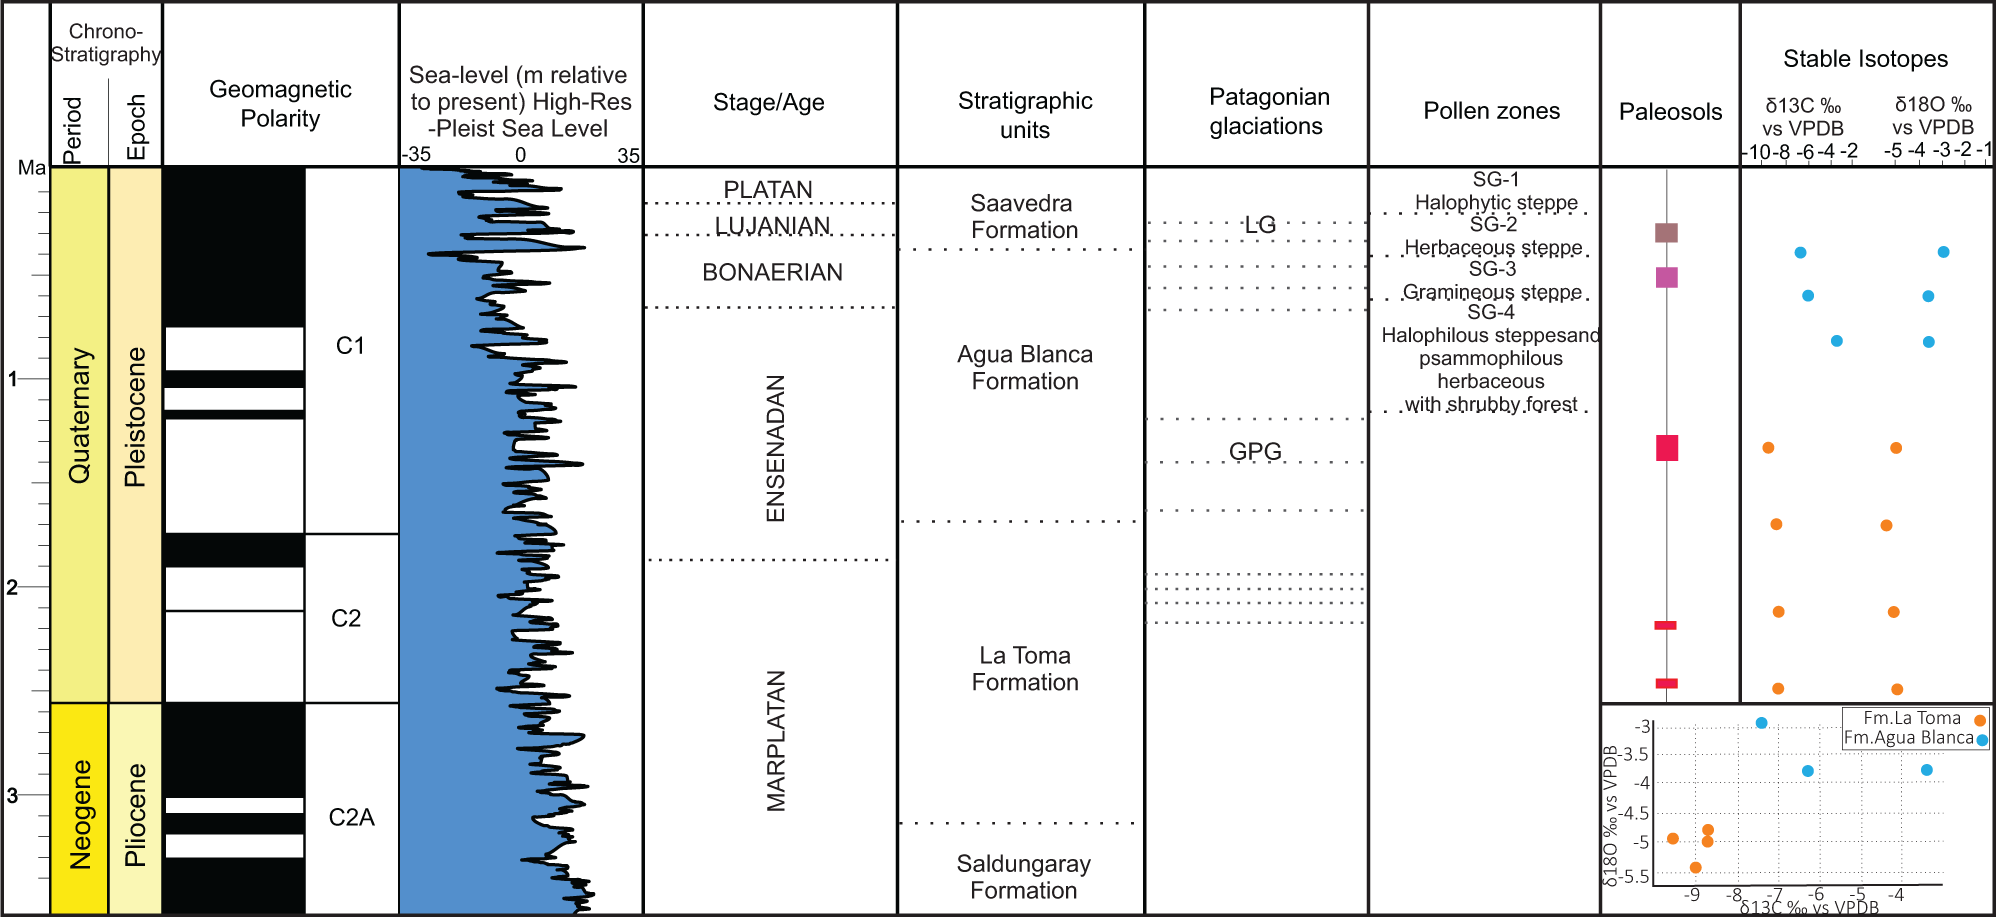
Stable isotope analyses of pedogenic carbonates of P1 and P2 profiles yielded δ13C values ranging from −9.4‰ to −3.5‰ and δ1⁸O values from −5.5‰ to −2.9‰ (both relative to VPDB). Carbon isotope values define two distinct groups: samples from the La Toma Formation show more depleted δ13C values (−9.4‰ to −8.7‰), while those from the Middle Member of the Agua Blanca Formation exhibit more enriched values (−7.4‰ to −3.5‰) (Fig. 7). Oxygen isotope values follow a similar pattern, with La Toma samples showing slightly more negative δ1⁸O values (−5.5‰ to −4.9‰) compared with the Middle Member of the Agua Blanca samples (−3.9‰ to −2.9‰). These contrasting isotopic signatures reflect distinct climatic regimes recorded during the late Pliocene–Early Pleistocene (P1) and Late Pleistocene–Holocene (P2) intervals.
Integrated chronostratigraphic and paleoenvironmental framework for the late Pliocene–Holocene of the Sauce Grande River Basin in Argentina: chronostratigraphy (period/epoch); geomagnetic polarity; sea-level variation for the Plio-Pleistocene period (Miller et al., Reference Miller, Browning, Schmelz, Kopp, Mountain and Wright2020); stage/age (Cione and Tonni, Reference Cione and Tonni2001); stratigraphic units; Patagonian glaciations (Rabassa et al., Reference Rabassa, Coronato and Salemme2005) (LG, last glaciation; GPG, Great Patagonian Glaciation); pollen zones (Borromei, Reference Borromei1995); paleosols in this study; stable isotope compositions of pedogenic carbonates. Samples from the La Toma Formation (P1) are shown in blue, and those from the Agua Blanca Formation (P2) in orange, consistently across the δ13C and δ1⁸O columns and in the lower-right δ13C–δ1⁸O cross-plot.

Figure 7 Long description
The chart presents a chronostratigraphic framework for the Pliocene-Pleistocene period. It includes columns for geomagnetic polarity, sea-level variations, stage/age, stratigraphic units, Patagonian glaciations, pollen zones, paleosols and stable isotopes. The geomagnetic polarity is divided into C1, C2 and C2A. Sea-level changes are shown relative to the present high-resolution Pleistocene sea level, ranging from -35 to 35 meters. The stratigraphic units include the Saavedra, Agua Blanca, La Toma and Saldungaray formations. Patagonian glaciations are marked as LG (Last Glaciation) and GPG (Great Patagonian Glaciation). Pollen zones are labeled SG-1 to SG-4, indicating different vegetation types. Paleosols are represented with colored bars. The stable isotopes section shows delta13C and delta18O values relative to VPDB, with a cross-plot of samples from the La Toma and Agua Blanca formations. The delta13C values range from -10 to -2 and delta18O values from -5 to -1.
For further evaluation of paleoclimatic conditions, mean δ1⁸O values were used to estimate paleotemperatures following the empirical relationship between δ1⁸O of pedogenic carbonates and mean annual temperature proposed by Cerling and Quade (Reference Cerling, Quade, Swart, Lohmann, McKenzie and Savin1993), as applied in Dworkin et al. (Reference Dworkin, Nordt and Atchley2005). Based on this calibration, estimated mean annual paleotemperatures range between approximately 14.5°C to 16°C for the La Toma Formation (P1) and 18°C to 20°C for the Agua Blanca Formation (P2). These estimates fall within the expected range for late Neogene–Quaternary midlatitude continental settings. Slightly higher temperatures inferred for P2 are consistent with warmer climatic conditions relative to P1 and may also reflect increased evaporative effects during carbonate precipitation.
Discussion
Pedogenic processes and paleosol classification
The three pedotypes identified in the SGRB record distinct pedogenic pathways and degrees of soil development, reflecting variable sedimentation rates, moisture regimes, and landscape stability throughout the late Neogene–Quaternary.
Pedotype 1 represents the most mature profile, developed on floodplain deposits and characterized by stacked calcic horizons forming a compound paleosol (Morrison, Reference Morrison and Mahaney1978, Reference Morrison1998). In this pedocomplex, the thin C horizons separating the 2Bk, 3Bk1, and 3Bk2 units were considered as pedosedimentary discontinuities sensu Morrison (Reference Morrison and Mahaney1978, Reference Morrison1998). These discrete C layers represent short intervals of sediment input that interrupted pedogenesis between successive episodes of carbonate accumulation. Their presence supports the interpretation of Pedotype 1 as a compounded paleosol formed through multiple, closely spaced soil-forming cycles developed under similar semiarid environmental conditions. The main pedogenic process is calcification, followed by argilliturbation and hydromorphism, as indicated by macro- and micromorphological features (Table 5). Field evidence of calcification includes micritic nodules, rhizoliths, and two well-developed calcic horizons. Micromorphologically, the presence of micritic and microsparitic coatings, infillings (crystallaria), and nodules, confirms this interpretation. Alpha-type fabrics (crystalline carbonate dispersed in the groundmass, and nodules) and beta-type fabrics (calcified pellets associated with voids, alveolar-septal structures, and needle-fiber calcite) suggest multiple phases of calcretization, involving both physicochemical carbonate precipitation and biogenic processes (Hay and Wiggins, Reference Hay and Wiggins1980; Wright, Reference Wright1990; Alonso-Zarza, Reference Alonso-Zarza2003). Microbial activity (e.g., by fungi and cyanobacteria) likely contributed to micritic coatings around grains (Knox, Reference Knox1977; Calvet and Juliá, Reference Calvet, Juliá and Peryt1983; Alonso-Zarza et al.,Reference Alonso-Zarza, Sanz, Calvo and Estévez1998). The calcic horizons display development ranging from stage II to stage IV of Gile et al. (Reference Gile, Peterson and Grossman1966) and Machette (Reference Machette1985), including isolated to coalescent carbonate nodules and, locally, continuous micritic horizons. These features indicate moderate to advanced pedogenic development achieved through recurrent soil-forming intervals under similar semiarid conditions. Argilliturbation is evidenced by subangular blocky structures at the macroscale and, microscopically, by grain-striated b-fabrics, planar voids, wedge-shaped peds, and a smectitic mineralogy. Hydromorphic features include concentric Fe-Mn oxide nodules and discontinuous diffuse Fe and Mn hypo-coatings, observed at both scales. The Paleosol Weathering Index (PWI ≈ 72) indicates low chemical weathering intensity, consistent with semiarid environments where water availability for chemical alteration is limited. The CIA-K value (≈ 45) supports this interpretation, reflecting a low degree of cation depletion and the preservation of primary minerals. The ratio between bases (Ca, Na, K, Mg) and aluminum (Σ Bases/Al ≈ 1.8; Al/Bases ≈ 0.55) suggests high cation retention and minimal leaching, typical of soils formed under arid to semiarid climates with limited precipitation or prolonged dry seasons. The leaching index (≈29) points to restricted element mobility, likely associated with short, seasonal moisture pulses insufficient to promote intense weathering. Additionally, the SAL value (≈0.30) indicates low salinization, consistent with carbonate accumulation without significant evaporite formation. Overall, these geochemical features suggest soil development under conditions of seasonal water availability, limited leaching, and a positive water balance only during brief humid intervals. Based on these characteristics, this pedotype is interpreted as a Calcisol following Mack et al. (Reference Mack, James and Monger1993). According to the Soil Survey Staff system adapted for paleosols (Nordt et al., Reference Nordt, Stinchcomb, McCarthy and Driese2025), it corresponds to a Calcic Mollisol with an aridic humidity regime, given the presence of well-developed calcic horizons, rhizoconcretions/rhizoliths, and biogenic void systems (chambers and channels).
Pedogenic processes based on macro and microfeatures of the different pedotypes in the Sauce Grande River basin, Buenos Aires Province, Argentina.

Table 5 Long description
Columns list pedotypes, macro and microfeatures, and pedogenic processes. Under calcification, P1 has macro rhizoliths and nodules and micro nodules with carbonate coatings, micritic and microsparitic hypo coatings and complete infillings, calcified cells, alveolar septal structure, and peloids. For calcification, P2 has macro nodules and rhizoliths and micro micritic nodules, and P3a has micro micritic carbonate hypo coatings. Under hydromorphism, P1 has macro Fe Mn nodules and micro nodules with Fe Mn coatings and hypo coatings, P2 has macro Fe Mn nodules and micro typic nodules with Fe Mn coatings, and both P3a and P3b list macro Fe Mn nodules with micro Fe Mn nodules. Under argilliturbation, P1 has macro subangular blocky structure and micro wedge shaped peds, granostriated b fabric, planar voids, and dominance of smectite; P3a has macro subangular blocky structure and micro dominance of smectite, planar voids, and striated b fabric; and P3b lists micro granostriated b fabric. Under illuviation, P3b lists micro illuvial clay and Fe Mn coatings.
Pedotype 2 exhibits very weak pedogenesis over fluvial substrates, dominated by ACk horizons with micritic nodules and rhizoliths. The presence of alpha-type micrite fabrics and stage II carbonate features (Gile et al., Reference Gile, Peterson and Grossman1966; Machette, Reference Machette1985) reflects early calcification under episodic moisture availability. Hydromorphic features (Fe–Mn coatings and nodules) denote fluctuating water tables, while smectite- and illite-dominated clays record limited chemical weathering. This pedotype is poorly developed, which restricts detailed paleoenvironmental interpretations (Bellosi and González, Reference Bellosi, González, Madden, Carlini, Vucetich and Kay2010). However, pollen and mammal remains (mainly rodents) have been recorded in association with these soils, indicating arid to semiarid conditions (Quattrocchio et al., Reference Quattrocchio, Borromei, Deschamps, Grill and Zavala2008). Geochemical indices (PWI ≈ 52; CIA-K ≈ 61; SAL ≈ 0.40) confirm minimal pedogenesis under arid to semiarid conditions. Based on all the previously stated observations, this pedotype is classified as a Calcic Protosol following Mack et al. (Reference Mack, James and Monger1993) and as an Entisol (Fluvent) according to the Soil Survey Staff classification adapted for paleosols (Nordt et al., Reference Nordt, Stinchcomb, McCarthy and Driese2025), reflecting its very weak degree of pedogenic development.
Pedotype 3a displays dominant pedogenic processes that include argilliturbation, marked by planar voids forming blocky aggregates and striated b-fabric; calcification (micritic hypo-coatings in planar voids); and hydromorphism (concentricFe-Mn oxide nodules) (Table 5). CIA-K values (∼58.35), moderate PWI (∼53.05), and high Σ Bases/Al values (∼1.1) indicate low to moderate values with limited cation loss. SAL (∼0.31) reflects moderate salinization (Table 4). Although vertic features such as the subangular blocky structure, striated b-fabric, and smectitic clay mineralogy are typical of more developed soils like Vertisols (Retallack, Reference Retallack2001), the absence of well-developed slickensides and extensive shrink–swell features indicates that these paleosols did not reach the maturity required for Vertisol classification. Consequently, this pedotype corresponds to a Protosol sensu Mack et al. (Reference Mack, James and Monger1993), and—based on the presence of >50% pedogenic structure, fine textures, and clear secondary pedogenic features (redoximorphic concentrations and micritic carbonate hypo-coatings)—it qualifies as a Inceptisol following the adapted Soil Survey Staff criteria (Nordt et al., Reference Nordt, Stinchcomb, McCarthy and Driese2025).
Pedotype 3b preserves several incipient pedogenic features. The most prominent process is clay illuviation, evidenced at the microscopic scale by clay coatings in voids, and Fe-Mn oxides, hydromorphism (hypo-coatings and Fe-Mn oxide nodules), and incipient argilliturbation (granostriated b-fabric) (Table 5). Illuviation requires vertical water movement, striated b-fabric relates to shrink–swell dynamics, and redoximorphic features indicate periodic saturation and oxidation—consistent with alternating wet and dry conditions (Retallack, Reference Retallack1990; Kraus and Hasiotis, Reference Kraus and Hasiotis2006). CIA-K values (67.86), low PWI (44.94), and high Σ Bases/Al ratio (0.89) values corroborate a limited cation loss and moderate weathering. SAL (0.39) indicates moderate salinization (Table 4). Despite these pedogenic indicators, the degree of development remains weak. Crucially, the clay coatings are restricted to the microscale, show discontinuous distribution, and do not appear at the macromorphological scale. Accordingly, Pedotype 3b is interpreted as a Protosol following the paleosol classification of Mack et al. (Reference Mack, James and Monger1993) and as an Entisol (Fluvent) under the adapted Soil Survey Staff taxonomy. This reflects incipient pedogenesis developed under short periods of surface stability within a dynamic floodplain environment.
Paleoenvironmental and palaeoecological evolution
The stable carbon (δ13C) and oxygen (δ18O) isotopic values obtained allow the interpretation of paleoenvironmental and palaeoecological evolution during the late Pliocene–Holocene interval. These data are supported by the paleoenvironmental and paleoclimatic interpretations proposed in this study. The δ1⁸O values in the pedogenic carbonates range from −5.5‰ to −2.9‰ (VPDB), while δ13C values vary between −9.4‰ and −3.5‰ (VPDB) (Fig. 7, Table 3). In the deposits of the La Toma Formation (P1), corresponding to the late Pliocene–Early Pleistocene, both δ1⁸O (−5.5‰ to−4.90‰) and δ13C (−9.4‰ to −8.7‰) show low variation (Fig. 7). The deposits represented by the Middle Member of the Agua Blanca Formation (Late Pleistocene–Holocene) exhibit low variation in the δ1⁸O values (−2.9‰ to−3.85‰), but δ13C values show a wider range (−7.4‰ to −3.5‰) (Fig. 8). The low variation in the δ1⁸O values intra-P1 and intra-P2, suggest that large-scale precipitation patterns may not have changed significantly during their respective pedogenetic development. However, slight enrichment in δ1⁸O values from the La Toma (P1) to Agua Blanca (P2) formations may indicate subtle increases in temperature or evaporative effects. Estimated paleotemperatures, calculated from mean δ1⁸O values of pedogenic carbonates using the empirical calibration of Cerling and Quade (Reference Cerling, Quade, Swart, Lohmann, McKenzie and Savin1993), suggest values of approximately 14.5–16°C for P1 and 18–20°C for P2. These values fall within expected ranges for late Neogene–Quaternary midlatitude settings, and the slightly higher P2 temperatures may be partly influenced by near-surface evaporative enrichment in calcrete horizons (Liu et al., Reference Liu, Phillips and Campbell1996). In contrast, the δ13C values provide clearer ecological differentiation. P1 carbonates show characteristically depleted values, consistent with a predominance of C₃ vegetation and cooler, more humid conditions. By contrast, P2 values shift toward higher δ13C, indicating increased aridity, reduced plant cover, and a higher contribution of C₄ vegetation. The relative proportions of C₃ versus C₄ plants were qualitatively inferred through comparison with typical endmember values for C₃ and C₄ vegetation and modeled soil-respired CO₂ signatures following Cerling (Reference Cerling1984), Cerling et al. (Reference Cerling, Harris, MacFadden, Leakey, Quade, Eisenmann and Ehleringer1997), and mixing model approaches (Wang and Zheng, Reference Wang and Zheng1989).These isotopic differences imply a paleoenvironmental transition toward drier and slightly warmer conditions during the Late Pleistocene–Holocene. The δ13C enrichment in P2 may also reflect enhanced turnover and respiration of soil organic matter under drier conditions, which increases the δ13C of soil CO₂ and, subsequently, pedogenic carbonates (Breecker et al., Reference Breecker, Sharp and McFadden2009). This therefore supports an interpretation of increased aridity and vegetation stress rather than purely a shift in plant community composition. This interpretation aligns with the average δ13C values, which indicate a predominance of C₃ plants during the late Pliocene–Early Pleistocene and a shift toward greater C₄ plant presence under more arid and semiarid conditions in the Late Pleistocene–Holocene (Cerling, Reference Cerling1984; Cerling et al., Reference Cerling, Harris, MacFadden, Leakey, Quade, Eisenmann and Ehleringer1997; Fig. 8).
Schematic paleoenvironmental reconstruction of the Sauce Grande River Basin in Argentina during the late Pliocene to the Holocene. Bottom, Late Pliocene–Early Pleistocene: deposits of the La Toma Formation under a low-sinuosity fluvial system developed in a relatively stable landscape. Calcisols (P1) formed on well-drained floodplains under semiarid conditions dominated by C3 vegetation. Center, Late Pleistocene: development of the Agua Blanca Formation, characterized by increased fluvial dynamism, braided channels, and more variable moisture conditions. Weakly developed Calcic Protosols (P2) formed on floodplains and overbank deposits during drier and colder climatic conditions. Top, Late Pleistocene–Holocene: reduced sediment input and increased landscape stability favored the formation of Protosols (P3) within the Saavedra Formation.

Figure 8 Long description
The paleoenvironmental reconstruction of the Sauce Grande River Basin across three time periods: Late Pleistocene-Holocene, Late Pleistocene and Late Pliocene-Early Pleistocene. In the Late Pleistocene-Holocene section, the landscape features a main channel, braided bars and overbank deposits labeled FA I, FA II and FA III. The presence of P3 Protosols is indicated. Symbols for rain and sun suggest variable weather conditions. The Late Pleistocene section depicts a similar landscape with a main channel and braided bars. The presence of P2 Calcic Protosols is noted, with FA I and FA II labeled. Weather symbols indicate mixed conditions. In the Late Pliocene-Early Pleistocene section, the landscape includes a main channel, terrace surfaces and overbank deposits. P1 Calcisols are marked, with FA I and FA II labeled. Symbols for rain and sun suggest varied weather. A legend explains symbols for main channel, braided bars, Ventania Range, terrace surface and vegetation types like herbs, grasses, trees and shrubs. Weather symbols indicate humid and warm conditions.
Borromei (Reference Borromei1995) defined four palynological zones for the late Pliocene-Late Holocene deposits of the SGRB. Regarding the Middle Member of the Agua Blanca Formation, Borromei (Reference Borromei1995) identifies Zone SG-4, which reflects halophytic steppe and psammophytic herbaceous communities (Fig. 8) associated with shrubland elements and sparse vegetation cover, indicating an arid to semiarid climate. The influence of subpolar air masses during the Late Pleistocene caused cold and dry conditions in Buenos Aires Province (Borromei, Reference Borromei1992; Quattrocchio et al., Reference Quattrocchio, Kostadinoff, Martınez and Prieto1994) as well as in southern Argentina (Heusser, Reference Heusser1987, Reference Moore and Reynolds1989). The Agua Blanca Formation culminates in the development of Paleosol 2 (P2), with carbonate features marking a stable episode (Quattrocchio et al., Reference Quattrocchio, Borromei, Deschamps, Grill and Zavala2008), and the onset of a wetter and slightly warmer phase during the Late Pleistocene–Holocene, coinciding with the retreat of the last glaciation in the Patagonian Andes (Rabassa, Reference Rabassa1987; Fidalgo, Reference Fidalgo and Iriondo1992).
This climatic change was registered in the Upper Member of the Agua Blanca Formation, characterized by palynological Zone SG-3, which shows an increase in vegetation cover, grassy steppes, and a low proportion of shrublands, indicating a more temperate and humid climate (Borromei, Reference Borromei1995). This corresponds with the development of Paleosol 3 (P3), which exhibits hydromorphic features (Fe-Mn oxide nodules), argilliturbation (striated b-fabric and blocky aggregates), calcification (micritic carbonate hypo-coatings), and clay illuviation. These characteristics indicate a climate with pronounced seasonality, involving alternating wet and dry periods (Retallack, Reference Retallack2001).
The paleosols in the study area present a clear stratigraphic order (Fig. 7). In the lower sections, within the La Toma Formation, Calcisols (P1) developed under conditions that favored prolonged soil formation, likely in relatively stable landscape positions. The presence of pedogenic carbonates, clay illuviation, and redoximorphic features indicates a soil-forming environment with alternating wet and dry periods, suggesting a seasonal moisture regime. These characteristics may reflect a landscape with sufficient exposure time and moisture variability to allow for the formation and redistribution of carbonates and clays. As time progressed, subtle shifts in environmental conditions took place. In the middle section of the Agua Blanca Formation (Late Pleistocene–Holocene), Calcic Protosols (P2) developed. These paleosols are weakly developed, lacking clear horizonation, clay illuviation, and exhibiting shallow carbonate accumulation. Such characteristics point to relatively brief periods of pedogenesis and suggest that soil formation occurred under conditions influenced more by sedimentary dynamics than by climatic extremes. The limited development of P2 likely reflects the influence of increased sediment supply, fluctuating water tables, and formation within a moderately active depositional environment, such as sandy channels and distal floodplains. Finally, in the upper sections, represented by the Saavedra Formation, Protosols (P3) represent a weak paleosol with hydromorphic features (Fe-Mn nodules and coatings), clay illuviation, and vertic characteristics. These formed under conditions of moderate landscape stability but still influenced by periodic sediment influx and variable moisture. Thus, while P1 reflects prolonged pedogenesis under relatively stable geomorphic conditions, P2 and P3 register shorter pedogenic intervals within an increasingly dynamic alluvial setting. The macroscopic and microscopic features in P1 and P3 (redoximorphic features, minor clay coatings, striated b-fabric) reflect seasonal moisture fluctuations; however, the contrast between well-developed carbonate horizons in P1 and the weak development of P2–P3 indicates that soil maturity was primarily controlled by landscape stability and sediment supply, with climate acting as a secondary modulating factor. Together, the vertical distribution and characteristics of P1, P2, and P3 record the progressive transition from long-term stable floodplain surfaces in the late Pliocene–Early Pleistocene to more dynamic environments with episodic stability during the Late Pleistocene–Holocene, consistent with regional paleoenvironmental reconstructions (Fig. 8).
Glacioeustatic dynamics during the Plio-Pleistocene–Holocene
Late Pliocene to Holocene deposits of the Pampean region reflect the combined influence of global glacial–interglacial cycles, glacioeustatic sea-level fluctuations, and basin-scale geomorphic dynamics, all of which left recognizable imprints in the SGRB. The paleosols analyzed in this study record these environmental transitions with varying fidelity depending on landscape stability, sediment supply, and soil residence time.
During the late Pliocene–Early Pleistocene, P1 Calcisols developed on relatively stable floodplain surfaces within the La Toma Formation. Well-developed calcic horizons, redoximorphic features, clay redistribution, and stacked pedogenic phases, together with depleted δ13C values and lower δ1⁸O-derived paleotemperatures, indicate temperate to subhumid conditions with alternating wet–dry seasons. These characteristics are consistent with global cooling trends between ∼2.8 and 1.8 Ma (Zachos et al., Reference Zachos, Pagani, Sloan, Thomas and Billups2001) and with Early Pleistocene glacial activity in Patagonia, including the late Pliocene glaciations documented by Rabassa et al. (Reference Rabassa, Coronato and Salemme2005). Regionally, this interval corresponds to environmental conditions preceding the Great Pampean Glaciation (GPG) and aligns with the paleoenvironmental signals inferred from other Pampean records (Cione and Tonni, Reference Cione and Tonni2001).
As the Pleistocene progressed, climatic variability intensified. Between MIS 82 and MIS 48, several glacial cycles produced landscape instability and erosional phases that contributed to discontinuities in the sedimentary record (Manoccio et al., Reference Manoccio, Beilinson, Raigemborn, Gasparini, Barendregt, Clague and Rabassa2024). In the SGRB, coarse gravels of the Lower Psephitic Member of the Agua Blanca Formation likely reflect increased sediment discharge during interglacial cycles of the Marplatan period, supported by associated fossil remains such as Plohophorini indet. and Caviidae indet. (Zavala and Quattrocchio, Reference Zavala and Quattrocchio2001).
A warm interglacial pulse corresponding to MIS 11—one of the warmest of the last 500 ka—is represented in the region by faunal elements from the Ctenomys kraglievichi Biozone (Deschamps, Reference Deschamps2003; Verzi et al., Reference Verzi, Deschamps and Tonni2004) and at the base of the Megatherium americanum Biozone, which includes micromammal species indicative of warmer environmental conditions (Prado et al., Reference Prado, Duval, Demuro, Santos-Arévalo, Alberdi, Tomassini and Fernández-Jalvo2024). Although globally MIS 11 is recognized as markedly warm, the Pampean record suggests warm but relatively dry conditions during this interval, consistent with isotopic signatures and paleopedogenic features in the Agua Blanca deposits.
The paleosols developed during the middle Agua Blanca Formation (P2) display very weak pedogenesis, limited horizonation, and shallow carbonate development, contrasting sharply with the degree of pedogenic maturity seen in P1. Enriched δ13C values in P2 indicate increasing aridity and reduced vegetation density during the Late Pleistocene, broadly consistent with faunal assemblages associated with the Equus (Amerhippus) neogaeus–Macrauchenia patachonica biozone, which reflect open grasslands and arid to semiarid steppe environments with low precipitation (Deschamps and Borromei, Reference Borromei1992; Cione and Tonni, Reference Cione, Tonni, Tonni and Cione1999). However, the extremely weak development of P2 indicates that soil-forming processes were strongly overprinted by elevated sediment supply and dynamic depositional conditions. Consequently, in this interval the isotopic values more faithfully record climatic trends, whereas the paleosols themselves predominantly reflect geomorphic instability rather than climate.
The Late Pleistocene glacial cycles, particularly MIS 4 and MIS 2, caused pronounced drops in sea level due to expanded ice sheets and contributed to increased aridity across the Pampean region (Quattrocchio and Borromei, Reference Quattrocchio and Borromei1998). These conditions are compatible with the environmental implications of P2. By contrast, the transition into the Holocene marks a shift toward higher landscape stability and episodic moisture availability, reflected in the development of P3, Protosols within the Saavedra Formation. Although still weakly developed, P3 displays hydromorphic features, minor clay redistribution, and vertic characteristics, indicating seasonal wet–dry cycles and gradual ecological recovery under a more temperate and humid climate. Palynological Zone SG-3 of Borromei (Reference Borromei1995), characterized by increased vegetation cover and grassy steppes, corresponds closely with this pedogenic development and with the regional deglaciation and warming documented in the Patagonian Andes (Rabassa, Reference Rabassa1987; Fidalgo, Reference Fidalgo and Iriondo1992).
Overall, the combined lithological, paleobiological, isotopic, and paleopedological evidence in the SGRB registers a progressive environmental evolution from relatively temperate and subhumid conditions in the late Pliocene–Early Pleistocene, through cooler and more arid phases during the Late Pleistocene, to increased moisture availability and partial landscape stabilization during the Holocene. The contrasting behaviors of P1, P2, and P3 demonstrate that paleosols in the basin integrate climatic signals most clearly during intervals of geomorphic stability (P1), while in more dynamic settings (P2–P3) pedogenic features are strongly modulated by sedimentation rates and landscape evolution. Thus, the environmental history of the basin reflects a complex interplay between climate forcing and basin dynamics, with each paleosol recording these influences in distinct proportions.
Conclusions
This study provides new insights into the paleoenvironmental evolution of the Pampean region in Buenos Aires Province, Argentina, through the integration of paleopedological, sedimentological, isotopic, and stratigraphic evidence. This multiproxy approach allowed a qualitative reconstruction of environmental changes from the late Pliocene to the Holocene, emphasizing climatic variability during the Quaternary.
The three identified pedotypes (Calcisols, Calcic Protosols, and Protosols) record shifts in landscape stability, sediment supply, and soil moisture conditions. Pedogenic features such as carbonate nodules, rhizoliths, redoximorphic features, localized clay illuviation, and vertic characteristics point to alternating wet–dry regimes, fluctuating water tables, and variations in soil residence time. Geochemical indices and clay mineralogy—dominated by smectite—indicates limited weathering intensity under seasonally variable moisture conditions.
Stable isotope composition provides an independent line of evidence for bioclimatic change. Depleted δ13C values in P1 indicate dominance of C₃ vegetation under relatively cool and humid late Pliocene–Early Pleistocene conditions. Through time, progressively enriched δ13C values in P2 reflect increasing aridity, reduced vegetation density, and a higher proportion of C₄ plants during the Late Pleistocene–Holocene. Estimated paleotemperatures derived from δ1⁸O values show a modest increase from ∼14.5–16°C in P1 to ∼18–20°C in P2, suggesting slightly warmer Late Pleistocene–Holocene conditions.
A key outcome of this study is that pedogenic indicators of water availability broadly track the isotopic proxy trends. P1 exhibits redoximorphic features, more continuous carbonate nodules, and other indicators of higher moisture and longer soil residence times, consistent with depleted δ13C values and lower δ1⁸O-derived paleotemperatures. In contrast, P2 and P3 show weaker pedogenic development, fewer redox features, and enhanced seasonal moisture variability, paralleling enriched δ13C values that indicate increased aridity toward the Late Pleistocene–Holocene.
However, the synthesis also reveals intervals where isotopic and pedogenic signals diverge. In particular, P2 shows enriched δ13C values indicative of aridity, yet pedogenic features are comparatively subdued. This mismatch is best explained by episodes of rapid sedimentation and reduced landscape stability, which shortened soil residence time and partially obscured climatic signals. These results highlight the strong influence of geomorphic position, accumulation rates, and landscape dynamics on the expression of pedogenic features, independent of climate.
Taken together, the multiproxy evidence documents a long-term environmental evolution from relatively temperate and subhumid conditions during the late Pliocene, through cooler and more arid phases of the Late Pleistocene, followed by increased moisture availability and landscape stabilization in the Holocene. This study underscores the significance of combining paleopedological, isotopic, and stratigraphic archives to reconstruct the paleoenvironmental history of the Pampean region on geological timescales.
Acknowledgments
This work was carried out within the framework of the doctoral scholarship granted to LM by the National Council of Scientific and Technical Research (CONICET). Financial support was provided by project PICT-2018-02400, led by EB. The authors also thank the Facultad de Ciencias Naturales y Museo and CONICET for institutional support. We are grateful to the technicians at the CIG (Centro de Investigaciones Geológicas) for preparing thin sections and XRD analyses. Special thanks go to J.F. Alcalde, T. Navarro, G.M. Gasparini, R. Barendregt, J. Clague, and J. Rabassa for their invaluable assistance in the field. We sincerely thank the editor, the associate editor, and the reviewers for their thoughtful comments, careful reading, and constructive suggestions that greatly improved the quality of this article.