Implications
Animal welfare is a multi-dimensional concept, and its assessment should be based on different measures. One of the main challenges of the Welfare Quality® (WQ) protocols is the aggregation of the different measures into an overall assessment due to the complexity of the methodology proposed. This study validates an alternative multi-criteria methodology to the one used in the WQ protocols, which remains more flexible and transparent. The sensitivity of this alternative methodology to distinguish between commercial growing pigs’ farms in terms of welfare and the relative importance of single welfare measures in the overall assessment of farms is also studied.
Introduction
Animal welfare is a multi-dimensional concept, and its assessment should be based on a variety of measures related to several aspects such as the absence of thirst, hunger, discomfort, disease, pain, injuries and stress, and the presence of normal behavioural expressions (Farm Animal Welfare Council, 1992). Due to this fact, a multi-criteria evaluation model is required for the evaluation of an animal unit (farm, slaughterhouse). In animal welfare, as well as in other areas, the development of a multi-criteria evaluation system requires considerable efforts due to its complexity. The complexity of this kind of model lies in the high number of measures involved, the varied nature of these measures (qualitative, quantitative, measures recorded in different scales, precision of the measures, different ranges of variation, etc.), the different importance of the measures, the interaction between them and last but not least the number of stakeholder groups involved, which makes it difficult to arrive at decisions which accommodate stakeholders’ wants and needs (Botreau et al., Reference Botreau, Bracke, Perny, Butterworth, Capdeville, van Reenen and Veissier2007). WQ developed multi-criteria animal welfare evaluation models for different livestock species (Botreau et al., Reference Botreau, Veissier and Perny2009). The inputs for the WQ multi-criteria animal welfare evaluation model are on-farm welfare measures described in the WQ assessment protocol (WQ, 2009). The WQ multi-criteria evaluation model uses different aggregation methods (e.g. decision tree, weighted sum or Choquet integral (CI)) to aggregate measures into an overall assessment (Botreau et al., Reference Botreau, Capdeville, Perny and Veissier2008).
Usually, it is in the development of the model where the greatest efforts are made and less attention is paid to the credibility of the model. However, validation is a crucial point in order to build sufficient confidence in the model for it to be used for practical purposes. Model validation can be divided into three components – verification, validation and sensitivity analysis – according to Qureshi et al. (Reference Qureshi, Harrison and Wegener1999) and Harrison (Reference Harrison1991). Verification refers to building the model correctly (O’Keefe et al., Reference O’Keefe, Osman and Smith1991). It ensures that the model has been developed in a formally correct manner in accordance with a specified methodology (Geissman and Schultz, Reference Geissman and Schultz1991). In the case of a mathematical model implemented by computer program, verification establishes that the program has been written correctly and that it behaves as intended. Validation refers to building the correct model (O’Keefe et al., Reference O’Keefe, Osman and Smith1991). Most attempts at model validation check agreement between the model and real system outputs or between the model and expert opinions (Qureshi et al., Reference Qureshi, Harrison and Wegener1999). Sensitivity analysis examines the extent of variation in predicted performances when parameters are varied over some range of interest. Sensitivity analysis provides information on the priority areas for refinement if further versions of the model are to be developed (Qureshi et al., Reference Qureshi, Harrison and Wegener1999).
The WQ multi-criteria evaluation model was tested on commercial European farms during the WQ project and partly adjusted according to these results. Moreover, classification of some of these farms was compared with the general impression of observers who carried out audits of the farms (Botreau et al., Reference Botreau, Veissier and Perny2009). As publication of the protocols, different studies on the validation of the measures used in the protocol have been carried out (Temple et al., Reference Temple, Courboulay, Manteca, Velarde and Dalmau2011a, Reference Temple, Courboulay, Velarde, Dalmau and Manteca2011b, Reference Temple, Manteca, Dalmau and Velarde2012a, Reference Temple, Dalmau, Ruiz de la Torre, Manteca and Velarde2012b and Reference Temple, Manteca, Velarde and Dalmau2013), assessing whether the measures included in the protocol are sensitive enough to distinguish between different types of housing systems, and between farms. However, there are few studies that have assessed whether the model is sensitive at criteria, principle or overall assessment level, and whether it can distinguish between different farms (de Vries et al., Reference de Vries, Bokkers, van Schaik, Botreau, Engel, Dijkstra and de Boer2013).
The aim of this paper was to validate an alternative multi-criteria evaluation model to assess animal welfare on farms, within the WQ framework, employing, as an example, a growing pigs’ welfare assessment. The objective was to compare the results obtained by implementing our approach with the results obtained by using the approach proposed in the WQ protocol, as well as assessing its sensitivity to distinguish between commercial growing pigs’ farms and to demonstrate the relative importance of welfare measures in the different steps of the multi-criteria aggregation process.
Material and methods
Data
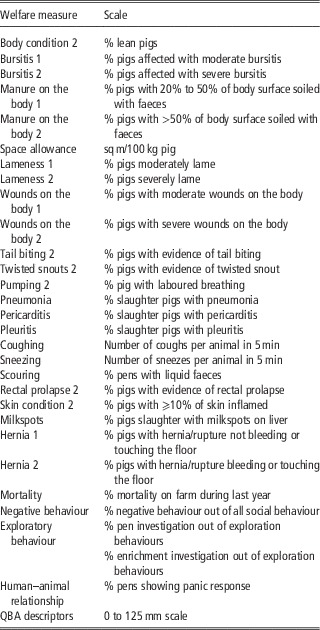
Data collection took place between January 2013 and January 2014 on eight German growing pig farms in Schleswig-Holstein. All the farms were assessed by the same observer, who was trained to use the WQ assessment protocol for growing pigs (WQ, 2009) by members of the WQ project group. The pigs on the farms were housed either conventionally or according to the guidelines of the German animal welfare label ‘Tierwohllabel’ of the German animal welfare organisation ‘Deutscher Tierschutzbund e.V.’ (Tierschutzbund, Reference Tierschutzbund2013). Each farm was visited six times at two consecutive growing periods. Thereby, during each of the two growing periods, three assessments took place: the first protocol assessment took place 2 weeks after entry into the growing stable at an average weight of the pigs of 40 kg (Farm Visit 1), the second took place in the middle of the growing period at an average weight of 75 kg (Farm Visit 2) and the third assessment took place 2 weeks before beginning of sales to the slaughterhouse at an average weight of 100 kg (Farm Visit 3). Changes in management occurred on one of the farms and due to this fact this farm was assessed only two times. In total, the protocol was run 44 times. The entire WQ protocol for growing pigs was carried out at each farm visit. Data were collected at pig and herd level, depending on the type of measurement. After data collection, data were expressed as welfare measures at the herd level. These welfare measures could be either quantitative or qualitative and were expressed on different scales depending on the measure (e.g. percentage of lame animals or coughs per animal in 5 min) following the WQ protocol (WQ, 2009).
Aggregation of welfare measures into criteria and principles
WQ proposes a three-step aggregation process (WQ, 2009), welfare measures are aggregated into 12 criteria, these criteria are in turn aggregated into four principles, and finally these four principles are combined into an overall assessment. In this study, we focussed on the first two steps of the aggregation process (Figure 1). In the present study, two methodologies were used to produce criteria and principle values from the data of the welfare measures collected in the farms observed: first, following the WQ assessment protocol for growing pigs (WQ, 2009) and second, following an alternative methodology which consisted of the use of Measuring Attractiveness by a Categorical-Based Evaluation Technique (MACBETH) and the CI in the context of the multi-attribute utility theory (MAUT). Examples of the aggregation of the measures into criteria and principles following both methodologies are given in Martín et al. (Reference Martín, Traulsen, Buxadé and Krieter2016).
Welfare Quality® bottom-up approach for integrating the data of the different welfare measures into an overall assessment.

Welfare Quality®: aggregation of measures into criteria
In the first step, welfare measures were aggregated into the 12 corresponding criteria. WQ used different types of aggregation of measures into criteria. For some criteria, the numbers of moderate and severe problems were first combined with a weighted sum, producing a measure index, on a scale from 0 (worst) to 100 (best). Afterwards, these index values were converted into measure scores (expressed on the same 0 to 100 scale), using spline functions (Ramsay, Reference Ramsay1988) fitted by least square (LS) methods. Finally, the CI was used to combine the scores for the different measures into a score for the criterion. For other criteria, the measures were first transformed into an ordinal scale, which consisted of assigning warning or alarms, depending on the value of the measures. The number of warnings and alarms were then combined into an index for the criterion, and afterwards this index was converted into a criterion score using l-spline functions. Decision trees were used to produce the criterion score for other measures. Further information on the development and employment of these operators can be found in Botreau et al. (Reference Botreau, Capdeville, Perny and Veissier2008 and Reference Botreau, Veissier and Perny2009) and Veissier et al. (Reference Veissier, Jensen, Botreau and Sandoe2011).
Welfare Quality®: aggregation of criteria into principles
In the second step, WQ used the CI to aggregate the 12 criteria into four principles. This integral uses weights to combine the different criterion scores into one principle score (expressed on the 0 to 100 scale), whereas limiting the possibility that a poor score of a criterion is compensated by other excellent scores (Botreau et al., Reference Botreau, Bracke, Perny, Butterworth, Capdeville, van Reenen and Veissier2007; Veissier et al., Reference Veissier, Jensen, Botreau and Sandoe2011).
Multi-attribute utility theory: aggregation of measures into criteria
In the first step of the aggregation, MAUT (Keeney and Raiffa, Reference Keeney and Raiffa1976) was used to produce a value of welfare for each criteria. The application of the MAUT consisted of two separated steps, the utility function determination and the aggregation function determination.
Utility function determination (Measuring Attractiveness by a Categorical-Based Evaluation Technique):
The utility function gives value to the measure in terms of welfare, it represents the preferences of the decisionmaker (DM) over the measures and its different values. For example, 5% of lameness on a farm may be interpreted as a worse situation than 5% of wounds on the body. There are different methods for utility function determination. MACBETH was chosen for several reasons: first, due to the available information on how to use this method to facilitate a consensus among stakeholders (Parnell et al., Reference Parnell, Brensik, Tani and Johnson2013; Bana e Costa et al., Reference Bana e Costa, Lourenço, Oliveira and Bana e Costa2014), which is one of the main difficulties that a multi-criteria evaluation system for animal welfare faces. Second, due to the fact that this method makes it easier to judge the different attractiveness of options with an increasing number of criteria, due to the use of qualitative judgements, and moreover, a scale of indifferent categories (‘very weak’, ‘weak’, ‘moderate’, ‘strong’, ‘very strong’ or ‘extreme’) (Bana e Costa et al., Reference Bana e Costa, de Corte and Vansnick2004). Third, MACBETH allows for a comparison of not only qualitative performance levels but quantitative performances too, with no need for a previous conversion of the quantitative scales into a qualitative scale, allowing a solution to one of the problems presented by Botreau et al. (Reference Botreau, Bracke, Perny, Butterworth, Capdeville, van Reenen and Veissier2007). Fourth, the determination of the utilities process remains transparent due to the bibliography on it (Bana e Costa et al., Reference Bana e Costa, de Corte and Vansnick1999 and Reference Bana e Costa, de Corte and Vansnick2004) and it is easier to explain to the stakeholders due to the interactive software provided (M-MACBETH).
MACBETH is a methodology which requires only qualitative judgements to quantify the relative attractiveness (utilities) of options (farms). In order to elicit a utility function with MACBETH, the first step is to define whether the measure performs as a quantitative measure or as a qualitative one and which are the quantitative/qualitative performance levels of the measure. The next step is to fill in a matrix, giving qualitative judgements regarding the difference of attractiveness between the different quantitative performance levels of the measure. The qualitative judgements can be rated as ‘very weak’, ‘weak’, ‘moderate’, ‘strong’, ‘very strong’ or ‘extreme’. As each judgement was given, the matrix’s consistency was automatically verified with an interactive algorithm based on linear programming (Mayag et al., Reference Mayag, Grabisch and Labreuche2010), and judgement modifications were suggested which could be made to fix any detected inconsistency. From the complete and consistent matrix of judgements, MACBETH creates a numerical scale. With the numerical scale, MACBETH produces the marginal utility function (u) for each measure. In order to be able to aggregate the different measures into criteria, this method also allows normalisation of the raw data expressed in different scales into an absolute value scale, ranging, for example, between 0 and 100, where 0 is the worst situation one can find on a farm and 100 the best situation. The judgements regarding the difference in attractiveness were given trying to simulate the WQ DMs preferences, these judgements were derived from the WQ l-spline functions. After the initial calculation of the MACBETH scale, it was checked to ensure that it adequately represented the relative magnitude of the WQ DMs judgements, if not, the scores were adjusted. MACBETH allows adjusting the scores within a range of values that assures compliance with the qualitative judgements matrix.
Aggregation with the Choquet integral:
In a second step, the CI (Choquet, Reference Choquet1953; Murofushi and Sugeno, Reference Murofushi and Sugeno1989; Grabisch, Reference Grabisch1996) was used to aggregate the different measures into the corresponding criteria. In order to combine measures (individual utilities calculated with MACBETH) into criteria using the CI, the first step was the capacity identification. Capacities can be regarded as a weighting vector involved in the calculation of weighted sums. Seen as an aggregation operator, the CI, takes into account the different importance of the measures and the interaction between them. These interactions can be complementary (positive) or substitutive (negative). When the interactions between two measures are positive, compensation is limited between them, whereas when the interactions are negative, compensation is allowed between them. The number of variables involved in the CI increases exponentially, along with the coefficients which define a capacity. To keep things simple, it may be preferable to restrict to two-additive solutions (only interactions between pair of criteria are considered).
Capacity identification, based on the LS approach, was implemented within the Kappalab R package following the method described by Grabisch et al. (Reference Grabisch, Kojadinovic and Meyer2008). In order to use the LS identification method, the utilities calculated with MACBETH corresponding to the examples’ data were used as subsets against which the initial preferences of the WQ DMs are expressed. The results of the aggregation of the examples’ data following the WQ protocol were used as initial preferences in order to fit the model to the WQ DMs’ preferences. With this methodology, a progressive interactive approach can be developed after an initial calculation of the CI, where additional constraints to the Shapley values, which measure the overall importance of a measure (criterion), and the interaction indices can be imposed in order to fit more precisely the WQ DMs preferences. According to Mayag et al. (Reference Mayag, Grabisch and Labreuche2011), given (x 1, x 2, … , x n ) the individual utilities for the different measures, the CI with respect to a two-additive capacity can be written as follows:
 $$C\mu (x)\,{\equals}\,\mathop{\sum}\limits_{i{\equals}1}^n {v_{i} x_{i} } {\minus}{1 \over 2}\mathop{\sum}\limits_{\{ i,j\} } {I_{{ij}} \left| {x_{i} {\minus}x_{j} } \right|} $$
where v i represents the importance of the measure i and corresponds to the Shapley value of μ (capacity) and I ij the interaction between measure i and j.
Multi-attribute utility theory: aggregation of criteria into principles
As criteria are already interpret in terms of welfare in this step, there is no need for a utility function determination. Again, for capacity identification in the context of the CI, we implemented the LS-based approach. In this step, we used the same aggregation operator as in the WQ protocol, and due to this fact, in order to determine the CI parameters, we used the subsets used in the WQ protocol as learning data and the values given by the WQ DMs’ for these subsets as preferences.
Model validation and sensitivity analysis
According to Harrison (Reference Harrison1991), model validation is usually divided into three steps: verification, validation and sensitivity analysis. Due to the fact that our model was based on the WQ methodology, the different formulae proposed in the WQ protocol were verified before determining our model to ensure that the model behaved as intended. The different calculations of our model (MAUT), whether implemented in MACBETH or in R, were checked by means of small data sets.
Validation of the multi-attribute utility theory model
Due to the fact that the WQ model has been already tested for validity (Botreau et al., Reference Botreau, Veissier and Perny2009), we compared the results for the 44 observations both at criteria and principle level, obtained with our methodology (MAUT) and with the WQ methodology, which can be considered as a gold standard. The Euclidean distances (ED) the 44 observations between the WQ and the MAUT for each criterion and principles were calculated. The ED can be understood as the length of the line segment between two points, here the WQ and MAUT observations. When the ED between both methods for a criterion/principle was >0, the Wilcoxon Signed-Rank test confidence intervals between pairs of means were calculated because the assumption of normality was often not appropriated. A confidence interval for the difference between two means specifies a range of values within which the difference between the means of the two models may lie. The confidence interval for the differences between two means contains all the values of μ 1−μ 2 (the difference between the models’ means) which would not be rejected in the two-sided hypothesis of
 $${\rm H}_{{\rm 0}} {\rm \,\colon\,}\,\mu _{{\rm 1}} {\minus}\mu _{{\rm 2}} \,{\rm {\equals}\,0}$$
Against
 $${\rm H}_{1} {\rm \,\colon\,}\,\mu _{{\rm 1}} {\minus}\mu _{{\rm 2}} \,\ne\,\,{\rm 0}$$
If the confidence interval includes 0, we can say that there is no significant difference between the means of the two models, at a given level of confidence. In this study, a level of confidence of 90% (α=10%), was established.
Sensitivity analysis of the multi-attribute utility theory model
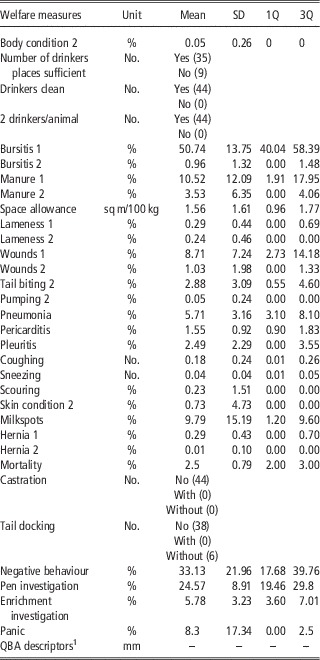
In order to assess whether the model is sensitive to our farms, the values of single welfare measures were replaced with an improved and a worsened value. These values corresponded to the first or the third quartiles of the data (Table 1). Generally, the first quartile corresponded to an improved situation due to the fact that the incidence of the problem was being reduced. However, for some other measures, such as space allowance or exploratory behaviours, the improved situation corresponded to the third quartile due to the fact that an increase in the value of the measure led to improved welfare. We compared the criteria and principles’ values obtained in the original situation with the improved or worsened situation with the Wilcoxon Signed-Rank test confidence intervals for the difference between means.
Quantitative animal-based measures for growing pigs’ welfare assessment with scoring scale (Welfare Quality, 2009)

QBA=Qualitative Behaviour Assessment.
Sensitivity analysis at criteria level:
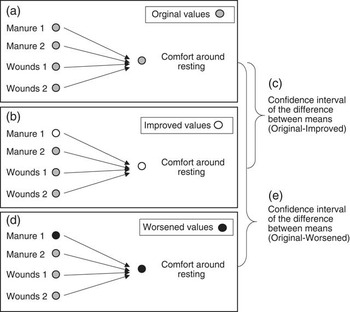
Figure 2 shows an example of how the sensitivity analysis was carried out for the comfort around resting criterion. First, original data for the 44 observations were aggregated into the corresponding criteria following the MAUT methodology, having in total 44 values for each criteria (a, in Figure 2). Second, the data for the 44 observations of only one measure, for instance of manure 1, were replaced by the improved value (for manure 1, the first quartile). Again, the data were aggregated with the MAUT into the corresponding criterion (b, in Figure 2). Third, using the Wilcoxon Signed-Rank test, the confidence interval of the difference between the means of the criterion values obtained with the original data and the criterion values obtained with the improved data was calculated with a confidence level of 90% (α=10) (c, in Figure 2). Fourth, the second (d, in Figure 2) and third (e, in Figure 2) steps were repeated but this time the original data for the 44 observations of the same measure, manure 1, were replaced by the worsened value (the third quartile value for manure 1). These steps were repeated modifying one measure at a time for all the criteria.
Outline of the methodology followed to perform the sensitivity analysis at criteria level with the example of the aggregation of the measures which conform comfort around resting for growing pigs (manure and wounds on the body), following the five steps (a, b, c, d and e) previously described.

Sensitivity analysis at principle level:
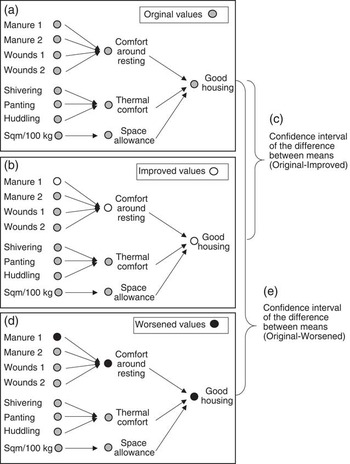
The same methodology was used as for the sensitivity analysis at criteria level, but the results were compared at principle level. Figure 3 shows an example of how the sensitivity analysis was carried out for the good housing principle.
Outline of the methodology followed to perform the sensitivity analysis at principle level with the example of good housing following the five steps (a, b, c, d and e) previously described.

Results
Five welfare measures, twisted snouts, rectal prolapse, shivering, panting and huddling did not occur in any of the 44 observations. The mean, median (range), first quartile and third quartile of the welfare measures with prevalence in the 44 observations are listed in Table 2. Some measures were observed with a prevalence at farm level of <1%, these measures were lean animals, bursitis 2, lameness 1, lameness 2, scouring, skin discolouration, hernia 1 and hernia 2. The low prevalence of coughs and sneezes occurred due to the fact that it was not possible for the assessor to identify the number of animals coughing or sneezing and due to this fact the number of coughs and sneezes was divided by the total number of animals in the pen.
Means, SD, first quartile (1Q) and third quartile (3Q) of growing pigs’ welfare measures for the 44 observations

1 Median, range and quartiles of descriptors (active, relaxed, fearful, etc.) for the Qualitative Behaviour Assessment (QBA) not shown.
Validation of the multi-attribute utility theory model
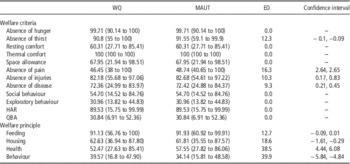
Means and ranges of variation for the welfare criteria and principles obtained with the WQ and MAUT methodologies are given in Table 3. The ED between the WQ and the MAUT methods for each criterion and principle are also depicted in Table 3 along with the confidence intervals of the difference between the means for each criterion.
Means (range) of growing pigs’ welfare criteria and principles obtained with the Welfare Quality® (WQ) methodology and the multi-attribute utility theory (MAUT), Euclidean distances (ED) between the methods for each criterion and principle and confidence intervals for the differences of means

QBA=Qualitative Behaviour Assessment.
Confidence intervals of the criteria absence of hunger, comfort around resting, thermal comfort, space allowance, social behaviour, exploratory behaviour, good human–animal relationship (HAR) and positive emotional state not shown due to no differences between the WQ and MAUT methods (ED=0).
There were no differences between the methods for the following criteria: absence of hunger, comfort around resting, thermal comfort, space allowance, social behaviour, exploratory behaviour, human–animal relationship and Qualitative Behaviour Assessment. The differences between the methods for absence of thirst, absence of pain induced by management procedures, absence of injuries and absence of disease were small being the Euclidian distances 12.3, 16.3, 10.3 and 9.3, respectively, and being the confidence intervals between the means very narrow and close to the 0 value. Comparing the differences between the methods for the four welfare principles, it can be seen that good feeding and good housing had lower differences than good health and appropriate behaviour. The confidence interval for the differences between methods’ means for good feeding included the 0 value, which means that there were no significant differences between the methods.
Sensitivity analysis of the multi-attribute utility theory model
For the sensitivity analysis, only the quantitative measures were considered due to the fact that the variations in qualitative measures were not comparable in terms of sensitivity with the rest of the measures. Thus, the qualitative measures related to absence of thirst and absence of pain induced by management procedure criteria were excluded from the study. Five quantitative welfare measures, twisted snouts, rectal prolapse, shivering, panting and huddling, were also excluded from the sensitivity analysis because of no variability between the observations. For some measures, there was no influence on the results by improving/worsening their values either at criteria or at principle level, and thus, the confidence intervals could not be calculated due to the fact that the observations were tied. These measures all belong to the disease criteria, and were pumping, pleuritis, coughs, sneezes, scouring, skin condition and hernias 1 and 2.
Sensitivity analysis at criteria level
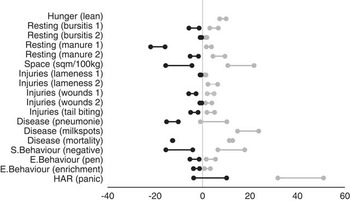
Figure 4 shows the confidence intervals of the difference in means between the original situation and the improved situation (grey) and between the original situation and the worsened situation (black) for each criteria with respect to the modified welfare measure.
Confidence intervals of the difference of means between the original situation and the improved situation (grey), and between the original situation and the worsened situation (black) for each welfare criteria with respect to the modified welfare measure for growing pigs.

The most important welfare measure for worsening the level of comfort around resting in our study was manure 1. An increase in the mean value of manure 1 from 10.51 to 17.95 resulted in a decrease in the mean values of comfort around resting, which varied between −21.85 and −17.55 with a 90% confidence level. However, manure 1 had a low influence on improving the level of welfare, although the differences between the original value and the improved value were high, being the mean of the original situation 10.52 and 1.91 of the improved situation, the confidence interval of the differences of means was 1.63 to 3.78.
For absence of injuries there was no single measure which led to an important difference between the original and the improved or worsened situation. The confidence intervals of the differences of means between the original and the improved situation indicated that improving or worsening the level of each measure never led to an increase or decrease at criteria level >10 units, which in this study was considered as a threshold to estimate when a measure was influencing the results at criteria level.
For absence of disease, only three measures (pneumonia, milkspots and mortality) had an influence on improving or worsening the level of welfare. An increase in the mean value of pneumonia from 5.71 to 8.10 resulted in a decrease in the mean value of absence of disease, which lay between −15.13 and −10.22 with a 90% confidence level. A decrease in the mean value of pneumonia from 5.71 to 3.10 resulted in an increase in the mean value of absence of disease, which varied between −0.9 and 10.22 with a 90% confidence level. For milkspots, substituting the original values with the first quartile and the third quartile resulted in an improved situation of welfare. The decrease in the mean value of milkspots from 9.70 to 1.20 and from 9.70 to 9.6 resulted in an increase in the mean value of absence of disease, which lay between 14.78 and 23.68 with a 90% confidence level. An increase in the mean value of mortality from 2.5 to 3.00 resulted in a decrease in the mean value of absence of disease, which varied between −12.69 and −12.54 with a 90% confidence level. A decrease in the mean value of mortality from 2.50 to 2.00 resulted in an increase in the mean values of absence of disease, which varied between 11.28 and 12.69 with a 90% confidence level. The rest of the measures, that is, the results tied, had no influence at all and thus the confidence interval of the differences of means could not be calculated.
Pen and enrichment investigation had low influence on improving or worsening the values of the exploratory behaviour criterion. The confidence intervals of the differences in means between the original and the improved situation indicated that improving or worsening the level of each measure never led to an increase or decrease of >10 units at criteria level.
For the criteria conformed by a single measure, such as absence of hunger (assessed by percentage of lean animals), space allowance (sq m/100 kg pig), social behaviour (negative behaviour) and human–animal relationship (panic), these measures had greater influence to improve or worsen the level of welfare than measures which were aggregated to form criteria, although the range of variation for some of these measures was low, as is the case of lean animals.
Sensitivity analysis at principle level
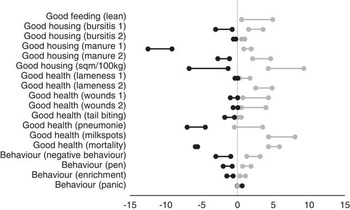
Figure 5 shows the confidence intervals of the difference in means between the original situation and the improved situation (grey), and between the original situation and the worsened situation (black) for each principle with respect to the modified welfare measure.
Confidence intervals of the difference of means between the original situation and the improved situation (grey) and between the original situation and the worsened situation (black) for each welfare principle with respect to the modified welfare measure for growing pigs.

By aggregating the criteria into principles, the sensitivity of the model to an improvement or worsening of the values of the measures was lower than that at criteria level. We found that only two measures which led to important differences in the confidence intervals of the means at criteria level also led to important differences at principle level (confidence intervals of the differences in means in which at least one of the confidence limits reached 10 units). These measures were manure on the body 1 (worsened) and space allowance (improved and worsened). For some other measures, at least one of the confidence limits of the confidence interval reached values >5 units and <10 units: these measures were manure 2 (improved), lameness 2 (improved/worsened), pneumonia (worsened), milkspots (improved/worsened) and mortality (improved/worsened). The rest of the measures had little influence on improving the welfare at principle level, being the confidence limits <5 units.
Discussion
Data
In the present study, real data instead of simulated data were used in order to perform the validation and the sensitivity analysis of the model. The main advantage of using real data was that the actual performance of the measures is known (prevalence, variation, interactions between measures), whereas the use of simulated data, as carried out by Vries et al. (Reference de Vries, Bokkers, van Schaik, Botreau, Engel, Dijkstra and de Boer2013), would assess the performance of the model in extreme situations which may not occur in practical conditions. On the other hand, by using real data some measures may have low variation or non-prevalence on farms, and thus, it may be difficult to assess the sensitivity of the model for these measures. However, we found comparable results with the study of Temple et al. (Reference Temple, Courboulay, Manteca, Velarde and Dalmau2011a) and thus we could assume that our results may be representative of the growing pigs. Running the WQ protocol on a larger scale of farms may be necessary to obtain more information on the actual variation in the welfare measures, due to the fact that few studies have yet been carried out.
Validation
Validation at criteria level
There were no differences between the WQ and the MAUT methods for the criteria assessed by just one welfare measure, such as absence of hunger, space allowance, social behaviour, positive emotional state and exploratory behaviour, which was assessed by two measures but combined using a weighted sum in both methodologies before determining the I-spline (WQ) and the utility functions (MAUT). From this, it can be concluded that the utility functions determined in MACBETH perfectly fitted the I-spline functions proposed in the WQ protocol. Slight differences were found for the criteria comfort around resting and absence of injuries, which are assessed by several measures. These differences appear to be related to the aggregation step, not with the utility function determination, as the utility functions determined in MACBETH perfectly fitted the I-spline functions proposed in the WQ protocol, also for the measures which form these criteria. Differences between the methods did occur, however, although the differences in the parameters of the CI between the methods were minor, and did not lead to differences between the methods for the learning data sets when these parameters were implemented in a large data set. Although the differences were minor, this highlights the importance of the aggregation of the parameters, even though varying them slightly can produce differences in the results. The differences between the methods for absence of disease are explained by the different methodologies used in the WQ and MAUT models due to the fact that WQ uses a weighted sum to combine the number of warnings and alarms found in the different disease areas before determining the I-spline function. In this study, a utility function was first produced per disease area and the utilities were then aggregated using the CI. There were small differences or almost no differences between the methods for the qualitative criteria (absence of thirst, thermal comfort and absence of pain induced by management procedures) although the methodologies used in the WQ and the MAUT were very different. This was due to the fact that the data sets used to determine the aggregation parameters of the CI covered all the possible scenarios found on a farm, and thus, once the model was adjusted, there could be no further variations.
Validation at principle level
The differences in the results at principle level were related with two factors, first, the differences between the methods at criteria level and second, due to the parameters used in the aggregation step. Good feeding, which is in turn assessed by absence of hunger and absence of thirst, was the principle with lower differences between methods at principle level, and as shown by the two criteria that form it had almost no differences between methods. Thus, it was possible to estimate that the differences between the methods were mainly caused by the parameters used in the aggregation step. Comparing the parameters of the CI used in the WQ protocol and the parameters used in this study, it is possible to see small differences, although, differences between the methods were found. The Shapley values (which measure the importance of the different criteria) used in WQ were 0.39 and 0.61 for absence of hunger and absence of thirst, and the interaction index between both criteria was 0.66. In this study, the Shapley values assigned to absence of hunger and absence of disease were 0.38 and 0.62, respectively, and the interaction index was 0.64. The differences between methods were also small for good housing. There were no differences at all between the methods for the criteria that form this principle, thus, it can be concluded that the aggregation parameters were responsible for the differences at principle level. Larger differences between the methods occurred for good health and appropriate behaviour compared with good feeding and good housing. The effect of the differences between the aggregation parameters for good health was joined with the differences between the results at criteria level. WQ proposes three-additive capacities for the aggregation of the criteria, which form the appropriate behaviour principle, whereas we decided to limit the capacity to two-additive solutions to keep things simple due to the fact that interactions between more than two criteria may be difficult to interpret. The differences between methods appear to be related to the differences between considering interactions between pairs of criteria (two-additive capacity) and considering interactions between three criteria (three-additive capacity).
Sensitivity analysis
For the sensitivity analysis, the original values were modified by improved or worsened values which corresponded to the first and the third quartiles of the data. One of the problems for the sensitivity analysis of an overall welfare assessment arises when the range of variation of a measure is not known. The low variation of some measures could explain the low influence on improving or worsening the welfare both at the criteria and principle levels of these measures due to the fact that the first and the third quartiles of the measures were not representative of an improvement or a worsening in the level of welfare. The means and standard deviation for the measures with low incidence were compared with the means and standard deviation of welfare measures presented in the study of Temple et al. (Reference Temple, Courboulay, Manteca, Velarde and Dalmau2011a), where the WQ protocol was run to assess the welfare of growing pigs kept under intensive conditions in Spain. This comparison aimed at estimating whether the low influence of these measures might only have occurred in our study due to the values chosen as an improved or a worsened situation of welfare, or whether the low influence of these measures can be generalised due to similar prevalence in other studies.
Sensitivity analysis at criteria level
Two main conclusions can be drawn for the sensitivity analysis for comfort around resting. First, the low influence of bursitis in this study could have been caused by its low variation at farm level. For bursitis 1 and bursitis 2, respectively, mean values and SD of 50.74±13.75 and 0.96±1.32 were found, whereas Temple et al. (Reference Temple, Courboulay, Manteca, Velarde and Dalmau2011a) presented values with higher variation for these measures, 45.06±21.04 and 4.4±5.6, respectively. Second, for manure on the body, similar values to Temple et al. (Reference Temple, Courboulay, Manteca, Velarde and Dalmau2011a) were found. However, although manure 2 assessed a severe condition of welfare and manure 1 a moderate condition, the results did not indicate a greater influence of the severe condition but of the moderate condition. Thus, it can be assumed that due to the use of a weighted sum to aggregate the moderate and the severe conditions before determining the utility function, compensation occurred between both levels, and the model was not sensitive to the severe condition due to the fact that its values were smaller than the values of the moderate condition. Although it was emphasised throughout the development of the WQ model that welfare scores should not compensate each other (Botreau et al., Reference Botreau, Bracke, Perny, Butterworth, Capdeville, van Reenen and Veissier2007; Veissier et al., Reference Veissier, Jensen, Botreau and Sandoe2011), compensation occurred in the first stages by using linear combinations, which were used both in the WQ protocol and in this alternative methodology. Providing an individual utility function for each severity measure and aggregating them afterwards by using the CI could prove to be an alternative solution. On the one hand, the model accuracy would increase, but on the other, so would the complexity of the decision process, demanding from the DMs that they interpret a higher number of measures in terms of welfare.
For absence of injuries there was no single measure which led to an important difference between the original and the improved or worsened situation. There were no differences in the confidence intervals for the moderate and severe conditions of lameness and wounds on the body either. Low prevalence were found at farm level for the measures which form this criteria. Comparing our data with the study of Temple et al. (Reference Temple, Courboulay, Manteca, Velarde and Dalmau2011a) similar values for the absence of injuries measures were found. Temple et al. (Reference Temple, Courboulay, Manteca, Velarde and Dalmau2011a) found means and SD for lameness 1, lameness 2, wounds on the body 2 and tail biting of 0.2±0.43, 0.2±0.45, 0.9±1.38 and 0.9±2.02, respectively, whereas the values found in this study for the same measures were 0.29±0.44, 0.24±0.46, 1.03±1.98 and 2.88±3.09, respectively. Thus, it can be concluded that due to the general low variance of these measures on farms (comparable with other studies), these measures have a low influence on improving or worsening the level of welfare.
What can be concluded from the sensitivity analysis for absence of disease is that by converting the original data into an ordinal scale (three qualitative levels: no problem recorded, a warning or an alarm), the original values at criteria level only changed when alarm or warning thresholds were reached. Due to this fact, the model was only sensitive when the number of warnings or alarms were changed by improving or worsening the measures values. Thus, it was impossible for the model to distinguish between situations where the thresholds were slightly or greatly exceeded. Further, conversion into an ordinal scale might be reconsidered, and the measures should be treated as quantitative ones, using the warning and alarm thresholds as references for the DM to build the utility functions. Pen exploration and enrichment exploration had low influences on improving or worsening the values of exploratory behaviour criterion. The values obtained for exploration of enrichment material were lower than values obtained in the study of Temple et al. (Reference Temple, Courboulay, Manteca, Velarde and Dalmau2011a). Thus, it can be concluded that the low influence of this measure lay in its low variability. However, although the ranges of variation for pen investigation were wider and similar to the values obtained by Temple et al. (Reference Temple, Courboulay, Manteca, Velarde and Dalmau2011a), the influence of this measure was low. It can be concluded that compensation occurred to form the criteria values due to the fact that a weighted sum was used to combine pen investigation and enrichment investigation, and enrichment investigation is considered more important than pen investigation. This compensation did not allow the model to be sensitive to pen investigation. As can be seen for the criteria conformed by a single measure, such as absence of hunger (assessed by % of lean animals), space allowance (sq m/100 kg pig), social behaviour (negative behaviour) and human–animal relationship (panic), the welfare measures had greater influence to improve or worsen the level of welfare than measures aggregated to form criteria, although the range of variation for some of these measures was low, as is the case for lean animals. What this suggests is that by aggregating the measures into criteria the sensitivity of the model for the measures was diluted, although compensation between measures was always limited.
Sensitivity analysis at principle level
By aggregating the criteria into principles, the sensitivity of the model to an improvement or worsening of the values of the measures was lower than that at criteria level. Only two measures which led to important differences in the confidence intervals of the means at criteria level also led to important differences at principle level (confidence intervals of the differences of means in which at least one of the confidence limits reached 10 units). These measures were manure on the body 1 (worsened) and space allowance (improved and worsened). It can be concluded that by following a three aggregation step the sensitivity of the model is reduced, and thus, it may be difficult to distinguish between farms with different levels of welfare at principle level, and furthermore, this effect can be even more marked by aggregating the four welfare principles into an overall evaluation.
Conclusions
By using the MAUT, it has been proven that the main difficulties described by Botreau et al. (Reference Botreau, Bracke, Perny, Butterworth, Capdeville, van Reenen and Veissier2007) faced by a multi-criteria aggregation model can be solved by allowing this method to assign different importance to the measures, by limiting the compensation between them and by working with data collected on different types of scales. Furthermore, the model’s flexibility allowed us to fit the WQ assessment, obtaining slight differences between our results and the ones obtained by implementing the WQ protocol, both at criteria and principle level. Thus, it can be concluded that this model could be implemented to produce an overall assessment of animal welfare in the context of the WQ protocol for growing pigs. Furthermore, this methodology could be also used as a framework to produce an overall assessment of welfare for other livestock species. However, from the sensitivity analysis carried out in this study, two main points were observed which may need to be reconsidered. First, the use of weighted sums to aggregate moderate and severe conditions as well as pen and enrichment investigation should be reconsidered. Second, the conversion of disease measures into ordinal scores which makes it impossible to distinguish between farms which slightly or largely exceed thresholds. Finally, the suitability of the three-step aggregation process to distinguish between farms may need to be studied further, due to the fact that by aggregating the criteria into principles, the sensitivity of the model to an improvement or worsening of the values of the measures was reduced due to the aggregation of the values. Running the model on a larger scale of farms may be needed to know the actual variation in the measures on farms. In the case of no variation between the farms at principle level, as occurred in our observations, or at overall assessment level, the three-step aggregation process should be reconsidered.
Acknowledgements
The present study is part of the PHENOMICS research project that is funded by the German Federal Ministry of education and research.