





1 Introduction
Underwater shock waves induced by illumination with a nanosecond laser pulse are utilized in various applications including low-invasive medical treatments (Razvi et al. Reference Razvi, Denstedt, Chun and Sales1996; Lee & Doukas Reference Lee and Doukas1999; Kodama, Hamblin & Doukas Reference Kodama, Hamblin and Doukas2000; Lam, Greene & Gupta Reference Lam, Greene and Gupta2002; Sofer et al. Reference Sofer, Watterson, Wollin, Nott, Razvi and Denstedt2002; Sankin et al. Reference Sankin, Simmons, Zhu and Zhong2005; Klaseboer et al. Reference Klaseboer, Fong, Turangan, Khoo, Szeri, Calvisi, Sankin and Zhong2007). The laser-induced shock wave can trigger a sudden motion of a liquid on a free surface, which, for instance, results in the generation of high-speed microjets applicable for needle-free injection devices (Menezes, Kumar & Takayama Reference Menezes, Kumar and Takayama2009; Thoroddsen et al. Reference Thoroddsen, Takehara, Etoh and Ohl2009; Tagawa et al. Reference Tagawa, Oudalov, Visser, Peters, van der Meer, Sun, Prosperetti and Lohse2012, Reference Tagawa, Oudalov, Ghalbzouri, Sun and Lohse2013; Marston & Thoroddsen Reference Marston and Thoroddsen2015).
For the sudden motion of the liquid, one of the most important quantities is the pressure impulse (Batchelor Reference Batchelor1967; Cooker & Peregrine Reference Cooker and Peregrine1995; Antkowiak et al. Reference Antkowiak, Bremond, Le Dizès and Villermaux2007). Its definition is given as:
 $$\begin{eqnarray}P=\int p\,\text{d}t,\end{eqnarray}$$
where
 $p$
is pressure of the liquid and
 $t$
is the elapsed time. Peters et al. (Reference Peters, Tagawa, Oudalov, Sun, Prosperetti, Lohse and van der Meer2013) numerically reproduced the high-speed microjet reported by Tagawa et al. (Reference Tagawa, Oudalov, Visser, Peters, van der Meer, Sun, Prosperetti and Lohse2012) and confirmed that the pressure impulse is the key quantity for the motion of the jet. Thus a detailed investigation of the pressure impulse of a laser-induced shock wave is of great importance.
The shock wave has been often modelled as a spherical shock, which assumes a spherically symmetric pressure distribution and spherical shape of the shock. However, some researchers have pointed out that the spherical shock model is not applicable in certain cases (Buzukov, Popov & Teslenko Reference Buzukov, Popov and Teslenko1969; Vogel, Busch & Parlitz Reference Vogel, Busch and Parlitz1996a
; Noack & Vogel Reference Noack and Vogel1998; Sankin, Zhou & Zhong Reference Sankin, Zhou and Zhong2008; Lauterborn & Vogel Reference Lauterborn and Vogel2013). Buzukov et al. (Reference Buzukov, Popov and Teslenko1969) reported that a bubble which is not spherically symmetric is observed with a series of compression waves. Sankin et al. (Reference Sankin, Zhou and Zhong2008) measured pressure peaks for a shock at various positions and determined that the peak pressure at a point in the direction perpendicular to the laser beam is more than twice as high as that in the direction of the laser. Vogel et al. (Reference Vogel, Busch and Parlitz1996a
) and Noack & Vogel (Reference Noack and Vogel1998) reported that the shape of a shock wave is not spherical due to conical plasma formation. The movements of the breakdown front during plasma formation in water had been intensively studied utilizing streak photographs (e.g. Docchio et al.
Reference Docchio, Regondi, Capon and Mellerio1988a
,Reference Docchio, Regondi, Capon and Mellerio
b
). In our experiments we also observe a plasma which is not spherically symmetric, bubbles and shock waves, as shown in figure 1. Figure 1(a) shows a collection of point-like plasmas in a conical region (like ‘grapes of plasmas’). Figure 1(b) shows another snapshot of both bubbles and shock waves. It confirms that for small numerical apertures (
 $\mathit{NAs}$
) of an optical system the shock waves are not from a single conical plasma but from a collection of plasmas in a conical region. Note that Vogel et al. (Reference Vogel, Nahen, Theisen and Noack1996b
) did show single conical plasmas. Despite these considerations, a common model for the pressure impulse of laser-induced shock waves has not been developed.
Snapshots of (a) a collection of plasmas in a conical region with
 $10\times$
objective, 6.9 mJ and (b) a collection of shock waves originated from plasmas. Time
 $t$
denotes the elapsed time from the start of illumination with the laser pulse.

In this study, we report on experimental observations of a laser-induced shock wave with special attention paid to the pressure impulse. We also propose a new model of the shock wave to rationalize the observations. Such an observation is, however, challenging because each of the phenomena involved in generating the shock occur within a short time; illumination with a laser pulse first triggers the emergence of the plasma in water, which leads to rapid expansion of a bubble and emission of a shock wave (Noack & Vogel Reference Noack and Vogel1999; Lauterborn et al.
Reference Lauterborn, Kurz, Schenke, Lindau and Wolfrum2001). The time scale for plasma growth is of the order of nanoseconds and the shock velocity in water is approximately
 $1500~\text{m}~\text{s}^{-1}$
. In this study plasma growth, the expansion process of the shock, and the pressure in water have been simultaneously measured using a combined measurement system, in which ultra-high-speed recording systems and pressure sensors are installed.
Measurement system consisting of two ultra-high-speed cameras and two pressure sensors. An ultra-high-speed video camera records laser-induced shock waves and bubbles at up to
 $5\times 10^{6}$
frames per second (fps) with a synchronized laser stroboscope. Plasma luminescence is captured by another ultra-high-speed video camera at up to
 $200\times 10^{6}$
fps. Temporal pressure evolution is measured by two hydrophones. One hydrophone is arranged in the direction of the laser beam (
 $\unicode[STIX]{x1D703}=0^{\circ }$
) at a stand-off distance of ca. 5 mm from the laser focal point, while the other hydrophone is at right angles to the hydrophone (
 $\unicode[STIX]{x1D703}=90^{\circ }$
) at the same stand-off distance.

2 Experimental set-up and method
Figure 2 shows the combined measurement system. An underwater shock wave is induced by a 532 nm, 6 ns laser pulse (Nd : YAG laser Nano S PIV, Litron Lasers) focused through an objective lens to a point inside a water-filled glass container (
 $100\times 100\times 450$
mm). The initial laser beam diameter is 4 mm. Water is distilled by a water-purification system (Milli-Q Integral, Merck) at room temperature (
 $15\,^{\circ }\text{C}{-}20\,^{\circ }\text{C}$
) and is gas saturated. Its electrical conductivity is
 $13~\text{M}\unicode[STIX]{x03A9}~\text{cm}$
. The two experimental parameters are the magnification of the objective lens (
 $5\times [NA0.1]$
,
 $10\times [NA0.25]$
,
 $20\times [NA0.25]$
, MPLN series, Olympus) and the laser energy (2.6 mJ, 6.9 mJ, 12.3 mJ). The parfocalizing distance of the objective (PFD) is 45 mm for all the microscope objectives while working distances are 20 mm, 10.6 mm and 25 mm for the
 $5\times$
,
 $10\times$
and
 $20\times$
objectives, respectively. Focusing angles of each microscope objective are
 $1^{\circ }$
,
 $4^{\circ }$
and
 $6^{\circ }$
for
 $5\times$
,
 $10\times$
and
 $20\times$
objectives, respectively. The diffraction-limited focused-beam diameter
 $d$
is calculated by the following equation (Vogel et al.
Reference Vogel, Noack, Hüttman and Paltauf2005),
 $$\begin{eqnarray}d=1.22\frac{\unicode[STIX]{x1D706}}{NA},\end{eqnarray}$$
where
 $\unicode[STIX]{x1D706}$
(
 $=$
532 nm) is the wavelength of a laser,
 $NA$
(
 $5\times [0.10]$
,
 $10\times [0.25]$
,
 $20\times [0.25]$
) is the numerical aperture of the microscope objective. The calculated
 $d$
is
 $6.5~\unicode[STIX]{x03BC}\text{m}$
,
 $2.6~\unicode[STIX]{x03BC}\text{m}$
and
 $2.6~\unicode[STIX]{x03BC}\text{m}$
with
 $5\times$
,
 $10\times$
and
 $20\times$
, respectively.
The combined measurement system consists of two hydrophones (Muller Platte-Gauge, Muller) and two ultra-high-speed cameras. One of the hydrophones is placed 5 mm away from the focal point of the laser in the direction of the laser beam (
 $\unicode[STIX]{x1D703}=0^{\circ }$
direction). The other hydrophone is at the same distance but in the direction perpendicular to the laser beam (
 $\unicode[STIX]{x1D703}=90^{\circ }$
direction). The impulse response time (rise time of an impulsive signal) of the hydrophones (the piezoelectric polyvinylidenefluoride (PVDF) type hydrophone) utilized in this study is 35–45 ns. The hydrophones are connected to an oscilloscope (ViewGo II DS-5554A, Iwatsu) for recording of their signals. The sampling frequency of the oscilloscope is 2 GHz, with a temporal resolution of 0.5 ns. The oscilloscope digitalizes the pressure value every 0.03 MPa. One of the cameras is an ultra-high-speed camera (Imacon 200, DRS Hadland) with up to
 $200\times 10^{6}$
fps (5 ns time interval) and a
 $1200\times 980$
pixel array to record plasma formation and shock waves in the near field. The other camera is another ultra-high-speed video camera (Kirana, Specialized Imaging) with up to
 $5\times 10^{6}$
fps and a
 $924\times 768$
pixel array for imaging shadowgraph of shock-wave propagation. This camera is synchronized with a laser stroboscope that operates with a pulse width of 20 ns as a back illumination source (SI-LUX 640, Specialized Imaging), the repetition rate of which is also up to
 $5\times 10^{6}$
Hz. A digital delay generator (Model 575, BNC) is used to trigger the laser, the hydrophones, the cameras and the stroboscope. Each measurement was repeated more than three times under the same experimental conditions.
3 Results and discussion
3.1 Observations and pressure measurement
Figure 3 (in which
 $t$
denotes the elapsed time from the start of illumination with the laser pulse) shows the measurement results obtained with the
 $10\times$
objective lens. Figure 3(a) shows a snapshot of the plasma luminescence in an elongated area, the major axis of which is in the direction of the laser beam. The image sequence of the plasma confirms that all parts of the plasma emit strong lights within
 $\pm 5$
ns. A laser-induced bubble then emerges where the plasma was formed (figure 3
b) and its shape is also elongated in the direction of the laser beam. At
 $t=0.4~\unicode[STIX]{x03BC}\text{s}$
, non-single spherical shocks are observed. In contrast, at
 $t=2.4~\unicode[STIX]{x03BC}\text{s}$
, the shock could be regarded as a single spherical shock (see figure 3
c). However, enlarged images for
 $\unicode[STIX]{x1D703}=0^{\circ }$
and
 $\unicode[STIX]{x1D703}=90^{\circ }$
(figure 3
c
 $\unicode[STIX]{x1D703}=0^{\circ }$
and
 $\unicode[STIX]{x1D703}=90^{\circ }$
) display a clear difference. Two shock waves for
 $\unicode[STIX]{x1D703}=0^{\circ }$
(figure 3
c
 $\unicode[STIX]{x1D703}=0^{\circ }$
), which are different from the single shock wave for
 $\unicode[STIX]{x1D703}=90^{\circ }$
(figure 3
c
 $\unicode[STIX]{x1D703}=90^{\circ }$
). Figure 3(d) shows the temporal evolution of the pressure measured with the two hydrophones placed at different positions. There are two peaks for
 $\unicode[STIX]{x1D703}=0^{\circ }$
, while there is a single large peak for
 $\unicode[STIX]{x1D703}=90^{\circ }$
, which is approximately 1.3 times higher than that for
 $\unicode[STIX]{x1D703}=0^{\circ }$
. Note that this dependence of the peak pressure on the angle
 $\unicode[STIX]{x1D703}$
is the same as that reported by Sankin et al. (Reference Sankin, Zhou and Zhong2008). For the
 $5\times$
objective lens, this trend is much more pronounced: four plasma groups and four shock waves separated from each other are evident (see figure 4).
Measurement results for a laser-induced underwater shock wave obtained with a
 $10\times$
objective lens. (a) Plasma luminescence at
 $t=5$
ns after the laser is fired. The image is captured by an ultra-high-speed video camera at 200 Mfps. (b) Shock waves and bubbles at
 $t=0.4~\unicode[STIX]{x03BC}\text{s}$
imaged with an ultra-high-speed video camera at 5 Mfps. (c) Shock waves at
 $t=2.4~\unicode[STIX]{x03BC}\text{s}$
measured with an ultra-high-speed video camera at 5 Mfps. Enlarged images for the areas of
 $\unicode[STIX]{x1D703}=0^{\circ }$
and
 $\unicode[STIX]{x1D703}=90^{\circ }$
are also presented. (d) Shock pressure measured by the two hydrophones arranged at
 $\unicode[STIX]{x1D703}=0^{\circ }$
(red line) and
 $\unicode[STIX]{x1D703}=90^{\circ }$
(blue line) with respect to the laser direction. Integrations for the pressure with respect to the elapsed time indicate pressure impulses.

Measurement results for a laser-induced underwater shock wave obtained with a
 $5\times$
objective lens. Captions for (a–d) are the same as those in figure 3.

3.2 Pressure impulse
Here, we compute the pressure impulse for
 $\unicode[STIX]{x1D703}=0^{\circ }$
,
 $P_{0}$
and that for
 $\unicode[STIX]{x1D703}=90^{\circ }$
,
 $P_{90}$
. We calculate the pressure impulse from
 $t=2.5$
to
 $4.5~\unicode[STIX]{x03BC}\text{s}$
, during which period of time the plasma formation (
 ${<}10$
ns) is totally covered, i.e. the time window does not affect the results of pressure impulse. Integrations for the pressure with respect to the elapsed time indicate pressure impulses. Both
 $P_{0}$
and
 $P_{90}$
for the shock obtained with the
 $10\times$
objective lens are shown in figure 3(d) in units of Pa s.
 $P_{0}$
is in reasonable agreement with
 $P_{90}$
. Furthermore, the pressure impulse and peak pressure for
 $\unicode[STIX]{x1D703}=0^{\circ }$
and
 $90^{\circ }$
were examined for all the other experimental conditions. While the peak pressure for
 $\unicode[STIX]{x1D703}=0^{\circ }$
and
 $90^{\circ }$
differ significantly, as shown in figure 5(a),
 $P_{0}$
was in agreement with the corresponding
 $P_{90}$
within the experimental uncertainty for a wide range of experimental parameters (figure 5
b). Note that the order of the pressure impulse in this study is of the same order as is required for practical use for drug delivery of cytoplasmic molecules (Kodama et al.
Reference Kodama, Hamblin and Doukas2000) and the generation of microjets (Tagawa et al.
Reference Tagawa, Oudalov, Visser, Peters, van der Meer, Sun, Prosperetti and Lohse2012, Reference Tagawa, Oudalov, Ghalbzouri, Sun and Lohse2013).
(a) Peak pressure of a laser-induced underwater shock wave measured at
 $\unicode[STIX]{x1D703}=0^{\circ }$
and
 $\unicode[STIX]{x1D703}=90^{\circ }$
for all the experimental conditions. Each presented value is a mean of three measurements and the error bars show the standard deviations. (b) Pressure impulse of a laser-induced shock wave measured at
 $\unicode[STIX]{x1D703}=0^{\circ }$
and
 $\unicode[STIX]{x1D703}=90^{\circ }$
for all the experimental conditions.

Schematic of a multiple structure model for a laser-induced underwater shock wave. Multiple plasmas emit multiple bubbles and spherical shock waves. The shock pressure at a certain point is the sum of the spherical shock pressures that reach the same point.

3.3 Structure of multiple shock waves
Based on the aforementioned results, we here propose a model for the structure of the laser-induced shock wave: the shock has a multiple structure that consists of multiple spherical shock waves, as depicted schematically in figure 6. We assume that each spherical shock wave originates from the corresponding plasma formation. In addition, since the shock wave behaves acoustically at low pressure (
 ${\lesssim}100$
MPa (Vogel et al.
Reference Vogel, Busch and Parlitz1996a
)), we could apply the superposition principle to analyse the pressure impulse in the far field. The net pressure that is produced by two or more shock waves reaching the same point is the sum of the pressure induced by the individual shock waves. A phenomenon that is analogous to this may be the surface wave observed after one or several stones are thrown into a quiescent pond (the so-called Huygens–Fresnel principle). Note that the Huygens–Fresnel principle does not apply for nonlinear shock-wave propagation.
For both the
 $10\times$
and
 $5\times$
objective lenses, this model rationalizes the observations of both pressure peaks and pressure impulse: several peaks for
 $\unicode[STIX]{x1D703}=0^{\circ }$
and the single large peak for
 $\unicode[STIX]{x1D703}=90^{\circ }$
while pressure impulse for
 $\unicode[STIX]{x1D703}=0^{\circ }$
matches the pressure impulse for
 $\unicode[STIX]{x1D703}=90^{\circ }$
. Results for a wide range of experimental parameters (figure 5) may indicate the universality of the multiple structure model for optical breakdown at low or moderate
 $NA$
. Note that this scenario includes the well-known spherical shock model. It should be emphasized that, as observed with the
 $10\times$
objective lens (figure 3), even if just a single plasma or a bubble is observed, the origin of the elongated plasma and bubble is expected to be multiple spots of plasma, which lead to the emergence of multiple spherical shocks, resulting in a notable angular variation of shock pressure. This model for the multiple shock structure could possibly rationalize the results reported in previous research. For instance, Sankin et al. (Reference Sankin, Zhou and Zhong2008) reported that a laser-induced shock wave emitted from an elongated plasma has an angular variation of pressure distribution in the far field. Although the shape of the shock wave appears to be spherical, the elongated plasma may cause a multiple structure of the shock, as observed in the present experiments (see figure 3), which would lead to a pressure peak of the shock which is not spherically symmetric. Besides the aforementioned phenomena in the far field, an anisotropy of the shock wave in the near field of cylindrical plasmas has been reported (e.g. Schoeffmann, Schmidt-Kloiber & Reichel Reference Schoeffmann, Schmidt-Kloiber and Reichel1988), which we discuss in detail in § 3.5.
3.4 Laser-induced plasma and bubbles
Here, attention is given to plasma formation, which is the origin of the multiple shock structure. Figure 7(a) shows the plasma luminescence under all the experimental conditions. Figure 7(b) shows the length of the plasma region in the direction of the laser beam as a function of laser energy for the
 $5\times$
,
 $10\times$
and
 $20\times$
objectives. The length increases with the laser energy for all objectives. With lower magnification, the length of the plasma region becomes longer. The relation between an elongated plasma length (region) and focusing angle or laser pulse energy have been intensively investigated experimentally by Vogel et al. (Reference Vogel, Nahen, Theisen and Noack1996b
). They found that there is a strong dependence of the elongated plasma length on the focusing angle and laser energy: plasma is created in the cone angle of the laser beam proximal to the laser and becomes longer with larger laser energy. Our results are consistent with theirs. Thus multiple plasma formation is dependent on the spherical aberrations of the focusing optics, liquid impurities and the input laser energy (Nahen & Vogel Reference Nahen and Vogel1996; Vogel et al.
Reference Vogel, Busch and Parlitz1996a
,Reference Vogel, Nahen, Theisen and Noack
b
).
(a) Plasma formation under all experimental conditions (Magnification of objective lens:
 $5\times$
,
 $10\times$
,
 $20\times$
. Laser energy: 2.6, 6.9 and 12.3 mJ). The plasma shape is the most elongated with an input energy of 12.3 mJ and the
 $5\times$
objective lens, whereas it is rather spherical with an input energy of 2.6 mJ and the
 $20\times$
objective lens. (b) Length of plasma as a function of the laser energy. The circle plot and error bar show respectively the mean and the standard deviation in 5 trials. Red, blue and green colour bar represent the microscope objective of
 $5\times$
,
 $10\times$
and
 $20\times$
, respectively.

There are two mechanisms which can lead to plasma formation: direct ionization of the medium by multiphoton absorption or avalanche ionization via inverse bremsstrahlung absorption (Vogel et al. Reference Vogel, Nahen, Theisen and Noack1996b ). The mechanism leading to optical breakdown (plasma formation) in this study is avalanche ionization by heating of impurities since the position of plasma formation varies within a certain region. Note that impurities may provide centres for both linear and nonlinear absorption. If the multiphoton process in nonlinear absorption has a lower order than that in pure water, impurities can trigger breakdown. Figure 8 shows snapshots of bubbles (and shock waves) under the same conditions (the same magnification, laser energy, etc.). The number/position of the plasmas vary at every laser shot. If the plasma formation mechanism were purely direct ionization of the medium by multiphoton absorption, an identical plasma shape should be observed for every laser shot in the same focusing optics with the same laser energy.
Note that multiple plasma generation will not be avoided by ‘perfect’ focusing without any spherical aberrations since the plasma occurs in the region where the local energy exceeds the breakdown thresholds and thus the plasmas do not always occur at the perfectly focused point (Vogel et al. Reference Vogel, Nahen, Theisen, Birngruber, Thomas and Rockwell1999a , Reference Vogel, Noack, Hüttman and Paltauf2005). Therefore, the focusing angle is a crucial parameter since it strongly affects the local energy density. In our experiment, there exists a strong relation between the length of the plasma region and the focusing angle.
In the case of linear sound propagation, for an extremely elongated cylindrical (or conical) source, anisotropic emission is expected with more total energy and total impulse in the directions perpendicular to the cylinder than along its axis. However, both bubbles and shock waves in the near field (e.g. figure 1) show that the source is not a single plasma but a collection of point-like plasmas in a conical region. Therefore, even in the case of linear sound propagation, it is not obvious to assume anisotropy of the total energy and impulse.
The number of bubbles depends on the laser energy and the objective magnification, as shown in figure 9. The number of bubbles increases with increasing laser energy and a lowering of the objective magnification. This trend is consistent with the length of plasma region as shown in figure 7. We measure the distances between the bubble centres and count the number of times that a certain distance emerges for all experimental conditions. Figure 10(a–c) represents the histogram of the distances of each bubble centre for the microscope objectives at
 $5\times$
,
 $10\times$
and
 $20\times$
, respectively. The number of times is the sum of the three trials. The average distance for each condition depends on the focusing angle (microscope objective) and the laser energy. Bubble centres are not always equidistant.
Snapshots of laser-induced bubbles and shock waves with
 $5\times$
,
 $10\times$
, 6.9 mJ,
 $t=50$
ns. These results are obtained under the same conditions.

Number of bubbles of as a function of the laser energy. Each colour bar represents the result of one pulsed laser. Red, blue and green colour bars represent the microscope objective of
 $5\times$
,
 $10\times$
and
 $20\times$
, respectively.

Histogram of the distances between bubble centres. Vertical axis is number of times that a certain distance emerges for all experiments; (a–c) show the histogram of the microscope objective of
 $5\times$
,
 $10\times$
and
 $20\times$
, respectively. The colour of the bar represents the energy of a pulsed laser. The blue, green and red bars relate to 2.6, 6.9 and 12.3 mJ, respectively.

3.5 Shock wave in the near field
In this section, we estimate the pressure decay in the near field in order to discuss energy dissipation. The estimation of energy dissipation for multiple plasmas and shock waves is, however, a large challenge since it is hard to disentangle the energy dissipation and nonlinear interaction in the near field.
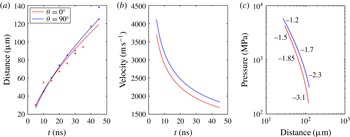
We now use a high-speed camera for following shock-wave emission from the source in the near field. We take snapshots of the shock wave, follow its position (figure 11
a), derive its velocity (figure 11
b) and estimate the pressure (figure 11
c). To estimate the pressure in a shock front
 $p_{s}$
, we apply following equation (Vogel et al.
Reference Vogel, Busch and Parlitz1996a
),
 $$\begin{eqnarray}p_{s}=c_{1}\unicode[STIX]{x1D70C}_{0}u_{s}(10^{(u_{s}-c_{0})/c_{2}}-1)+p_{\infty },\end{eqnarray}$$
where
 $\unicode[STIX]{x1D70C}_{0}$
is the density of water before compression by the shock wave,
 $c_{0}$
is the normal sound velocity in water,
 $c_{1}=5190~\text{m}~\text{s}^{-1}$
,
 $c_{2}=25\,305~\text{m}~\text{s}^{-1}$
and
 $p_{\infty }$
is the hydrostatic pressure. The results show that, in the near field, the pressure of the shock in the direction perpendicular to the laser beam is higher than that in the direction of the laser beam, as shown in figure 11(c). Note that Vogel et al. (Reference Vogel, Busch and Parlitz1996a
), Noack & Vogel (Reference Noack and Vogel1998) found similar pressure values close to the plasma rim as presented in the present study. The energy dissipation at the fronts of high-pressure shock waves is thus expected to be faster than at the low-pressure fronts since Vogel et al. (Reference Vogel, Noack, Nahen, Theisen, Busch, Parlitz, Hammer, Noojin, Rockwell and Birngruber1999b
) showed that the dissipation rate of acoustic energy is proportional to the pressure jump at the shock front. However, the pressure decay related to energy dissipation is slightly slower at the front of a high-pressure shock wave than that at a low-pressure front. Similar results had been reported by Schoeffmann et al. (Reference Schoeffmann, Schmidt-Kloiber and Reichel1988), Vogel et al. (Reference Vogel, Busch and Parlitz1996a
) that the pressure decay is not faster at the fronts of high-pressure shock waves than those of low-pressure fronts. Vogel et al. (Reference Vogel, Busch and Parlitz1996a
) attributed it to the formation process of the shock wave: the pressure maximum is located behind the leading edge of the pressure transient. Our interpretation of this is that, in the near field along the direction perpendicular to the laser beam, a shock wave from one of the plasmas is followed by the other shock waves originating from the other plasmas that eventually overlap and add to the pressure of the shock at larger distances. This might lead to slower pressure decay compared to the case of a single shock wave.
It is noteworthy that high pressures in the near field combined with nonlinear propagation and a strong anisotropy translate into a linear isotropic pressure impulse in the far field. We discuss mechanisms of this interesting finding in this paragraph. For a cylindrical source Schoeffmann et al. (Reference Schoeffmann, Schmidt-Kloiber and Reichel1988) showed an anisotropic shock-wave emission with most energy in the
 $90^{\circ }$
direction due to a geometrical effect. The anisotropic pressure jump at the initial shock front suggests that the total amount of energy dissipation is higher in the
 $90^{\circ }$
direction than in the
 $0^{\circ }$
direction (cf. Vogel et al.
Reference Vogel, Noack, Nahen, Theisen, Busch, Parlitz, Hammer, Noojin, Rockwell and Birngruber1999b
). Therefore one likely explanation for the transition is that the initial anisotropy is eroded with increasing propagation distance during nonlinear sound propagation in the transition from the near field to the far field, and an isotropic impulse distribution in the far field can evolve. Another possible explanation is that nonlinear propagation in the near field has limited effects on the isotropic impulse distribution in the far field under the present experimental conditions. In order to address the aforementioned discussion, further experimental evidence of ultra-high-speed recordings would be needed.
(a) The distance between plasma and shock front versus the elapsed time. (b) The velocity of the shock wave versus the elapsed time. (c) The pressure of the shock wave versus the distance between the plasma and shock front. The inserted numbers indicate the local slope of the corresponding curve.
4 Conclusion and outlook
In order to investigate a laser-induced shock wave focusing on the pressure impulse, we constructed a measurement system consisting of a combination of ultra-high-speed cameras and pressure sensors. Shock pressure was measured with two hydrophones arranged at
 $\unicode[STIX]{x1D703}=0^{\circ }$
and
 $\unicode[STIX]{x1D703}=90^{\circ }$
with respect to the laser direction, and plasma formation and shock-wave expansion were simultaneously observed using two ultra-high-speed video cameras. The most important finding in this paper is that the distribution of the pressure impulse of a shock wave is spherically symmetric (isotropic) for a wide range of experimental parameters even when the distribution of the peak pressure is not spherically symmetric (anisotropic). We proposed a multiple structure model for the laser-induced shock wave: the laser-induced shock wave is a collection of spherical shock waves emitted from the bright spots inside the area of plasma luminescence. The multiple structure is dependent on the plasma shape generated by illumination with the laser pulse.
To the best of the authors’ knowledge, the isotropy of the pressure impulse in the far field is reported for the first time, which is of great importance for various applications. For instance, the pressure impulse in this study is of the same order as required for practical use for drug delivery of cytoplasmic molecules (Kodama et al. Reference Kodama, Hamblin and Doukas2000). Other examples are low-invasive medical treatments such as drug injection and lithotripsy, for which the input energy of the laser is of the order of 10 mJ (Tagawa et al. Reference Tagawa, Oudalov, Visser, Peters, van der Meer, Sun, Prosperetti and Lohse2012, Reference Tagawa, Oudalov, Ghalbzouri, Sun and Lohse2013) or even more (Menezes et al. Reference Menezes, Kumar and Takayama2009). The laser energy in this study is in the same range: 2.6–12.3 mJ. The isotropic distribution of the pressure impulse may provide high degrees of freedom for the design of needle-free injection devices using high-speed microjets. By changing the plasma shape with control parameters (magnification of the objective lens or the input laser energy), the anisotropy of the shock pressure can be controlled, which might be applicable to a variety of advanced techniques.
Acknowledgements
The authors thank S. Takagi and Y. Matsumoto for the use of the Imacon 200 ultra-high-speed camera. The authors also thank T. Ikeda for helping us to set up the ultra-high-speed camera. This work was supported by JSPS KAKENHI grant number 26709007.


 Open access

