INTRODUCTION
Patterns of species abundance at the biogeographic extremes may provide insights into such essential issues in ecology as identification of borders between adjacent biogeographic regions and causes of species range limits. Analysis of large-scale distribution of species abundance is also a key element of such applications as planning of protected areas and designation of species into regional Red Lists. A widespread paradigm known as ‘abundant centre hypothesis’ (ACH) is widely used to test whether the species abundance is the highest in the range centre and declines towards range edges (Sagarin et al., Reference Sagarin, Gaines and Gaylord2006). Intertidal fauna is an ideal test system for studying latitudinal gradients. In Western Europe, many intertidal and high subtidal marine invertebrates have extended ranges with distinct northern (or north-eastern) and southern (or south-western) limits characterized by diametrically opposed combinations of environmental conditions. However, recent studies on widespread marine coastal invertebrates have shown that most species do not equally demonstrate the ‘abundance-centre’ pattern, and even closely related species could show different spatial patterns (Sagarin & Gaines, Reference Sagarin and Gaines2002; Rivadeneira et al., Reference Rivadeneira, Hernáez, Antonio Baeza, Boltana, Cifuentes, Correa and Thiel2010).
Empirical approaches to quantify abundance in different parts of the range vary widely. One of the main challenges for examining the abundant centre pattern is a logistical difficulty of sampling throughout the whole species range. Particularly, it could be a problem to get adequate samples from the range edge, where local populations are not stable in time and can spontaneously become extinct and later reoccupy suitable habitats (Sagarin & Gaines, Reference Sagarin and Gaines2002; Sexton et al., Reference Sexton, McIntyre, Angert and Rice2009).
Species ranges are not stable in time, often shifting, expanding and contracting (Gaston, Reference Gaston2009). Fluctuations of environmental variables, such as climate oscillations, may alter population fitness at the distribution limits, and range shifts can lag behind environmental changes (Pfenninger et al., Reference Pfenninger, Nowak and Magnin2007; Svenning et al., Reference Svenning, Normand and Kageyama2008). Marginal populations exhibit greater temporal variability in abundance, being near the species’ limit of environmental tolerance, especially in extreme years (Gaston, Reference Gaston2009). Since temporal variation can introduce errors in estimation of spatial abundance distribution, it is highly important to apply monitoring data series to improve the understanding of differences in abundance between central and edge populations (Holt & Keitt, Reference Holt and Keitt2000; Johnstone & Chapin, Reference Johnstone and Chapin2003). The spatial distribution and patchy structure of population density are also likely to determine range limits. Edge populations are usually considered to be smaller and more spatially fragmented than populations in the centre of the range (Brown et al., Reference Brown, Mehlman and Stevens1995). They may exhibit reductions in diversity and in number of immigrants due to spatial arrangement only, thus resulting in an isolation-by-distance effect (Sexton et al., Reference Sexton, McIntyre, Angert and Rice2009).
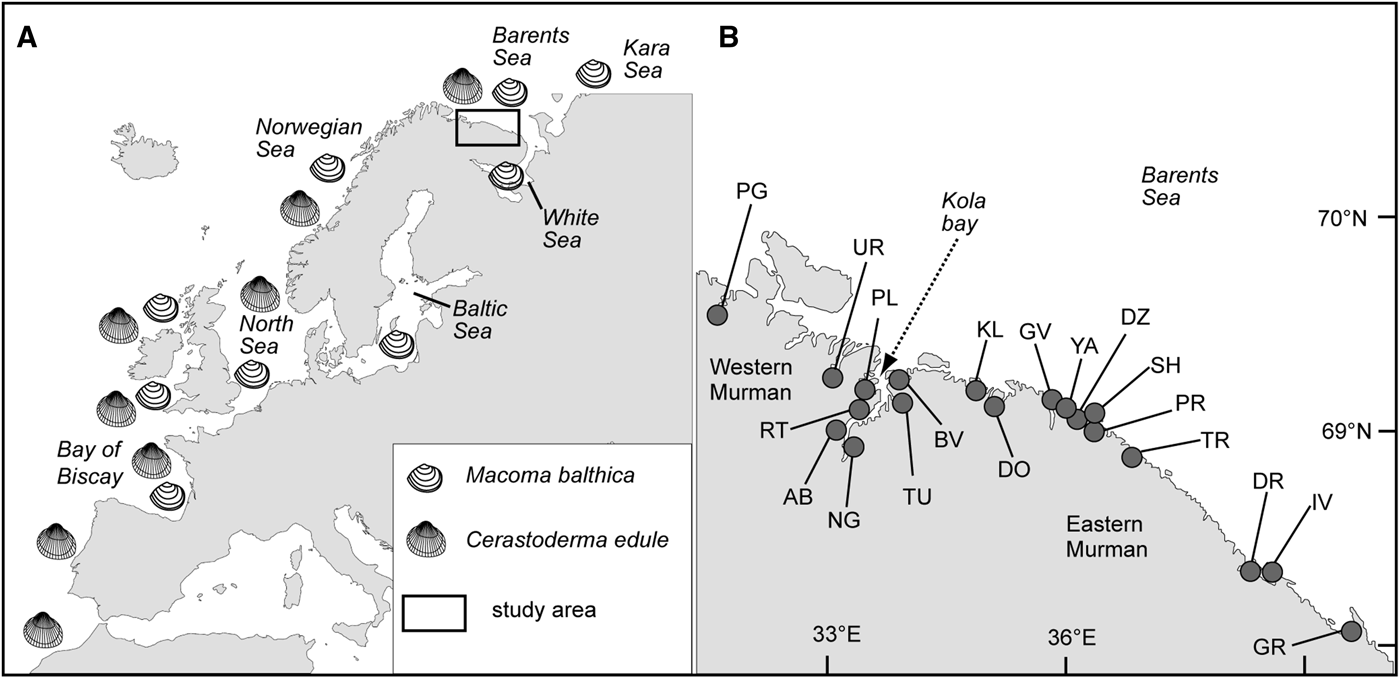
Here, we present the results of the abundance distribution study on Macoma balthica and Cerastoderma edule, two key bivalve species at the tidal flats of the Barents Sea. Macoma balthica is currently regarded as a complex of Pacific Macoma balthica balthica and Atlantic Macoma balthica rubra subspecies (Nikula et al., Reference Nikula, Strelkov and Väinölä2007). In Europe, this complex spreads from the Bay of Biscay up north to the western Kara Sea (Figure 1A). The southern distribution range limit of M. balthica has shifted several hundreds of kilometres to the north during the last decades (Beukema et al., Reference Beukema, Dekker and Jansen2009). Pure M. balthica balthica northern distribution limit belongs to the Varanger Peninsula, while populations in the White and Barents Seas are proved to form a broad ‘hybrid swarm’ – their genetic composition is intermediate between Atlantic and Pacific forms (Strelkov et al., Reference Strelkov, Nikula and Väinölä2007). Cerastoderma edule range is shaped into at least two genetically different groups of populations along the North Atlantic coast, but separation between these groups does not have a subspecies level (Krakau et al., Reference Krakau, Jacobsen, Jensen and Reise2012). Earlier we suggested that low density of individuals is typical for C. edule in the Barents Sea, a north-eastern distribution limit for the species (Genelt-Yanovskiy et al., Reference Genelt-Yanovskiy, Poloskin, Granovitch, Nazarova and Strelkov2010) (Figure 1A). To study latitudinal clines in geographic abundance distributions, we put together published records of mean M. balthica and C. edule density across species’ European ranges with our own observations from the Barents Sea.
Distribution range map of Macoma balthica (European part) and Cerastoderma edule (A) and study area map (B). See Table 1 for sample sites details.

MATERIALS AND METHODS
Study area
Murman Coast is a northern border of the Kola Peninsula with a coastal line of about 700 km, including numerous bays and fjords. The longest among them, Kola Inlet, divide Murman Coast into two regions: Western Murman and Eastern Murman. Murman environmental conditions are determined by the westerly warm Murman Coastal Current (Denisov & Dzhenyuk, Reference Denisov and Dzhenyuk1995). Interaction between the Murman Coastal Current and Arctic water backflow causes a remarkable cooling gradient from Western to Eastern Murman. Owing to gradient changes in environment, this whole area has transitional biogeographic status – from boreal to arctic zone (Zenkevich, Reference Zenkevich and Botsharskaya1963). After E.F. Gourjanova, I.G. Zaks and P.V. Ushakov (Gourjanova & Ushakov, Reference Gourjanova and Ushakov1929; Gourjanova et al., Reference Gourjanova, Zaks and Ushakov1929, Reference Gourjanova, Zaks and Ushakov1930), we consider Western Murman, Kola Inlet and Eastern Murman as three distinct regions of the Murman Coast.
Sampling
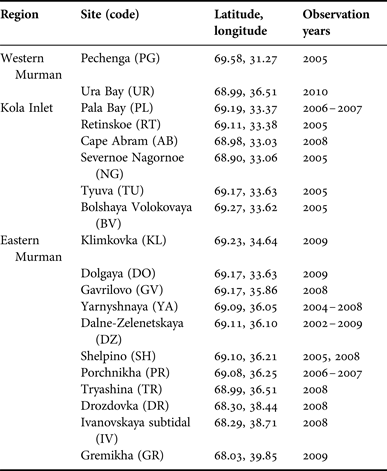
Samples were collected at 18 sites across the Murman Coast (all for C. edule and 12 of them for M. balthica) (Figure 1, Table 1). The sampling took place in July–August, from 2002 to 2010. At each site, tidal zone was divided into three levels according to E.F. Gourjanova, I.G. Zaks and P.V. Ushakov (Gourjanova et al., Reference Gourjanova, Zaks and Ushakov1929), and five samples were taken from every level with soft bottom. All samples from one site were further analysed together disregarding the tidal level. At sites inhabited by M. balthica alone, 5 cm deep cores with a surface area 0.03 m2 were taken; for sites where M. balthica and C. edule occurred together, 0.1 m2 cores were used. All samples were sieved through 1 mm mesh.
Investigation sites and sampling details.
All collected bivalves were sorted, identified and counted. Shell length of each individual was measured using calipers to the nearest 0.5 mm. Age of individuals was determined by counting annual growth marks on the outer side of the shell. This method of age estimation was used based on previous studies on M. balthica and C. edule in the region which confirmed that structural marks on shells of the molluscs in the subarctic seas reflect the annual growth patterns due to the strong seasonal variation in seawater temperature (Agarova, Reference Agarova1979; Maximovich et al., Reference Maximovich, Gerasimova and Kunina1992; Maximovich & Gerasimova, Reference Maximovich, Gerasimova and Railkin2004; Nazarova et al., Reference Nazarova, Genelt-Yanovsky and Maximovich2010).
Statistical analysis
Similar statistical procedures were employed for both species. We started with describing the abundances from each site. We used both medians and means as measures of central tendency and created Tukey boxplots (Tukey, Reference Tukey1976) to illustrate abundance variability. Abundance data from individual samples from one site were used for plotting. Also, year-to-year variability of mean abundance and size-frequency distributions of the species were analysed. Kruskal–Wallis test (Hollander & Wolfe, Reference Hollander and Wolfe1973) was used to compare regional average abundances. The data from published records of mean C. edule and M. balthica abundance are presented together with our own observations in two maps (Figure 5). For comparisons, we used only mean densities of bigger than spat-sized individuals of both species. Full details on all papers used in assessment of global distribution patterns are listed in electronic supplementary (Appendix A).
All calculations were done using R (R Core Team, 2014). In all cases, statistical significances were tested at 5% probability level.
RESULTS
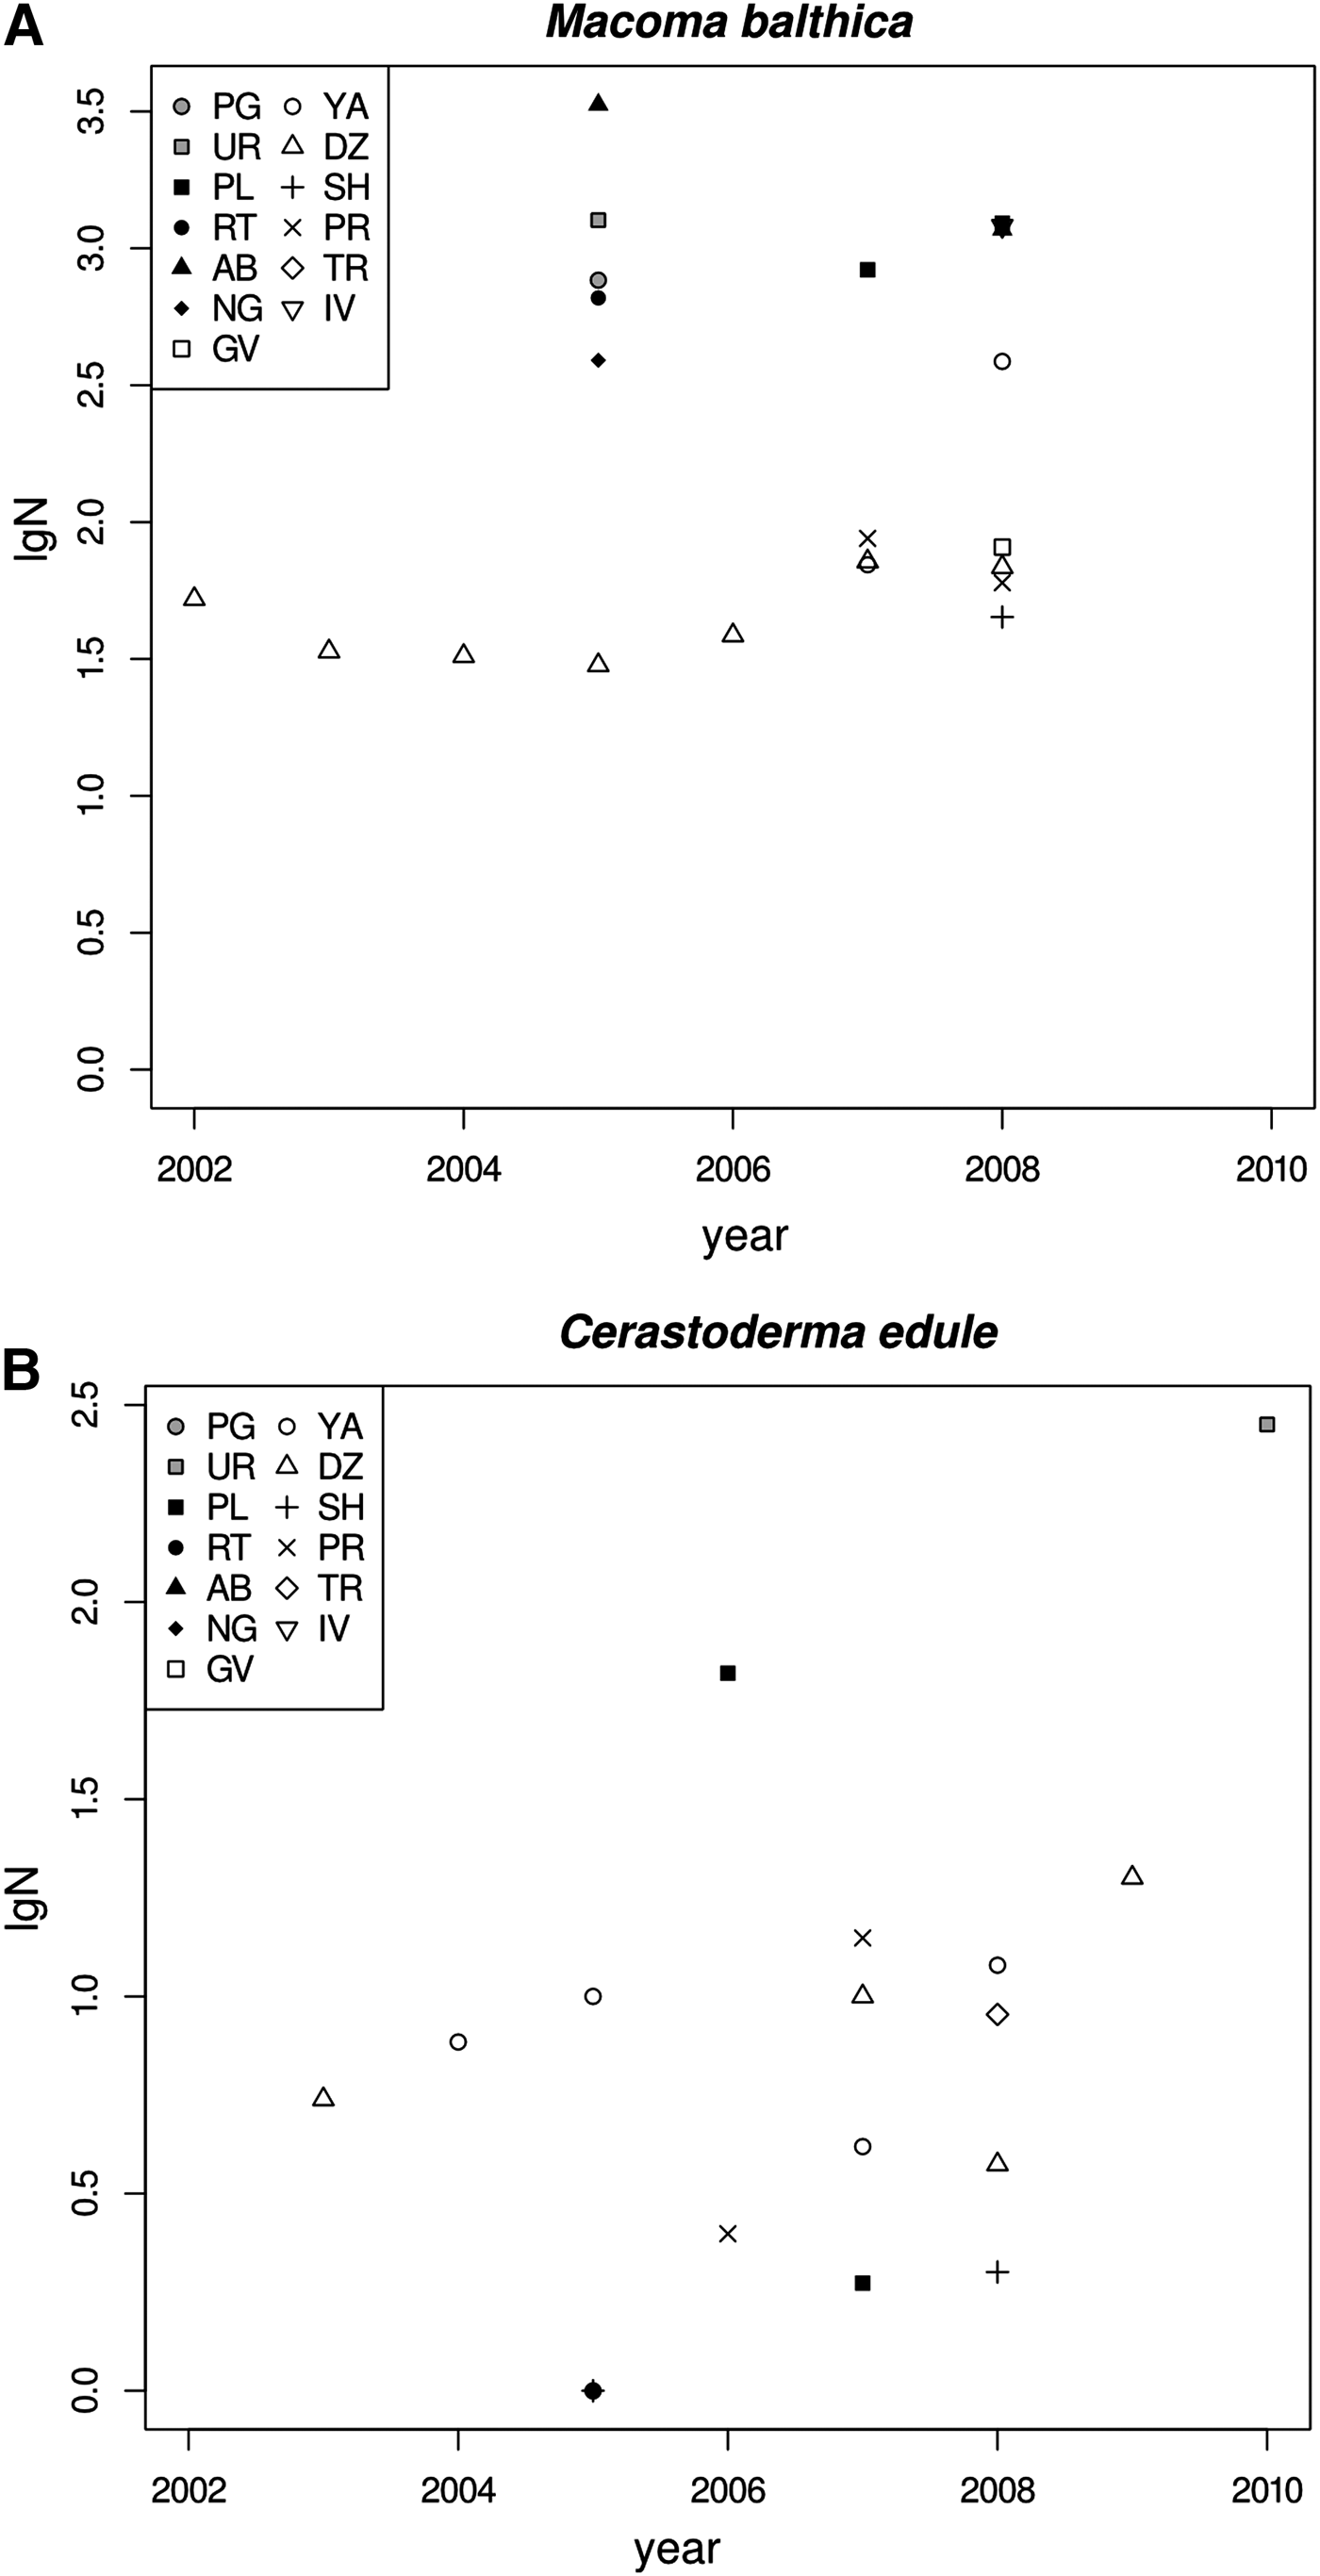
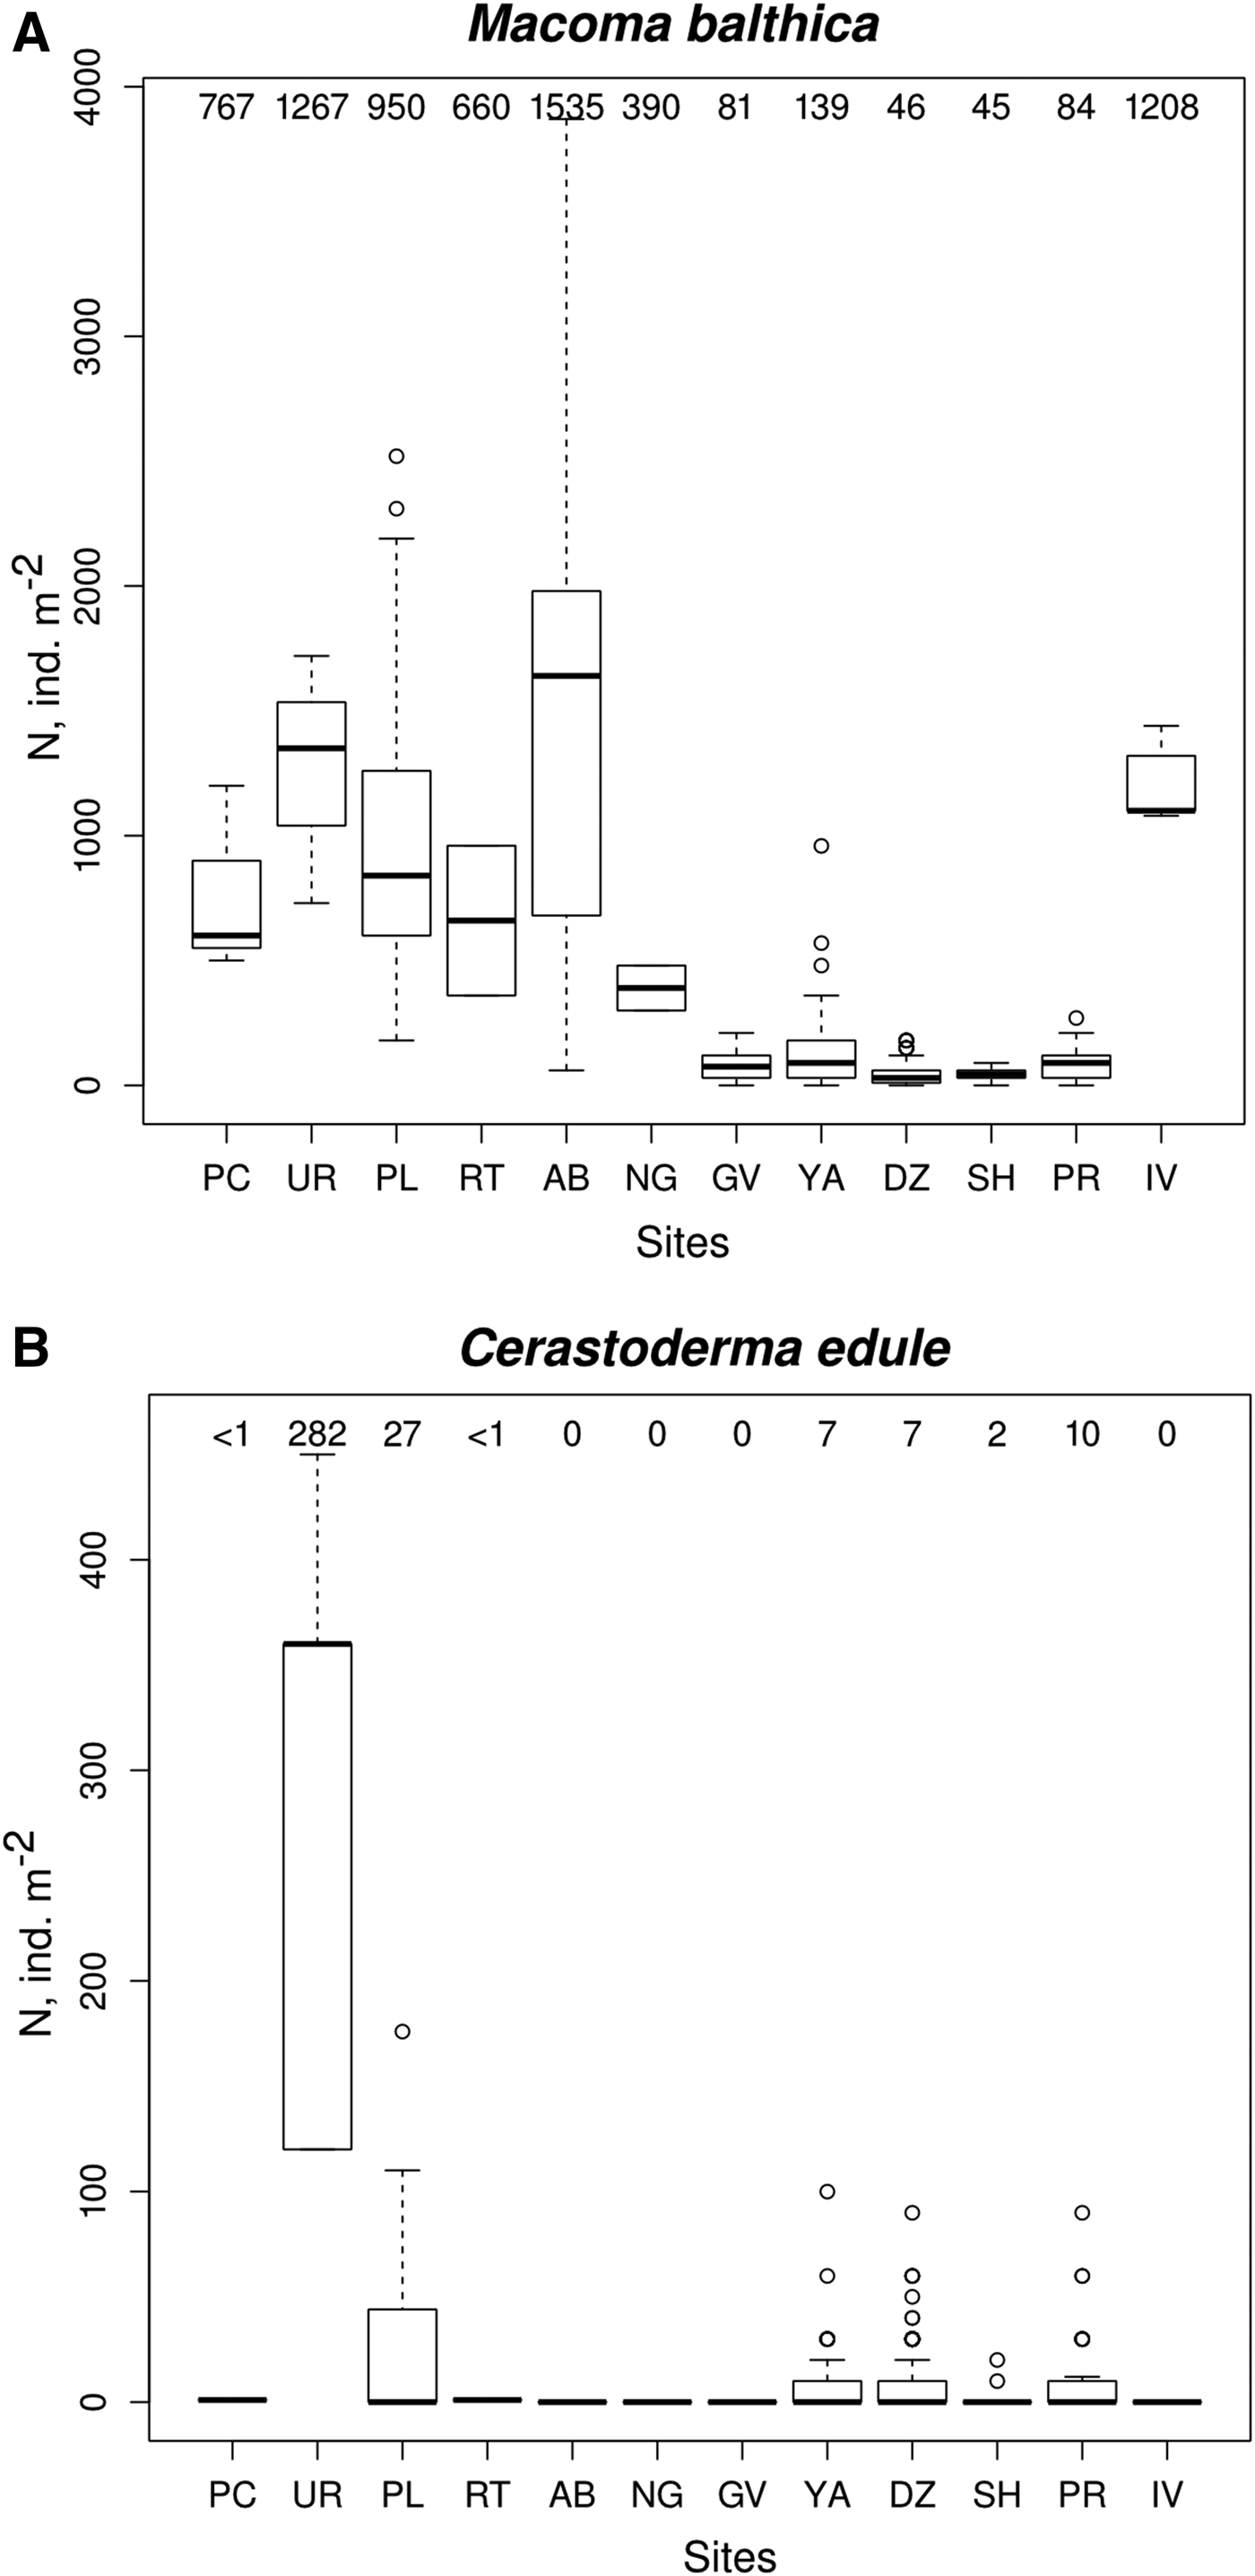
The abundance of Macoma balthica at Western Murman and Kola Inlet sites varied from hundreds to thousands individuals per square metre. Macoma balthica mean density was significantly different in three regions of the Murman coast (Kruskal–Wallis test: χ2 = 17.6, P < 0.0001). Highest mean M. balthica density (3350 ± 520 ind. m−2) was observed in 2005 at Cape Abram (Kola Inlet). Macoma balthica density at other Kola Inlet sites (Pala, Retinskoe and Nagornoe) was much like Western Murman sites (Figures 2A and 3A). The Eastern Murman M. balthica mean density was lower than in Western Murman and Kola Inlet and rarely exceeded 100 ind. m−2 (Figure 3A). However, two major exceptions from this general pattern were found in 2008 (1208 ± 73 ind. m−2 in Ivanovskaya Bay and 387 ± 77 ind. m−2 in Yarnyshnaya Bay respectively). In Dalne-Zelenetskaya Bay (Eastern Murman) mean long-term (from 2002 to 2008) abundance was 47 ± 3 ind. m−2 (Figure 2A).
Year-to-year variability of Macoma balthica (A) and Cerastoderma edule (B) mean abundance (lgN). Symbol colour corresponds to the region: Western Murman – solid grey, Kola Inlet – solid black and Eastern Murman – open symbols.
Mean abundance (N, ind. m−2) of Macoma balthica (A) and Cerastoderma edule (B) in the Barents sea. Samples are arranged from West to East. At the box-plots box marked Q1, median and Q3, whiskers marked 1.5 IQR. Mean abundance indicated at the top.
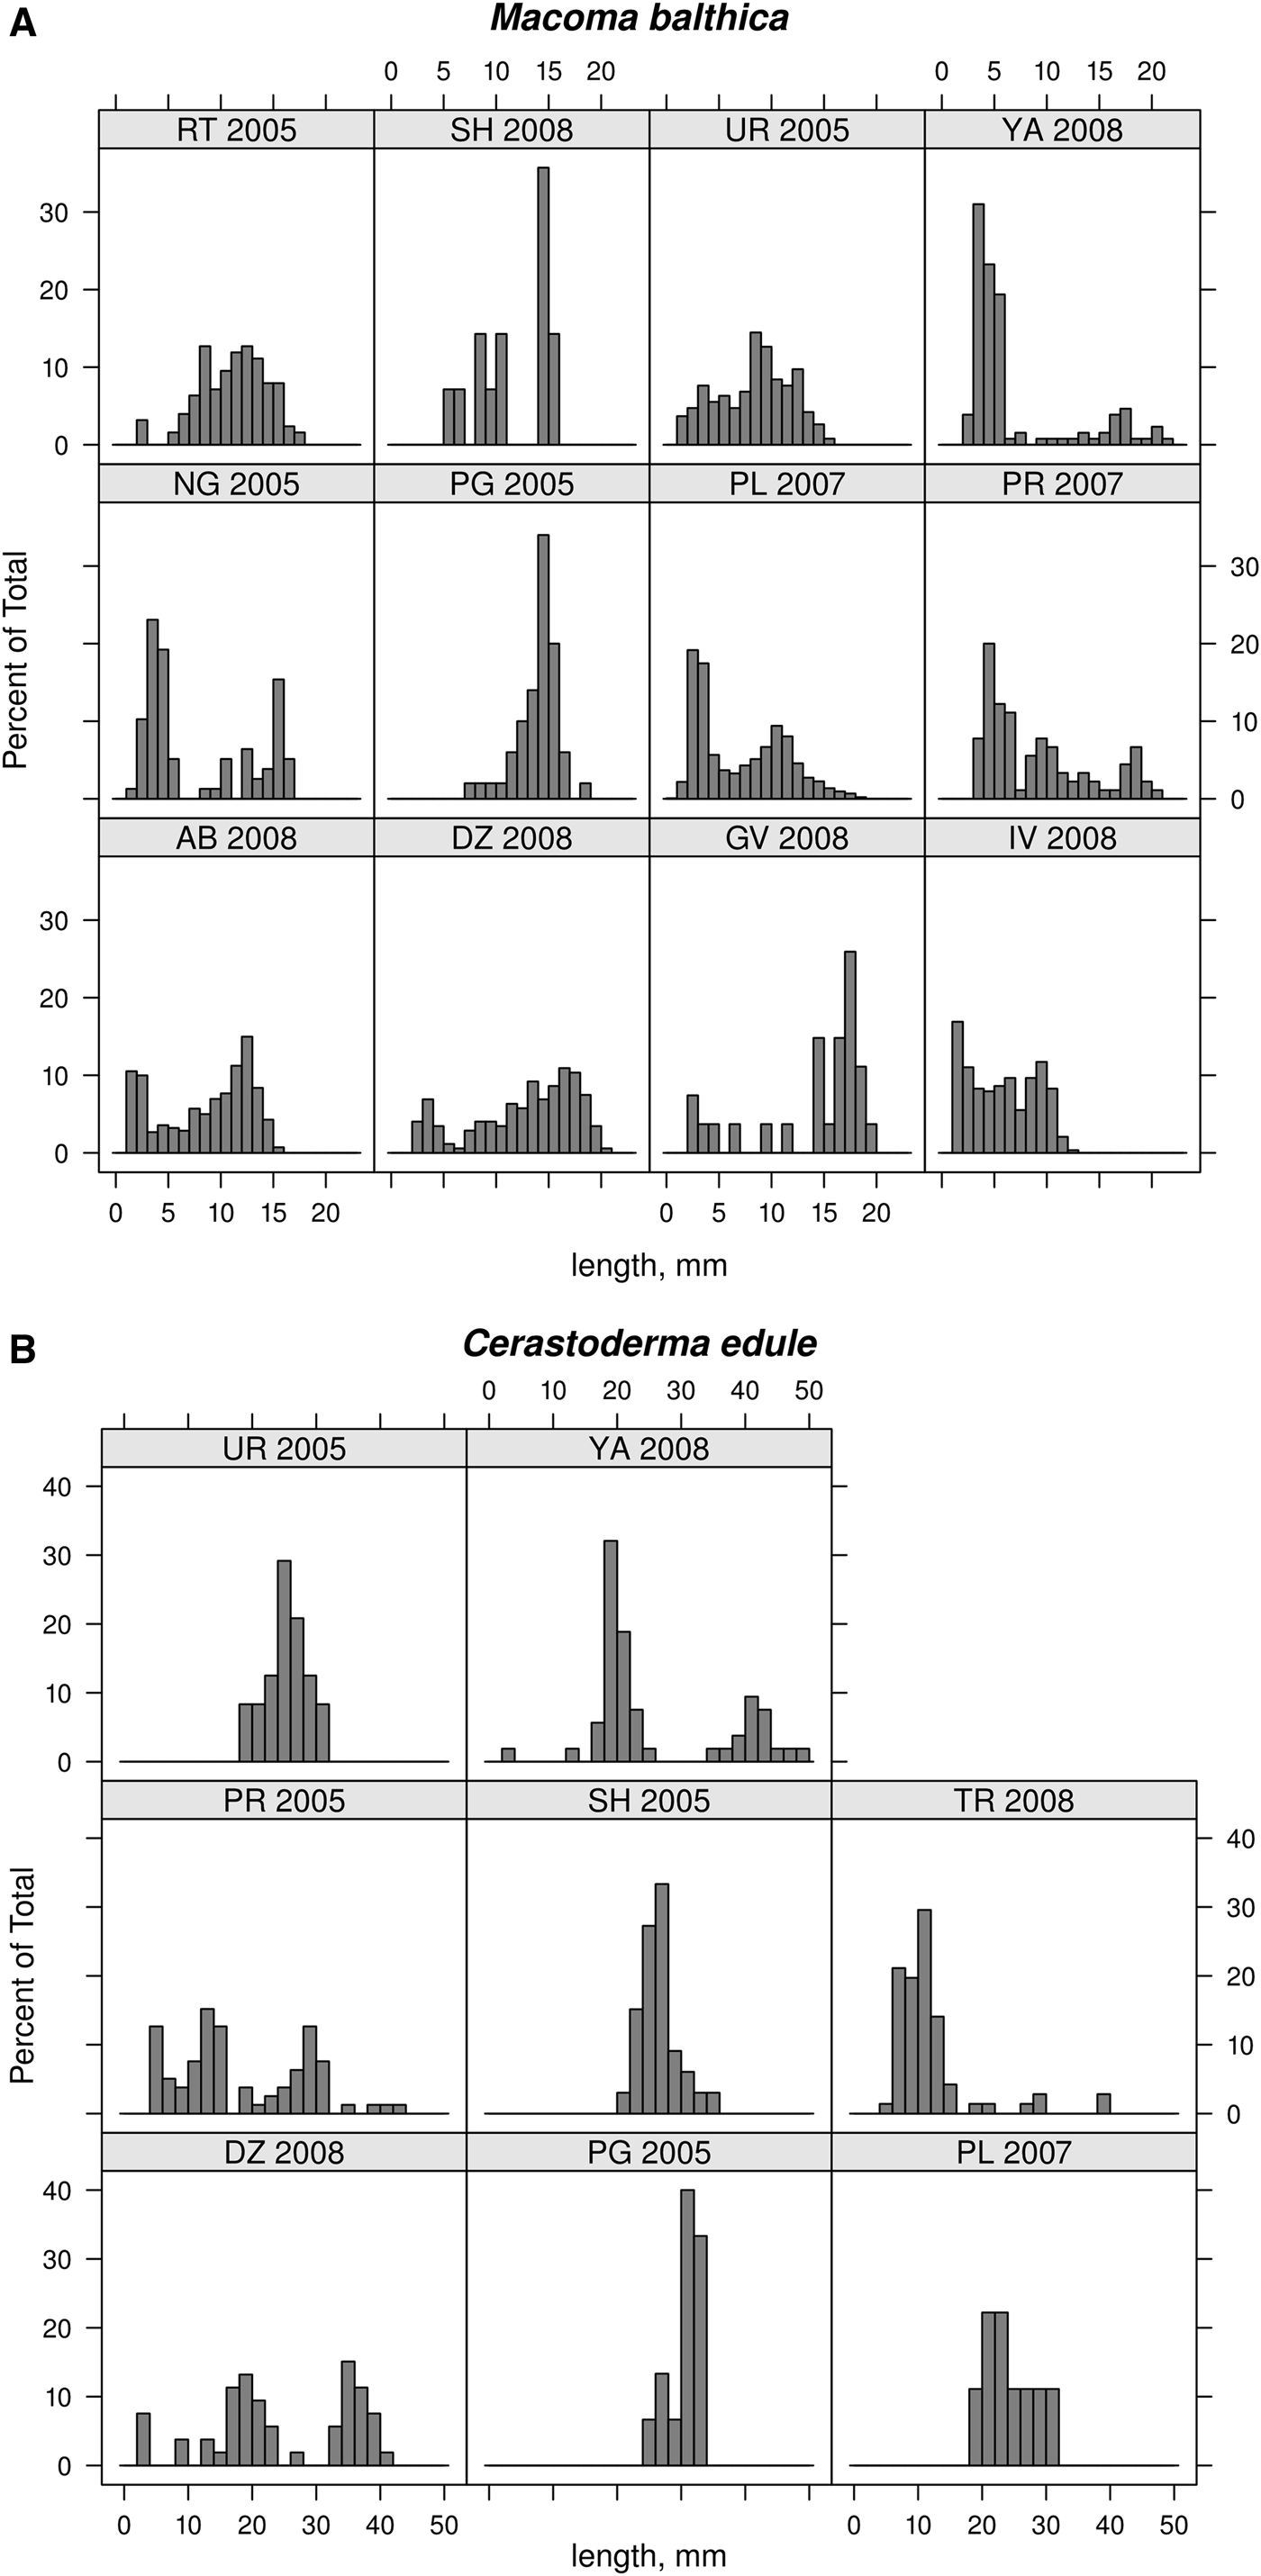
The most common type of M. balthica size structure was bimodal. Either larger or smaller molluscs can prevail though, and the dominant groups may differ at nearby sites even in the same or subsequent years. For example, in 2008 Yarnyshnaya was dominated by 4 mm molluscs, while 17–18 mm-long M. balthica prevailed in nearby Dalne-Zelenetskaya and Gavrilovo (Figure 4A).
Size frequency distributions of Macoma balthica (A) into 1 mm classes and Cerastoderma edule (B) into 2 mm classes.
Alive individuals of C. edule were revealed at 11 sites out of 18. We have not found any alive cockles in Klimkovka, Dolgaya, Tyuva, Gavrilovo, Drozdovka, Ivanovskaya and Gremikha. Density of C. edule in Pechenga, Retinskoe, Bolshaya Volokovaya was so low that there was no possibility to estimate it using our sampling scheme; only solitary individuals were present at the tidal flats during our observations. Only empty shells of C. edule were found in Gavrilovo and Drozdovka, while the Shelpino population became extinct after 2009.
In Ura Bay only solitary cockles were present in 2005, but in 2010 abundance increased up to 282 ± 68 ind. m−2. The other site with rather high abundance was Pala Bay (45 ± 9 ind. m−2 in 2006). In subsequent 2007 cockle abundance at this site dropped, and only solitary cockles were present (Figure 2B). Cockle abundance was notably lower at all other sites (less than 10 ind. m−2 at the majority of sites studied) (Figure 3B). Mean abundance at the Western Murman was significantly higher than at other two regions (Kruskal–Wallis test: χ2 = 21.4, P < 0.001).
Unimodal age structures in C. edule with prevalence of single generation were typical for most sites (22–24 mm-long cockles in Ura Bay, 2005; 26–28 mm in Shelpino, 2005 and 20–24 mm in Pala, 2007) (Figure 4B).
DISCUSSION
Our results generally match with the expectation that the amphi-boreal species Macoma balthica should show higher densities in the Barents Sea in comparison to the more temperate-zone Cerastoderma edule. This cockle is supposed to be the bivalve most sensitive to low air temperatures on European shores – severe winters were shown to cause mass mortality among adult Cerastoderma edule in the Wadden Sea (Strasser et al., Reference Strasser, Reinwald and Reise2001). What effects of severe winters are more critical for cockle survival is still unclear, but probably the sudden rise of the air temperature in subsequent spring may be even more crucial than winter freezing of the upper bottom layer during low tides (Strasser et al., Reference Strasser, Reinwald and Reise2001). The long-term monitoring data from the Wadden Sea provided evidence that long-term variability in average winter temperatures affects bivalve population dynamics in numerous ways (Beukema et al., Reference Beukema, Dekker and Jansen2009; Beukema & Dekker, Reference Beukema and Dekker2014). Community-level analyses revealed that mild winters in the Wadden Sea give advantage to recruitment in decapods Crangon crangon and Carcinus maenas, which in turn essentially feed on postlarvae of bivalves Macoma balthica, Cerastoderma edule, Mya arenaria and Mytilus edulis (Beukema & Dekker, Reference Beukema and Dekker2014). The Barents Sea lacks Carcinus maenas, the distribution edge of the crab is in northern Norway. Crangon crangon also cannot be regarded as an important predator in the Barents Sea intertidal because it does not seem to form permanent populations at the Murman Coast (Kuznetsov, Reference Kuznetsov1960).
Regional variability in mean abundance found in both M. balthica and C. edule could be explained by a difference in general environmental conditions between Western and Eastern Murman. Western Murman is an area of numerous fjord-like bays, among which Kola Inlet is the longest (57 km) and Pechenga and Ura Bay are more typical – 16 and 19 km long respectively, while Eastern Murman coast is relatively straight. Also, westerly Murman Coastal Current dominates the nearshore hydrodynamics in Eastern Murman, while longer bays of Western Murman are more isolated and thus provide more stable conditions (Denisov & Dzhenyuk, Reference Denisov and Dzhenyuk1995).
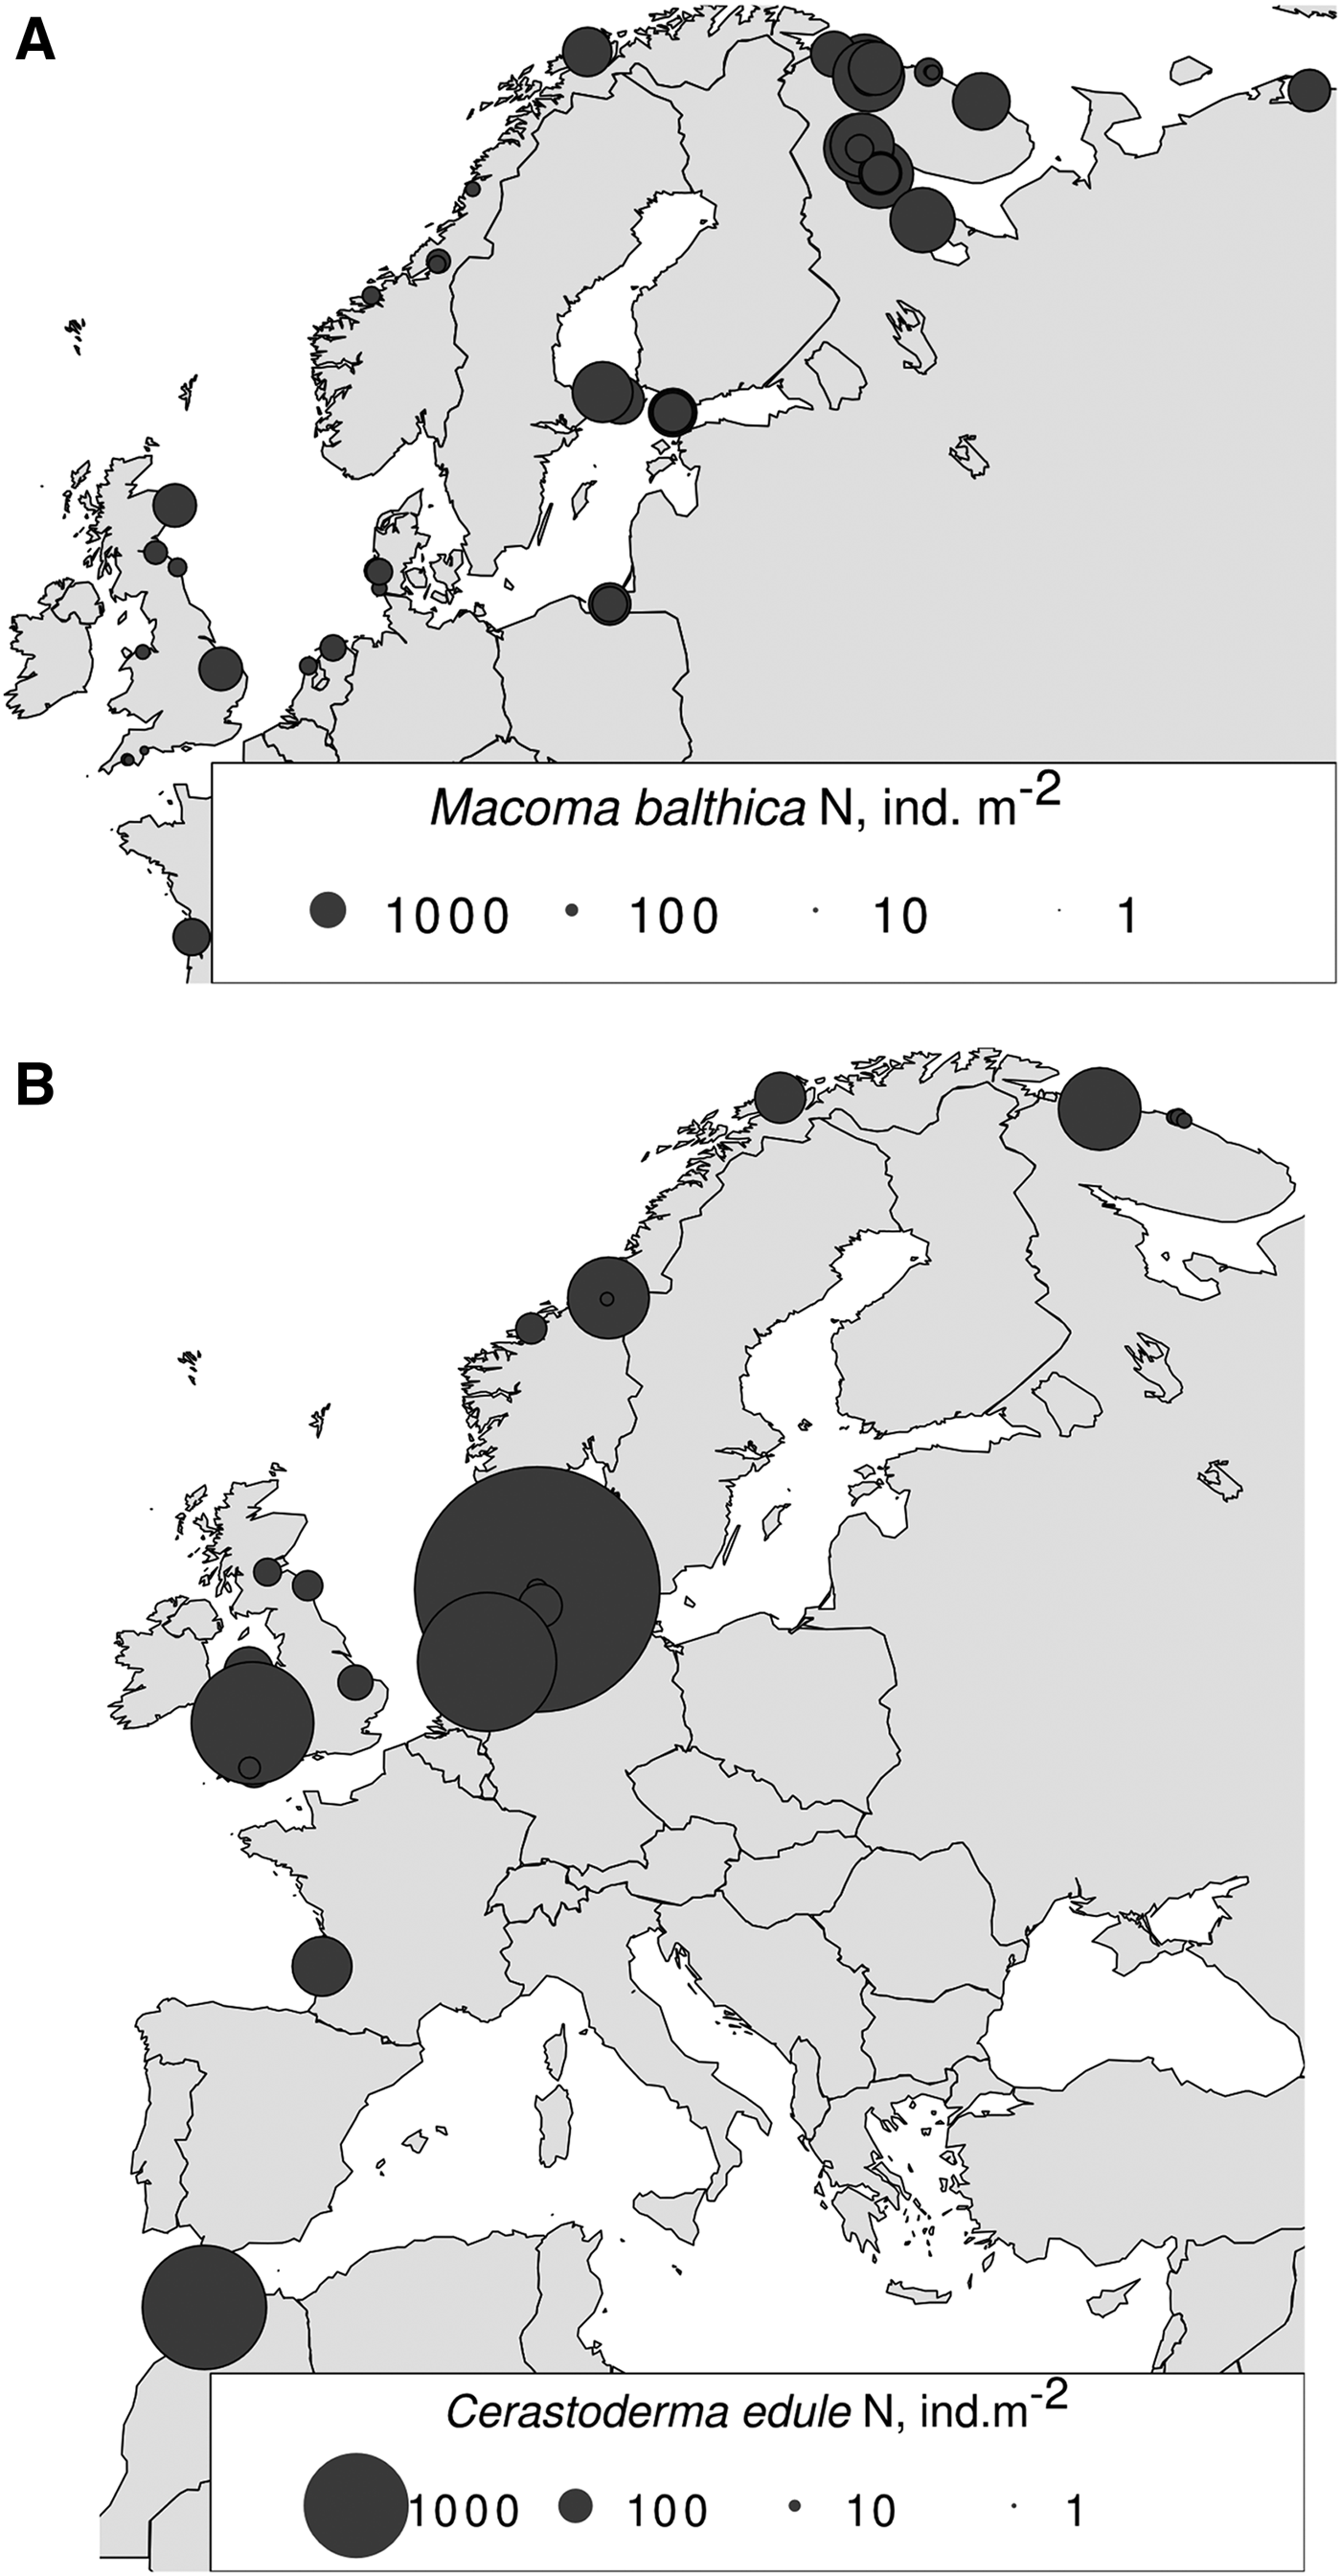
According to our data, mean Macoma abundance was significantly lower in Eastern Murman sites in comparison to Western Murman and Kola Inlet sites. In 1973 mean density of M. balthica at Dalne-Zelenetskaya Bay (23 ± 9 ind. m−2) was much alike the present-day values (Agarova et al., Reference Agarova, Voronova, Galtsova, Ioffe, Letova, Streltsov, Streltsova, Streltsov and Gurevich1976). At Western Murman and in Kola Inlet clam densities were comparable with their densities in the White Sea, in the Baltic Sea and in the nearest waters – the northern part of the Norwegian Sea (e.g. Semenova, Reference Semenova1974; Aschan, Reference Aschan1988; Boström & Bonsdorf, Reference Boström and Bonsdorff2000; Oug, Reference Oug2001; Gerasimova & Maximovich, Reference Gerasimova and Maximovich2013; Rousi et al., Reference Rousi, Laine, Peltonen, Kangas, Andersin, Rissanen and Bonsdorff2013; Varfolomeeva & Naumov, Reference Varfolomeeva and Naumov2013). Values of mean M. balthica abundances similar to the Eastern Murman were typical to the southern part of the Norwegian Sea and the Wadden Sea (Sneli, Reference Sneli1968; Beukema, Reference Beukema1976; Jensen & Jensen, Reference Jensen and Jensen1985; Reise et al., Reference Reise, Herre and Sturm1994) (Figure 5A).
Geographic abundance distributions of Macoma balthica (A) and Cerastoderma edule (B). Area of circles is proportional to the mean abundance. For sources of data see Appendix A.
Populations of Macoma balthica in the South-Western Barents Sea (Murman coast) are certainly not marginal within the species’ European part of the range (Figures 1A and 5A) – M. balthica also occurs in the Kara Sea on the North-East and is quite typical for the White Sea intertidal communities, where it reaches high densities (Semenova, Reference Semenova1974; Denisenko et al., Reference Denisenko, Denisenko, Lehtonen, Andersin and Laine2003; Strelkov et al., Reference Strelkov, Nikula and Väinölä2007; Gerasimova & Maximovich, Reference Gerasimova and Maximovich2013).
Densities of M. balthica in Ivanovskaya, the easternmost site for this species in our dataset, were dissimilar to other Eastern Murman localities, because at this site M. balthica appears to be rather subtidal than intertidal species – it occurs just below the low water level. Subtidal Macoma balthica population was previously reported in the Pechora Sea (south-eastern part of the Barents Sea) with mean densities of 654 ind. m−2, which is two times lower than in Ivanovskaya (Denisenko et al., Reference Denisenko, Denisenko, Lehtonen, Andersin and Laine2003).
Our data indicate that Macoma balthica abundance distribution within the species range does not follow the abundant centre pattern (Figure 5A) and is more like a ramped north (for names of distribution shapes see Sagarin & Gaines, Reference Sagarin and Gaines2002). Surprisingly, mean individual densities of bigger than spat-sized M. balthica at Western Murman sites were more similar to those in the White and Baltic Seas, and were higher than long-term mean values available for the North Sea and Bay of Biscay (see Appendix A).
Mean densities of adult Cerastoderma edule on the Murman Coast of the Barents Sea being at most sites around 10 ind. m−2 were generally lower than in other parts of the species range, presumably in the North Sea and Irish Sea (Beukema, Reference Beukema1989; Ivell, Reference Ivell1981; André & Rosenberg, Reference André and Rosenberg1991; Bachelet et al., Reference Bachelet, Guillou, Labourg and Colombo1992; Ramón, Reference Ramón2003; Dare et al., Reference Dare, Bell, Walker and Bannister2004) (Figure 5B). Long-term mean density of cockles in the Dalne-Zelenetskaya Bay was equal to previously reported values (Agarova et al., Reference Agarova, Voronova, Galtsova, Ioffe, Letova, Streltsov, Streltsova, Streltsov and Gurevich1976). Very similar densities to the Barents Sea cockle were previously reported from Tromsø, Northern Norway (Oug, Reference Oug2001). These data support the hypothesis that low abundance is a typical feature of the northern part of the cockle range. Taking into account that at the southernmost distribution limit, Merja Zerga (Morocco), cockle density may reach 1200 ind. m−2 with long-term mean of 638 ind. m−2 (Gam et al., Reference Gam, de Montaudouin and Bazairi2010), abundance pattern could be probably characterized as an ‘abundance centre’, but with a higher abundance at the southern range edge, as compared with the Barents Sea (Figure 5B). Current easternmost C. edule local population is situated in Tryashina (~68°59′N, ~36°30′E), we did not find any alive cockles further to the east. However, in Drozdovka (~100 km east from Tryashina) we have found two non-fossilized cockle shells, which means that temporary settlement of this species occurred there several years previously to our visit. At five other sites (Pechenga, Retinskoe, Tyuva, Bolshaya Volokovaya, Gavrilovo) it was impossible to estimate cockle density using standard sampling methods and only shells were found, which clearly reflects the fact that Murman coast is a dynamic range edge for C. edule. No cockles were also found in the inner part of the Kola Inlet, Cape Abram and Nagornoe (Figure 3B). A possible explanation to the observation may be the known sensitivity of C. edule to pollution load (Savari et al., Reference Savari, Sylvestre, Sheader, Le Gal and Lockwood1989), which should be significant near the city and the port of Murmansk, the largest coastal industrial area in the Barents Sea region.
Cerastoderma edule population dynamics has a very typical feature of periodically occurring mass mortality events, when adult densities sharply decline from thousands of individuals to single cockles per square metre due to a variety of factors. Slow population recovery takes place after that (Strasser et al., Reference Strasser, Reinwald and Reise2001; Malham et al., Reference Malham, Hutchinson and Longshaw2012; Callaway et al., Reference Callaway, Burdon, Deasey, Mazik and Elliott2013). Cockle density in Wadden Sea could reach 54,000 ind. m−2 including individuals of all age groups during periods termed, after Ducrotoy et al. (Reference Ducrotoy, Rybarczyk, Souprayen, Bachelet, Beukema, Desprez, Ibanez, Elliott and Ducrotoy1991), as ‘recovery’ (Malham et al., Reference Malham, Hutchinson and Longshaw2012). According to our study, the cockle population in Ura Bay on Western Murman unambiguously had features of a recovery phase in 2010 after a ‘crisis’ phase observed in 2005 (Figure 2B). During our first visit, only solitary individuals were found across the tidal flat, while in 2010 mean cockle density was 282 ind. m−2, which is the highest density value for the Barents Sea. Our results on cockle local population recovery in Ura Bay support the dependence (at least partial) of Barents Sea populations of invertebrates and pelagic fish on larval drift from the west (Gjøsæter, Reference Gjøsæter1995; Mikkelsen & Pedersen, Reference Mikkelsen and Pedersen2004).
ACKNOWLEDGEMENTS
We are grateful to all participants of Saint-Petersburg State University Barents Sea expeditions of 2002–2009 years for their help in the fieldwork and to the administration of Kandalaksha State Natural Reserve for supporting our activity. We also greatly appreciate valuable comments of the anonymous Reviewer #3.
FINANCIAL SUPPORT
The study was partially supported by RFBR grants Nos 12-04-01507-a, 12-04-10128-k, 13-04-10131-k, and SPbSU Action 2 research project No. 1.38.253.2014.
Supplementary material
To view supplementary material for this article, please visit http://dx.doi.org/10.1017/S0025315415000624.