Introduction
Niobium (Nb) has a wide variety of uses ranging from niobium carbide- and nitride-steel alloys though diverse piezoelectric compounds to superconducting Nb–Sn magnets. Niobium is regarded as a ‘critical or strategic metal’ in that although it has numerous industrial uses there are few exploitable sources. Currently, there are only three major operating Nb mines (Araxa and Catalão-II in Brazil and St. Honoré, Canada). The Brazilian deposits account for ~92% of total worldwide production with St. Honoré and other sources (e.g. Lovozero, Russia; Pitinga, Brazil) for 7 and 1%, respectively. Accordingly, there is great interest in developing new sources of Nb and to that end many occurrences in carbonatites are being evaluated [e.g. Aley, Upper Fir and Eldor (Canada); Elk Creek (Nebraska, USA); Tomtor (Russia)] or re-evaluated [e.g. Oka, James Bay (Canada); Fen (Norway); Panda Hill, Ngualla (Tanzania)]. Brazil has significant Nb reserves at Seis Lagos, Tapira and Salitre, together with the decommissioned mine at Catalão-I (Mitchell, Reference Mitchell2015).
One objective of this contribution is to draw attention to a significant potential source of Nb in the Good Hope Carbonatite located in northwestern Ontario (Canada) and to the unusual character of the mineralisation. In common with other Nb deposits pyrochlore is the main ore mineral, however at Good Hope it occurs principally as pyrochlore-apatitite clasts rather than as a disseminated phase in carbonatite. Description of these clasts and presentation of a hypothesis for their genesis is the principal objective of this contribution.
Geological setting
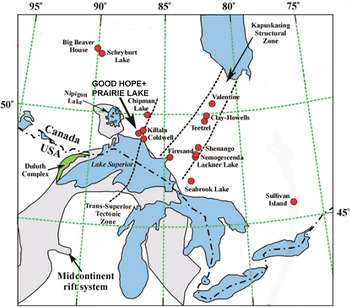
The Good Hope carbonatite is a satellite intrusion of the well-known Prairie Lake alkaline rock and carbonatite complex (Sage, Reference Sage1987; Zurevinski and Mitchell, Reference Zurevinski and Mitchell2015; Wu et al., Reference Wu, Mitchell, Li, Zhang and Yang2017), located adjacent to the Dead Horse Creek Road, northwest of the town of Marathon, ~26 km north of the shore of Lake Superior at 49°02'N, 86°43'W (Fig. 1). The carbonatites are emplaced in continental shield Archean gneisses of the Wawa Subprovince. The Prairie Lake complex has an emplacement age of ~1160 Ma (Rukhlov and Bell, Reference Rukhlov and Bell2010; Wu et al., Reference Wu, Mitchell, Li, Zhang and Yang2017). The age of the Good Hope carbonatite has yet to be determined but given the geological disposition is unlikely to differ from that of Prairie Lake.
Location of the Prairie Lake and Good Hope carbonatites together with those of other carbonatite and alkaline rock complexes in northwestern Ontario.

The Prairie Lake complex (Fig. 2) consists in order of intrusion of: (1) biotite pyroxenites and coarse grained calcite carbonatites; (2) ijolite series rocks (urtite, ijolite, melteigite and hollaite); (3) malignites (sensu Mitchell and Platt, Reference Mitchell and Platt1979); heterogeneous banded texturally diverse olivine phlogopite calcite carbonatites with numerous clasts and megaxenoliths of ijolite suite rocks, pyroxenites, phoscorite, pyroxene apatitite and wollastonite apatitite. Minor dolomite occurs only at the northern margins of the complex (Fig. 2). The complex has a well-defined magnetic signature (Sage, Reference Sage1987) due to the presence of magnetite and has not been metamorphosed.
General geology of the Prairie Lake Complex. The location of the Good Hope satellite carbonatite complex is located at the northwest margin of the complex and shown here, as there is no outcrop, as a magenta box representing the existing mineral deposit claims (GHC).

The Good Hope carbonatite is situated at the northwest margin of the Prairie Lake complex and adjacent to the heterogeneous banded carbonatites (Fig. 2). In contrast to the main complex there is no magnetic signature as magnetite is not present in these carbonatites. However, exploration work has established that there is a weak radiometric anomaly over parts of the carbonatite body. The absence of any magnetite anomaly and the paucity of outcrop is the reason that this carbonatite was not recognised previously. The geology of the Good Hope carbonatite has not yet been completely defined. Recent exploration by Plato Gold Corp. (www.platogold.com) has shown that occurrence encompasses an area of ~500 m × ~500 m, and has been proven by diamond drilling to extend to a minimum depth of 500 m.
The Good Hope carbonatite is a heterolithic breccia consisting of angular clasts of magnesio-arfvedsonite + potassium feldspar, potassium feldspar + phlogopite together with pyrochlore apatitite set in matrices consisting of dominant but diverse dolomite and ferrodolomite carbonatites, together with calcite carbonatites and lesser hydrothermal rare-earth-fluorocarbonate–fluorite–quartz–ferrodolomite carbonatite. The potassium-feldspar-bearing clasts are considered on textural and mineralogical grounds to be fragments of consanguineous intrusions, are not fenites, and will be described in a separate publication. The intrusion as a whole represents a complex of multiple generations of dolomite carbonatite intruded by younger calcite carbonatites. The Good Hope carbonatites have neither the texture nor the mineralogy of any of the Prairie Lake carbonatites. Notably absent are xenoliths or intrusions of ijolite-series rocks and malignites.
Mineralisation in the Good Hope carbonatite is represented principally by clasts of pyrochlore-bearing apatitite set in dolomite and ferrodolomite carbonatite matrices. Such carbonatites are consequently enriched in Nb. However, the distribution of the clasts is apparently random and diamond drilling to date has not established any continuous horizons of Nb-enriched carbonatite, nor encountered the undisrupted source of the apatitite clasts. In addition, disaggregation of apatitite clasts has led to the dissemination of pyrochlore in later intrusions of carbonatite which has also crystallised texturally- and compositionally-different primary pyrochlores. Hence, as a consequence of this heterogeneity, assessment of the Nb potential of this deposit is difficult without further definition drilling and large-scale bulk sampling. To-date diverse grab, channel and core samples have established Nb contents ranging from 0.1–1.63 wt.% Nb2O5, with 1 metre channel samples in an excavated pit ranging from 0.41–1.21 wt.% Nb2O5. Although an average grade has yet to be defined, it is apparent the Nb potential of this carbonatite is similar to, or exceeds, those of other primary niobium deposits in carbonatites which have been, or are being, exploited: Fen (0.5 wt.%); St Honoré (0.41 wt.%); Oka (0.45–0.66 wt.%); Panda Hill 0.43–0.87 wt.%; Elk Creek 0.67 wt.%) (see Mitchell, Reference Mitchell2015).
Experimental methods
The compositions of apatite and pyrochlore were determined at Lakehead University by quantitative X-ray energy dispersive spectrometry (EDS) using a Hitachi SU–70 scanning electron microscope. X-ray spectra collected for 120 s with an accelerating voltage of 25 kV and beam current of 300 pA were processed using AZtec software (Oxford Instruments). Analytical standards were: apatite (P, Ca); SrTiO3 (Sr, Ti); ThNb4O12 (Th, Nb); Mn-hortonolite (Mn, Fe, Mg and Si); jadeite (Na, Al), individual rare-earth orthophosphate glasses; Ta and U metals. The determination of the F content of apatite with a CaF2 standard (collection time 250 s) is considered accurate (±2 wt.%) as there are no peak overlaps by OKα or FeKα lines with the FKα line.
Trace-element data for apatite were determined on polished sections by laser ablation inductively coupled plasma mass spectrometry at the University of Manitoba using a 213 nm Nd-YAG New Wave laser connected to a Thermo Finnigan Element 2 sector-field mass spectrometer. Data were collected using spot analysis (55 μm) at a repetition rate of 5 Hz, ablation time of 50 s and energy density of 5.5 J/cm2. The ablation was performed in argon and the rate of oxide production as measured by the ThO/Th ratio was set to 0.15%. The synthetic glass standard NIST SRM 610 was employed for instrument calibration and USGS BCR2G for quality control. The following isotopes were chosen for analysis: 29Si; 32S; 43Ca; 55Mn; 88Sr; 89Y; 137Ba; 139La; 140Ce; 141Pr; 143Nd; 147Sm; 151Eu; 157Gd; 159Tb; 163Dy; 165Ho; 167Er; 169Tm; 172Yb; 175Lu and 232Th. A Ca content of 55 wt.% CaO was used as an internal standard for all analyses as apatite in these clasts has near-stoichiometric fluorapatite composition (see below). Data reduction was undertaken online using Iolite version 3 software (Hellstrom et al., Reference Hellstrom, Paton, Woodhead, Hergt and Sylvester2008).
Pyrochlore apatitite
Macroscopically, the apatitite clasts are typically irregular in shape and range in size from millimetres to centimetres (typically <2 cm; but up to 5 cm). A representative sample of mineralised carbonatite consisting of angular white apatitite clasts set in a brown ferrodolomite host is illustrated in Fig. 3a. The clasts are fine grained and their internal texture is not evident in hand samples. The apatitite clasts fluoresce strongly in ultraviolet light (Fig. 3b); a feature which permits the easy recognition of potentially Nb-rich apatitite clasts in diamond drill core samples.
Representative sample of Good Hope carbonatite illustrating; (a) white pyrochlore-apatitite clasts set in a brown ferrodolomite matrix; (b) clasts showing strong ultraviolet luminescence with blue cores and blue–green rims.

Apatitites – texture and mineralogy
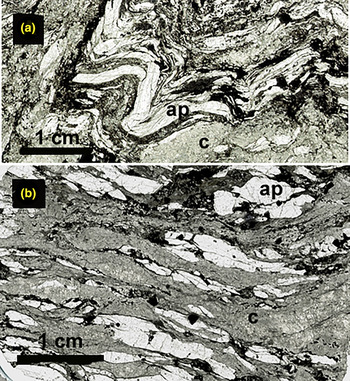
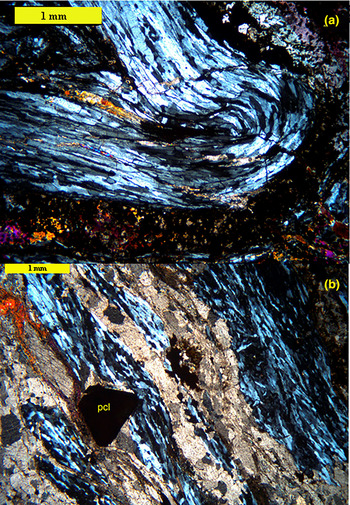
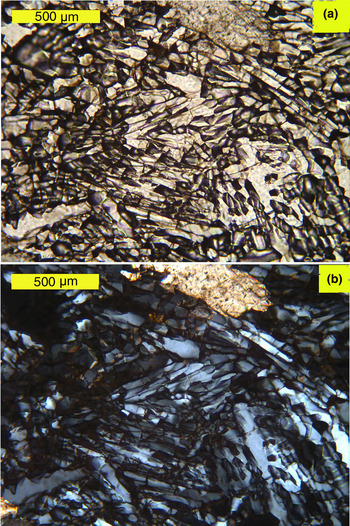
The apatitite clasts exhibit diverse textures ranging from apparently folded clasts (Fig. 4a; Fig. 5a) through elongated and boudinaged types (Fig. 4b) to schlieren-like (Fig. 5b) sub-parallel varieties. The clasts consist of apatite prisms (Fig. 6a) which range in size from ~100–500 μm × 10–25 μm. In some instances grain boundaries are highlighted by thin films of brown Fe-oxides/hydroxides or extremely fine-grained amorphous mixtures of unidentifiable minerals containing C, Mg, Si, S, Cl, Ca, Fe and Cu. Although individual prisms typically exhibit undulose extinction there is no common optical orientation within a given clast (Fig. 6b). In some of the smaller clasts, and at the terminations of boudinaged clasts, the apatites are rarely coarsened into anhedral grains with uniform extinction. Allotriomorphic granular textures typical of sub-solidus coarsened cumulates are not present.
Visible light scans of thin sections of Good Hope carbonatite illustrating: (a) folded bands of apatite prisms; (b) boudinaged apatitite clasts. Note that these carbonatites have not been subjected to metamorphism or regional tectonic deformation. (ap = apatitite; c = carbonate)

Crossed polarised light images of: (a) band of ‘folded’ apatite prisms illustrating the subparallel orientation of the prism axes and the anisotropic heterogeneity: (b) crossed polarised light image of deformed and elongated apatitite schlieren occurring as sub-parallel bands in a carbonate matrix with a large opaque pyrochlore (pcl) crystal.

Typical texture of apatite in the apatitite clasts in: (a) plane polarised light; and (b) crossed polarised light.

The apatite prisms have no internal mineral or fluid inclusions. The pyrochlores present in the clasts have apparently crystallised prior to the prismatic apatite as they lack prismatic apatite inclusions (see below). Deflection of apatite prisms around pyrochlores is present but not common and the orientation of prisms are typically not disturbed by the presence of pyrochlore.
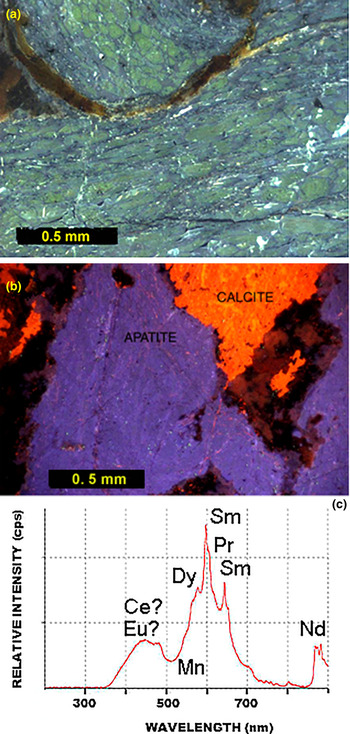
The apatite in addition to the strong blue–green ultraviolet fluorescence exhibits cathodoluminescence (CL). Figure 7a illustrates a hot cathode CL image of apatite in a portion of a folded clast and shows the presence of green luminescent cores mantled by thin blue–green rims. Figure 7b illustrates a cold cathode CL image of apatite which exhibits the common blue CL of primary apatite occurring in carbonatites (Mitchell, Reference Mitchell and Coulson2014). The marginal CL evident in the ultraviolet fluorescence and hot cathode CL is present but not well defined. The CL spectrum (Fig. 7c) is dominated by complex Sm, Pr and Dy emission (550–650 nm) together with a broad blue–green band (400–500 nm) attributed to Eu or Ce, and a weak Nd emission in the infra-red (850–900 nm). Mitchell (Reference Mitchell and Coulson2014) has noted that the CL spectra of apatite from carbonatites consist of two groups: (1) those with a broad 400–500 nm band in the blue region of the spectrum (Verity, Howard Creek, Big Beaver House); and (2) those lacking this band (Fen, Oka, Cargill). The reasons for this dichotomy have not yet been established. Good Hope apatite belongs to group 1, whereas apatite derived from Prairie Lake heterogeneous carbonatites belongs to group 2 (Mitchell, Reference Mitchell and Coulson2014).
(a) Hot cathode luminescence image of folded apatite prisms illustrating green cores and thin blue green margins; (b) cold cathode luminescence image of apatite in apatitite clasts showing the typical blue CL of carbonatite apatite; (c) CL spectrum of apatite (see text for discussion).

Carbonatites containing folded apatitites of the type found at Good Hope have not been described previously. The folding, boudinage and schlieren textures are not due to external tectonic deformation by events subsequent to crystallisation of the carbonatites, as neither Good Hope nor Prairie Lake have been metamorphosed and are emplaced in a stable craton. The folds shown in Fig. 4a are not analogous to folded apatite described by Chakhmouradian et al. (Reference Chakhmouradian, Reguir, Kressall, Crozier, Pisiak, Sidhu and Yang2015) from the Aley carbonatite as this intrusion, in common with other carbonatites in the British Columbian Cordillera, have been subjected to metamorphism and tectonic deformation subsequent to their emplacement (Mitchell et al., Reference Mitchell, Chudy, McFarlane and Wu2017).
Folded apatitite similar to the Good Hope clasts are apparently rare as most accumulations of apatite in carbonatites consist of subhedral crystals with allotriomorpic granular rather than prismatic textures, although when present prisms tend to be large (0.1–15 mm) isolated euhedral to subhedral crystals. An apatite carbonatite with folded bands of apatite has been noted from the Ngualla carbonatite (Tanzania) by Witt et al. (Reference Witt, Hammond and Hughes2019). This carbonatite has not been metamorphosed or deformed tectonically. Unfortunately, only a macroscopic description was presented by Witt et al. (Reference Witt, Hammond and Hughes2019) without accompanying textural or mineralogical data. Deformed apatitite clasts have been recognised (this work) from the St. Honoré (Québec) carbonatite which are analogous to the Good Hope folded clasts. In this example (Supplementary Fig. S1, see below) apatite prisms plus pyrochlore are deflected around large magnetite crystals. Clearly, on the basis of their texture prismatic apatitite clasts must have a different genesis and/or subsolidus re-equilibration history to granular types (see below).
Apatite – composition
The apatite-group mineral comprising the apatitite clasts is close in composition (3.6–3.8 wt.% F; 41.2–41.5 wt.% P2O5; 54.9–55.0 wt.% CaO) to ideal Ca5(PO4)3F and is thus fluorapatite. The only minor element detectable by quantitative EDS is Sr (~0.9–1.1 wt.% SrO). Compositional zoning is not evident in back-scattered electron images.
Of the trace elements (ppm) present the most notable are: Si 108–572; Mn 79–396; Sr 7030–13,000; Y 139–439; Ba 25–59; Th 3.8–17; La 589–1280; Ce 1830–3940; Pr 262–571; Nd 1450–2740; Yb 5.2–12. The full data set is given in Supplementary Table S1 (see below). Representative data, only for apatite cores are given in Table 1, as the rims evident in CL are too small for analysis with the analytical system employed. Figure 8 illustrates chondrite-normalised (CN) rare earth element (REE) distribution patterns for Good Hope apatite. Although the patterns show a general depletion in REE abundance from La–Lu two distinct segments are evident with an inflection at Nd–Sm: a relatively flat segment from La–Nd; and a smoothly decreasing segment from Sm–Yb. The former is a consequence of these apatites having relatively low La/NdCN ratios (0.73–1.14) in comparison to apatite from other carbonatites which exhibit smooth REE distribution patterns from La–Yb [e.g. Alnö 1.8–2.9; Fen; 1.80; Jacupiranga 1.58; Hornig-Kjarsgaard (Reference Hornig-Kjarsgaard1998); Kaiserstuhl 2.94–4.04; Wang et al. (Reference Wang, Marks, Wenzel, Von Der Handt, Keller, Teiber and Markl2014); Belaya Zima 1.53–1.77; Doroshkevich et al. (Reference Doroshkevich, Veksler, Klemd, Khromova and Izbrodin2017)]. These data are interpreted to imply that the Good Hope apatites are relatively depleted in La, Ce, Pr and Nd. Another notable difference is their paucity in Si (108–572 ppm) compared to other carbonatite apatite [2000–2288 ppm Kaiserstuhl; 560–1494 ppm; Wang et al. (Reference Wang, Marks, Wenzel, Von Der Handt, Keller, Teiber and Markl2014); Doroshkevich et al. (Reference Doroshkevich, Veksler, Klemd, Khromova and Izbrodin2017)].
Chondrite-normalised (Boynton, Reference Boynton and Henderson1985) REE distribution patterns of apatite in four different apatitite clasts. Samples (a) VAL2 and (b) VAL4A are from near-surface exploration pits. Data for VAL2 are for the folded clast shown in Figs 3 and 8. Samples (c) 337 and (d) 540 are different levels (depth in metres) from 60° and 50° inclined drill cores in the complex. These data show that REE distributions are very similar regardless of location in the complex.

Representative trace-element compositions (ppm) of apatite.*

* Good Hope: VAL2, VAL4A and 337 prismatic apatite; 540 coarse grained anhedral apatite. Prairie Lake: PX-A apatite in pyroxene apatitite; W-A apatite in wollastonite apatitite. Blanks indicate below limit of detection.
Anhedral single crystals of apatite in the Prairie Lake heterogeneous carbonatites, in marked contrast to Good Hope apatite, in common with many other carbonatite apatites (Hornig-Kjarsgaard, Reference Hornig-Kjarsgaard1998; Wang et al., Reference Wang, Marks, Wenzel, Von Der Handt, Keller, Teiber and Markl2014; Doroshkevich et al., Reference Doroshkevich, Veksler, Klemd, Khromova and Izbrodin2017), exhibits smooth chondrite-normalised REE distribution patterns with La/NdCN 1.26–2.0 (see fig. 3 in Wu et al., Reference Wu, Mitchell, Li, Zhang and Yang2017). Apatite in allotriomorphic granular apatitite cumulates occurring as megaxenoliths in the Prairie Lake heterogeneous carbonatite exhibit smooth La–Lu distribution patterns with La/NdCN ratios ranging from 1.36–1.53 and 1.85–2.01 for pyroxene apatitite and wollastonite apatitite, respectively (Fig. 9). These data further emphasise the unusual textural and geochemical character of the Good Hope apatite relative to that in the main carbonatites of the Prairie Lake complex.
Chondrite-normalised (Boynton, Reference Boynton and Henderson1985) REE distribution patterns of apatite from (a) wollastonite apatitite and (b) pyroxene apatitite xenoliths in the Prairie Lake heterogeneous carbonatites. Note that these apatite do not exhibit the La–Nd depletion evident in the Good Hope apatites illustrated in Fig. 8.

Pyrochlore paragenesis
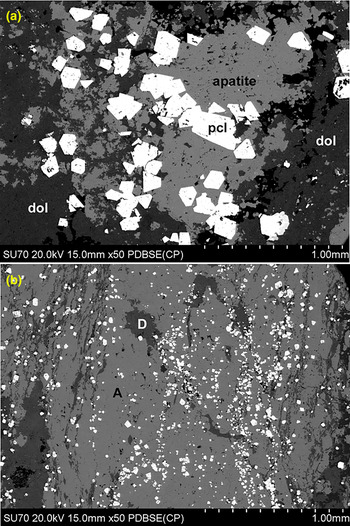
Pyrochlore is the only primary Nb-bearing mineral in the apatitite clasts. The pyrochlore occurs primarily as euhedral single crystals which exhibit a wide range in size from ~50 μm to 1 mm, with the majority ranging from 300–600 μm (Figs 5, 10–11). Large aggregations of pyrochlore with allotriomorphic granular textures are not present, although clusters of two to three intergrown euhedral-to-subhedral 30–100 μm crystals are relatively common. The pyrochlores exhibit a very wide range of characters depending on: the abundance of inclusions of apatite and calcite; the extent of compositional zoning; and replacement by other Nb-bearing minerals. Note that apatites included in pyrochlore occurs as small (<15 μm) inclusions of irregular amoeboid shape and prismatic apatite is rarely present: both these and anhedral calcite are possibly secondary inclusions.
Back-scattered electron images at the same scale of pyrochlore (white) enclosed in apatite in different apatitite clasts illustrating the extremely wide range in size of the crystals. Note that the majority of pyrochlores are single euhedral crystals. (A = apatite; pcl = pyrochlore; D and dol = dolomite). Scale bar = 1 mm with 100 μm divisions.

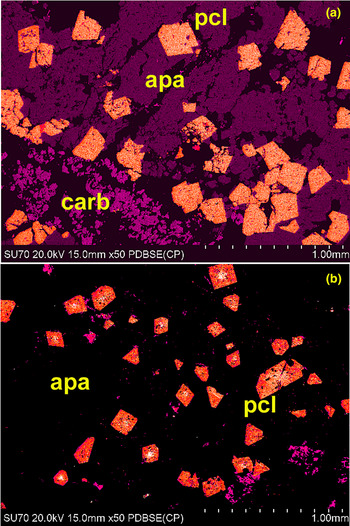
False-colour back-scattered electron images of pyrochlores in two different apatitite clasts demonstrating that individual clasts differ with respect to the size and compositional zoning of the pyrochlores. (a) Na–Ca pyrochlores with columbite-(Fe); (b) pyrochlores with A-site deficient Sr, Ba and Fe enriched cores (white) and Na–Ca pyrochlore margins. (pcl = pyrochlore; apa = apatite; carb = carbonates). Scale bar = 1 mm with 100 μm divisions.

The majority of the pyrochlores show only minor resorption although some crystals appear to have been broken prior to incorporation in their host apatitite clasts (Fig. 11a). Euhedral and broken single crystals can be found with a given clast. Pyrochlores are also common as single crystals disseminated in the ferrodolomite and late-stage hydrothermal quartz-bearing carbonatites. Some of these pyrochlores are derived from the disaggregation of apatitite clasts whereas others are primary minerals which have apparently crystallised from the diverse later intruded carbonatites. Such pyrochlores are commonly smaller than those in the apatite clasts, exhibit complex oscillatory compositional zoning and can host inclusions of quartz or magnesio-arfvedsonite. Description of the paragenesis and composition of all pyrochlores in the Good Hope carbonatites is beyond the scope of this work, and will be the subject of a subsequent manuscript.
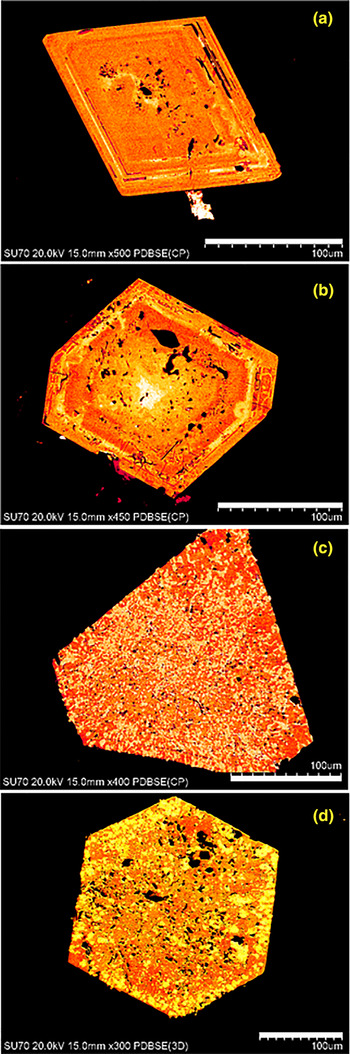
The pyrochlores in the apatitite clasts exhibit many similar textural and compositional characteristics although these differ between individual clasts (Figs 11,12). All pyrochlores exhibit compositional zoning in back-scattered electron images. This can range from a few very thin bands of higher average atomic number in an otherwise uniform crystal (Fig. 12a) and more rarely to complex zoning from an irregular high average atomic number core to multiple growth bands of differing composition (Fig. 12b). The pyrochlores range from essentially alteration-poor varieties to those with minor or near complete replacement by fine-grained (<20 μm) anhedral crystals of either columbite-(Fe) (Fig. 12c) and/or fersmite (Fig.12c), with some crystals replaced by both minerals in fine-grained intergrowths. Columbite-(Fe) is Ti- and V-bearing with up to 6 wt.% TiO2 and 3.5 wt.% V2O5. Fersmite is near stoichiometric CaNb2O6 with minor TiO2 (2–3 wt.%) and FeOT 0.6–3.2 wt.%). Note that discrete crystals of these niobates are not present in the apatitites or the associated carbonatites.
False-colour back-scattered electron images illustrating the range of compositional zoning occurring in Good Hope pyrochlores from apatitite clasts. (a) Relatively uniform Na–Ca pyrochlore with thin oscillatory zoning resulting from Sr, Ba and Fe enrichment; (b) pyrochlore with an A-site deficient Sr, Ba and Fe enriched core (white) and zones of Na–Ca pyrochlore (orange) and Sr–Ba–Fe pyrochlore (yellow) margins; (c) small anhedral columbite-(Fe) crystals (yellow) replacing Na–Ca pyrochlore (orange); (d) anhedral fersmite (yellow) replacing Na–Ca pyrochlore (orange). Scale bar indicates 100 μm.

Pyrochlore composition
Pyrochlore-group compounds have the ideal structural formula A 2B 2O6Z. In carbonatites pyrochlores are not stoichiometric and contain cation vacancies (Atencio et al., Reference Atencio, Andrade, Christy, Gieré and Katashov2010); typical compositions are expressed as [(Ca,Na,Sr,Ba,Ce,U4+)2–x(Nb,Ti,Ta,Fe3+)2O6(OH,F)1–y⋅zH2O]. Hydroxyl anions and H2O cannot be analysed by EDS and F determination is not exact due to significant overlaps of the FKα peak with diverse low-energy X-ray peaks (particularly FeLα). Pyrochlore compositions obtained by both wavelength-dispersive and energy-dispersive electron beam methods are generally expressed on a volatile-free basis with the number of B-site cations fixed at 2.0 (Hogarth et al., Reference Hogarth, Williams and Jones2000), as unlike A-site cations these are considered not to be subject to leaching during weathering and/or hydrothermal activity (Lumpkin and Ewing, Reference Lumpkin and Ewing1995). The A-site deficiency is commonly used as a measure of alteration or metamictisation (Nasraoui and Bilal, Reference Nasraoui and Bilal2000; Zurevinski and Mitchell, Reference Zurevinski and Mitchell2004). Representative compositions of Good Hope pyrochlores in apatitite clasts are given in Table 2. All of the pyrochlores in the Good Hope apatitites are poor in Ti and Ta. As Nb > Ti >> Ta (atoms per formula unit) they are classified as pyrochlore sensu stricto (Hogarth, Reference Hogarth1977; Atencio et al., Reference Atencio, Andrade, Christy, Gieré and Katashov2010).
Representative compositions (wt.%) of pyrochlore.*

* Σcat = total cations; A site = total cations in this site; ΣA = A-site deficiency. Elements not detected at <0.4 wt.% oxide are: Mg; Al; Cl; Mn; REE; Pb. Blanks in the table indicate not detected.
Typically the commonest, earliest forming and least replaced pyrochlores (Fig. 12a) are Na–Ca pyrochlore that is poor in Sr and has only minor (5–20%) A-site deficiency (Table 2, comps. 1–3). Thin oscillatory bands of higher average atomic number are present in some crystals which have increased Sr and Ba contents and lower Na (Table 2, comps. 4–5), but are not otherwise markedly different. Less commonly, pyrochlores exhibit strong compositional zoning (Fig. 12b) with typically irregular cores of Na–Ca depleted material with high average atomic number consisting of A-site deficient (>50%) pyrochlore enriched in Sr, Ba, Fe, Si and U (Table 2; comp. 6–8). These cores are typically overgrown by, or are gradational into, Na–Ca pyrochlores without A-site deficiency. The example shown in Fig. 12b illustrates further syntaxial overgrowth of Sr-rich pyrochlore followed by Na–Ca pyrochlore.
From the above textural and compositional data it is apparent that many pyrochlores have had a complex evolutionary history and that more than one generation of pyrochlore is present. The suite has some similarities to pyrochlore populations in other carbonatites in which U–Ta-enriched pyrochlore of irregular habit is enclosed in oscillatory zoned pyrochlore (Walter et al., Reference Walter, Parsapoor, Braunger, Marks, Wenzel, Martin and Markl2018; Lee et al., Reference Lee, Lee, Garcia, Moutte, Williams, Wall and Kim2006; Zurevinski and Mitchell, Reference Zurevinski and Mitchell2004; Hogarth et al., Reference Hogarth, Williams and Jones2000; Chakhmouradian and Zaitsev, Reference Chakhmouradian and Zaitsev1999). However, note that extensively oscillatory zoned pyrochlores of the type illustrated in figure 2C of Hogarth et al., Reference Hogarth, Williams and Jones2000) or figures 2A and 2C of Walter et al. (Reference Walter, Parsapoor, Braunger, Marks, Wenzel, Martin and Markl2018) are not found at Good Hope.
Walter et al. (Reference Walter, Parsapoor, Braunger, Marks, Wenzel, Martin and Markl2018) and Lee et al. (Reference Lee, Lee, Garcia, Moutte, Williams, Wall and Kim2006) have suggested that the U–Ta enriched pyrochlore cores in Kaiserstuhl and Sokli carbonatites are resorbed xenocrysts which did not crystallise from the magma which crystallised oscillatory zoned pyrochlore overgrowths. Similar Good Hope pyrochlores might have had such an origin but they cannot be linked to any pyrochlores crystallising from co-genetic silicate magmas, as there is no geological evidence for the presence of such magmas i.e. xenoliths, consanguineous pyrochlore-bearing intrusions, interaction with, or derivation from, the main Prairie Lake occurrences of ijolites and carbonatites. In addition, the Good Hope Sr–Ba–Fe–U enriched cores are notably poor in U and Ta (<2 wt.% UO2; <1 wt.% Ta2O5) relative to Kaiserstuhl and Sokli types (>20 wt.% UO2; >9 wt.% Ta2O5). An alternative explanation for Ta, and by analogy Sr, Ba, Fe and U, enrichment in early crystallising pyrochlores has been suggested by Kjarsgaard and Mitchell (Reference Kjarsgaard and Mitchell2008), who note that Ta-rich pyrochlores are F poor and Ta poor whereas Na–Ca pyrochlores are F rich. Although quantitative compositional data for F are not available for Good Hope pyrochlores, semi-quantitative data suggest that the strongly A-site deficient pyrochlores have lower F (<3 wt.% F) contents than Na–Ca pyrochlores (<4 wt.% F) Thus, it is suggested that variations of F fugacity in the melt can also lead to the crystallisation of different varieties of pyrochlore.
Currently, oscillatory zoning of pyrochlores is considered to have magmatic origins (Hogarth et al., Reference Hogarth, Williams and Jones2000), and to be originating from supersaturation of magma with mineral end-members of different solubilities. Oscillatory zoning is considered to occur in undisturbed environments, whereas homogeneous crystals form in turbulent conditions. Thus, crystals exhibiting both homogeneous regions and oscillatory zoning might reflect either (or both) in situ growth with repeated changes in magma rheology from turbulence to quiescence or transport of growing crystals from one rheological regime to another.
The observations suggest the Good Hope pyrochlore suite has diverse origins with some pyrochlores formed by incorporation of Sr, Ba, Fe and U-rich pyrochlore into a magma (of higher F fugacity?) crystallising mainly homogeneous Na–Ca pyrochlore and/or oscillatory zoned pyrochlore with alternating conditions of turbulence and quiescence. Thus, pyrochlores with, or lacking, enriched cores can coexist with homogeneous and/or oscillatory zoned types. Many, but not all pyrochlores were then subject to alteration and replacement by fersmite and columbite-(Fe), with some altered crystals being returned to environments where homogeneous overgrowth of Na–Ca pyrochlore were resumed. Overall the suite represents growth under diverse rheological conditions and is undoubtedly a consequence of magma mixing.
Genesis of the pyrochlore apatitites
Experimental studies of Nb-bearing haplocarbonatites have a bearing on the origins of the pyrochlore apatitites as these indicate that pyrochlore can be the initial crystallising phase over a wide range of bulk compositions and temperatures (Mitchell, Reference Mitchell, Linnen and Samson2004; Jago and Gittins, Reference Jago and Gittins1993). For example, Mitchell and Kjarsgaard (Reference Mitchell and Kjarsgaard2004) have shown that in the system NaNbO3–CaCO3–CaF2 there is a large high temperature (>900°C) pyrochlore liquidus phase field for bulk compositions with up to 40 wt.% NaNbO3 along the join [CaCO3)60(CaF2)40]–NaNbO3.
Textural relationships between pyrochlore and apatite indicate that the pyrochlores formed prior to incorporation in apatite matrices and undoubtedly were, in accord with the experimental studies, the primary liquidus phase in their parental magma. If this magma was held at diverse temperatures within the liquidus field of pyrochlore it is possible that a suspension of isolated crystals would be formed that experienced changes in composition and rheology giving rise to the observed diverse types of compositional zoning but without the crystals sinking rapidly to form cumulates. The pyrochlores cannot represent a disrupted annealed cumulate as fragmentation of allotriomorphic granular clasts would release pyrochlores of different morphology to those observed in the apatitite clasts. It is apparent that cooling of the magma parental to the pyrochlores did not reach either an apatite–pyrochlore or a calcite–pyrochlore cotectic. Thus, to explain the observed association with apatite this diverse assemblage of pyrochlore crystals must eventually have been transported as individual crystals to an environment where apatite was crystallising and accumulating.
Unfortunately there are no experimental studies of haplocarbonatite systems involving both niobium and phosphorus. The only investigation of P-bearing haplocarbonatite is that of Wyllie and Biggar (Reference Wyllie and Biggar1966). This study showed that apatite has very limited solubility in haplocarbonatite magmas and that undoubtedly it can be the initial liquidus phase over a wide range of compositions and temperature at 1 kb pressure. These observations combined with the prediction above that pyrochlore can also be an initial crystallising phase suggest that either pyrochlore or apatite can be an initial liquidus phase depending on the bulk composition of the magma. It also follows that with magma crystallisation, bulk compositions should reach a cotectic involving both phases. However, the observed textures of the apatitite clasts suggest that both minerals crystallised independently, with pyrochlore in a relatively quiescent regime and no crystal settling to form cumulates, in contrast to the small prismatic aligned apatite crystals with textures suggestive of a transported assemblage in a turbulent environment.
Conclusions
On the basis of the above discussion, a preliminary hypothesis for the formation of the pyrochlore-apatitite clasts is: (1) crystallisation of pyrochlore as the primary liquidus phase from an unidentified magma with formation of single crystals exhibiting diverse compositional zoning due to variations in solubility, magma rheology and volatile fugacities; alteration and replacement of pyrochlore by fersmite and columbite-(Fe); (2) rapid crystallisation of apatite in a different and also unidentified magma as an initial liquidus phase; concentration of apatite as swarms of small prismatic crystals by magmatic currents; (3) magma mixing with transport of apatite into the pyrochlore-bearing magma by turbulence with mechanical incorporation of pyrochlores in apatite; (4) lithification of the apatite plus pyrochlore as pyrochlore apatitite; and finally disruption of the apatitite ‘pseudocumulate’ by later intrusions of carbonatite with formation of apatitite clasts in ferrodolomite and calcite carbonatite hosts.
Overall the genesis of the apatitite clasts is considered to be one of magma mixing and is thus a rheological process rather than one of simple differentiation of a single parental magma. Unfortunately, the character of the parental magmas and the geological location of unfragmented apatitites at depth in the Good Hope intrusion as yet remains unknown. One objective of current exploration at the Good Hope Nb property is to locate undisrupted apatitites as these could form a significant high-grade Nb deposit
Acknowledgements
This study is supported by Plato Gold Corporation, Almaz Petrology, The Wahl Group, and Lakehead University. Sam Broom-Fendley and two anonymous reviewers are thanked for comments on the initial draft of this paper. Stuart Mills and Helen Kerbey are thanked for the Editorial and Production aspects of the publication of this work.
Supplementary material
To view supplementary material for this article, please visit https://doi.org/10.1180/mgm.2019.64