




No CrossRef data available.
Article contents
Trypanosomes, fleas and field voles: ecological dynamics of a host-vector–parasite interaction
Published online by Cambridge University Press: 06 May 2005
Abstract
To investigate the prevalence of a flea-borne protozoan (Trypanosoma (Herpetosoma) microti) in its field vole (Microtus agrestis) host, we monitored over a 2-year period a range of intrinsic and extrinsic parameters pertaining to host demographics, infection status and vector (flea) prevalence. Generalized Linear Mixed Modelling was used to analyse patterns of both flea and trypanosome occurrence. Overall, males of all sizes and ages were more likely to be infested with fleas than their female counterparts. Flea prevalence also showed direct density dependence during the winter, but patterns of density dependence varied amongst body mass (age) classes during the summer. Trypanosome prevalence did not vary between the sexes but was positively related to past flea prevalence with a lag of 3 months, with the highest levels occurring during the autumn season. A convex age-prevalence distribution was observed, suggesting that individuals develop a degree of immunity to trypanosome infection with age and exposure. An interaction between age and whether the individual was new or recaptured suggested that infected animals are less likely to become territory holders than their uninfected counterparts.
Keywords
Information
- Type
- Research Article
- Information
- Copyright
- © 2005 Cambridge University Press
INTRODUCTION
Field voles (Microtus agrestis), like other rodents, are exposed to ectoparasites such as fleas (Siphonaptera) and ticks (Ixodida) and, as a result, are commonly infected with parasites associated with vector-borne transmission (e.g. the protozoan Trypanosoma microti Laveran and Pettit, 1909; Molyneux, 1968; Noyes et al. 2002). As endemic infections they are widely believed to be of little importance in host population dynamics and have received relatively little attention from ecologists. However, an increasing number of vector-borne parasites are becoming recognized as potentially important zoonotics (Daszak, Cunningham and Hyatt, 2000; Williams et al. 2002), and there is a need for a greater understanding of how infections are maintained and transmitted under natural conditions (Morner et al. 2002). Although T. microti is non-pathogenic to humans it does offer a model system to investigate the dynamics of a flea-transmitted disease within a naturally occurring wildlife population. More specifically, it offers the opportunity to determine whether the dynamics of a flea-borne pathogen are directly linked to the dynamics of its vector, or whether there are additional factors that are important in understanding both temporal variation and host heterogeneity in the maintenance and transmission of infection.
T. microti is a host-specific stercorarian trypanosome of the subgenus T. (Herpetosoma) (but see Noyes et al. 2002). Many rodent trypanosomes are considered to be of low pathogenicity (Hoare, 1972), but there is evidence for anaemia resulting from infection in microtines, and a condition-dependent or stress-related increase in virulence in some insect-trypanosome relationships (Wiger, 1977; Brown, Loosli and Schmid-Hempel, 2000). The main route of transmission from infected flea to vertebrate host is via contamination of a bite wound or feeding site by the infective-stage metatrypanosomes shed in the faeces of the feeding flea. A secondary route of infection is thought to be via the ingestion of contaminated fleas or flea faeces by the vole during grooming, which subsequently leads to infective metatrypanosomes penetrating the oral mucous membrane and entering the bloodstream (Hoare, 1972). The reproductive phase of T. microti within the field vole host takes approximately 7–13 days under laboratory conditions, including an incubation period of 6–9 days (Molyneux, 1969). Once the infection becomes established it lasts between 23 and 74 days, with a patent period typically showing a rapid rise in parasitaemia ([ges ]10000 parasites/μl) then a steady decline towards the end of infection (Hoare, 1972).
Although the trypanosomes of zoonotic and economic importance are particularly well studied (Barrett et al. 2003), surprisingly little is known of the ecology of the rodent trypanosomes within their natural environment (Wita, Karbowiak and Czaplinska, 2003). For example Healing (1981) concluded that trypanosome infection was more prevalent in younger rodents and was related to host density, but was not affected by extrinsic factors such as season, whereas Turner (1986) suggested that infection was predominantly found amongst older rodents and followed a seasonal pattern, with high prevalence during the summer and autumn. More recently, Bajer et al. (2001) and Pawelczyk et al. (2004) found that the variation in prevalence of haemoparasites, including trypanosomes in bank voles (Clethrionomus glareolus) and common voles (Microtus arvalis), was determined by temporal and seasonal factors and their interactions while intrinsic factors such as age and sex played only a minor role.
However, despite their crucial role in maintaining and transmitting infection, few studies on trypanosome dynamics within natural populations have taken into account the ecology of the vector species involved. To our knowledge, no other longitudinal study has considered the effects of both host and vector with regards to trypanosome dynamics. The aim of the present study, therefore, using 2 years of field data from 2 sites, was first to seek to understand the prevalence of fleas occurring on field vole hosts using characteristics such as host density, age, sex and extrinsic factors such as season. Subsequently, the aim was to seek to understand the prevalence and distribution of trypanosome infection within the populations using variables describing both flea and field vole dynamics together with the effects of seasonal variation.
MATERIALS AND METHODS
Study site
The study was carried out within two clear-cut areas in Kielder Forest, Northumberland, England (55 ° 13′ N, 2 ° 33′ W), a large (~600 km2) man-made forest with Sitka spruce (Picea sitchensis) and Norway spruce (Picea abies) providing the bulk of the harvest. Timber extraction produces isolated clear-cut areas ranging from 5 to 50 ha over a 50-year rotational period. Following 2–3 years of ‘successional’ growth the clear-cut areas become dominated by Deschampsia cespitosa and Juncus effuses and thus become suitable habitat for field voles. Further regeneration leads to a low scrub/thicket stage that ultimately reduces habitat suitability. It is estimated that at any one time approximately 16–17% of the forest area may contain suitable habitat for field voles (Lambin, Petty and MacKinnon, 2000).
Trapping regime
One permanent trapping grid, consisting of 100 Ugglan live multiple-capture traps in a 10×10 array, was established within each of 2 clear-cuts, identified as PLJ and KCS. Traps were spaced at 5 m intervals giving a grid size of 0·25 ha. Trapping was carried out every 4 weeks from March 2002 to March 2004 excluding the months of December and February for logistical reasons (n=23 primary sessions). Traps were pre-baited for 3 nights to maximize capture rates, then set with crushed oats and carrot and checked 5 times (secondary sessions) at dawn and dusk over a 3-day period.
All field voles were tagged on their first capture occasion with a subcutaneous Passive Induced Transponder (PIT) tag (Labtrac by AVID plc, East Sussex, UK) thus giving each individual a unique 9-digit identification number. In addition, and on the first recapture occasion during each subsequent primary trapping session, we recorded each individual's sex, mass (to the nearest 0·5 g), coat colour (juvenile, adult/juvenile or adult) and location within the trapping grid and estimated their body condition (Cavanagh, 2001). Briefly, body condition is based on an index derived from palpating the fat deposits over the spine and hips. Scores for each ranged from 1 (low) to 5, giving a combined body condition index ranging between 2 and 10.
Individuals were assigned to 1 of 2 maturity classes on the following criteria. Mature adults: males weighing [ges ]19 g with an adult coat and showing signs of sexual maturity (testes either abdominal-+ or scrotal); females weighing [ges ]19 g with an adult coat and showing signs of sexual maturity (nipples medium or large, vulva perforate or plugged, pubic symphysis open or slightly open or presently gestating). Immature adults/juveniles: males weighing <19 g with a juvenile or adult/juvenile transitory coat and abdominal testes; females weighing <19 g with a juvenile or adult/juvenile transitory coat, closed pubic symphysis, small nipples and a non-perforate vulva.
All field voles were checked for ectoparasites on their first capture occasion each primary session by brushing or blowing against their fur while holding them in a gloved hand. However, as we neither wished to remove fleas, as happens when animals are combed over a water bath, nor overestimate infestation by wrongly counting moving fleas multiple times, it was considered inappropriate to attempt to name the exact number of fleas on any given individual. We therefore adopted an alternative method that more accurately reflected potential inprecision whereby we scored the combined prevalence of all flea species (Siphonaptera: Ctenophthalmus nobilis, Peromyscopsylla silvatica spectabilis, Malaraeus penicilliger and Rhadinopsylla pentacantha) on a semiquantitative scale of 1–3, with 1=1–2 fleas, 2=3–5 fleas and 3=>5 fleas. The range of flea species found on field voles within Kielder Forest was established as part of a separate study involving biannual monitoring (March (n=381) and September (n=219)) at 27 sites over a large spatial scale, where animals were killed and fleas identified in the laboratory (S. Telfer, unpublished data). The larger and relatively slower moving mole fleas (Hystrichopsylla talpae) were counted individually but pooled with the above species when creating a binary present/absent flea covariate for trypanosome analysis (see below). The relative abundance of each species changed throughout the year, with C. nobilis the most prevalent in March (0·328), followed by M. penicilliger (0·084), H. talpae (0·039) P. silvatica spectabilis and R. pentacantha (0·005). In September, P. silvatica spectabilis was most abundant (0·239), followed by H. talpae (0·147), C. nobilis (0·142), and M. penicilliger (0·078), with no report of R. pentacantha during the autumn survey (S. Telfer, unpublished data). However, as it was not possible to determine the relative competencies of each species as a vector for T. microti it was assumed that all species covaried equally throughout the year.
Blood sampling and PCR
Blood samples of approximately 20–30 μl were collected from the tip of the tail on the first capture occasion each primary session. Blood samples were centrifuged to remove excess serum and DNA was extracted from the remaining pellets using the alkaline digest method (Bown et al. 2003).
Then 5 μl of the DNA extract was used as a template in a nested PCR that targeted a variable region of the trypanosome 18SrRNA gene. Each 50 μl reaction also contained 25 μl of 2× PCR Master Mix (Abgene, Surrey, UK), 18 μl of ddH20 and 1 μl of of the following external primers: TRY927F 5′ GAAACAAGAAACACGGGAG, TRY927R 5′ CTACTGGGCAGCTTGGA, for 30 cycles of 94 °C 30 s; 55 °C 60 s; 72 °C 90 s (Noyes et al. 1999, 2000). The products from the first-stage reaction were diluted 1[ratio ]10 and 2 μl of this was used as template for the second round using 1 μl of the internal primers: SSU561F 5′ TGGGATAACAAAGGAGCA, SSU561R 5′ CTGAGACTGTAACCTCAAAGC, 1 μl of ddH20, 45 μl of ReddyMix® PCR Master Mix (Abgene UK) and the cycling conditions described above. Then 12 μl of the second-round PCR product were loaded onto a 1·5% agarose gel stained with ethidium bromide and visualized under UV light. Samples producing a band of ~540 kb were considered positive.
PCR sensitivity, estimated by comparing the number of false negatives (single negatives within a complete sequence of positives) to the totals number of potential false negatives was 91·47%. Where it was not possible to retest suspected false positive results (i.e. single positives within a complete sequence of negatives), the individual in question was excluded from the analysis (n=27). DNA extraction, primer preparation, first and second-stage PCR were all carried out in separate dedicated rooms to reduce the risk of contamination.
Population estimates
Field vole population density within each primary session was estimated using the closed population model Mth within Program CAPTURE (Otis et al. 1978). Model Mth assumes capture probabilities vary between secondary sessions and show heterogeneity amongst individuals (Pollock, 1982). Due to bad weather during the January 2003 primary session (#11), both grids were only trapped 3 times and density was estimated using the Minimum Number Alive method (Krebs, 1966). When extrapolating from density/grid to population density/ha we assumed an effective trapping area of 0·3 ha (55 m×55 m), equal to an additional 0·5 trap-width on all sides, to allow for an edge effect.
Statistical analysis
Both the prevalence of fleas and trypanosome infection were modelled separately as binary response variables (fleas: present/absent, trypanosomes: positive/negative) using Generalized Linear Mixed Models (GLMM) with binomial errors and a logit link function (Paterson and Lello, 2003). In the absence of model selection criteria for GLMM that can distinguish between non-nested models, prior to the inclusion of random effects we investigated temporal patterns in flea and trypanosome prevalence, with the best seasonal GLM selected based on the Schwarz Criterion (SC) (Turchin, 2003). SC, otherwise known as the Bayesian Information Criterion, selects the most probable model based on fit and sample size with an additional penalty for complexity, and is similar in function to the unbiased Akaike Information Criterion (AICc) (Johnson and Omland, 2004). As with AICc, alternative models with differences in SC values <2 (ΔSC) are not considered to differ in their ability to describe the data (Burnham and Anderson, 2002). We investigated which of 8 seasonal variables best described temporal variation in flea and trypanosome prevalence. The seasonal variables ranged from a monthly pattern through several combinations with varying length of winter and summer periods: for example, bimonthly, starting in March 2002 (6 seasons), trimonthly, starting March 2002 (4 seasons), and in 4-month groupings starting April 2002 (3 seasons). We also considered 3 varying length 2-season models (winter-summer) and whether prevalence levels varied between years.
Using the best seasonal model as a starting point, further analysis was conducted in a 2-stage process, with population level covariates investigated first and then individual level covariates. As all individuals within a grid experience the same density on any given trapping session, and multiple recordings were taken from many individuals over time, trapping session and individual were included as random effects using the GLIMMIX macro in SAS (Littell et al. 1996).
The population level covariates considered were year, site, present density and lag-densities of 2, 4 and 6 months and, for trypanosome prevalence, the proportion of hosts infested with fleas in the present session as well as at lags of 1–4 months. Two-way interactions between each of the continuous variables and year, site and season were also considered. Model selection was based on a step-down procedure, eliminating interactions first and retaining only those variables significant at the 2% level based on SAS type III F-test values (SAS/STAT, 1992).
Using the best model that incorporated seasonal and population level variables as a starting point individual covariates were then investigated in a similar manner. The individual level covariates considered were sex, maturity, whether the individual was new or recaptured from a previous session (N-R), 1 of 4 body mass based categories used as a proxy for age (<17 g; 17–24 g; 25–39 g and [ges ]40 g) (Cavanagh et al. 2004) and a classification of the body condition index as follows: BC index 2–4=1, BC index 5–6=2, BC index 7–10=3. For trypanosome prevalence we also included the semi-quantitative scale of flea prevalence as well as a binary measure representing whether fleas were present or absent regardless of the level of infestation. All 2-way interactions between seasonal, population and individual level variables were considered. Cross-correlation analysis between flea and trypanosome prevalence (see below) was carried out using SPSS V11.
RESULTS
Descriptive summary
A total of 1212 M. agrestis were used in the analysis, giving an effective sample size, including recapture occasions, of 3004. The structure of the population by sex and site is given in Table 1. The percentage of males was 59% at PLJ and 56% at KCS. The total number of individuals caught was similar between the 2 grids though recapture rates were higher at KCS. In addition, wood mice (Apodemus sylvaticus) were occasionally caught at both sites in low numbers (maximum 20 within any session), and bank voles (Clethrionomys glareolus), at similarly low numbers, at KCS only.

The two populations had similar prevalences of fleas and trypanosome infection (Fig. 1). Across all capture and recapture occasions, 57% of males (927/1627) and 42% of females (578/1377) were found to have some level of flea infestation and 39% (642/1627) of male blood samples and 36% (500/1377) of female blood samples were PCR positive for T. microti. The duration of trypanosome infection was variable, with 1 individual testing positive for 9 consecutive sessions and a further 2 individuals positive over 8 sessions. However, there was little evidence for the occurrence of secondary infections, with only 2 individuals testing positive again for 2 or more consecutive sessions following an initial period of recovery.

Fig. 1. Temporal variation in Microtus agrestis population density/ha (±S.E.) (A and D), flea prevalence (B and E) and trypanosome prevalence (C and F) on trapping grids KCS and PLJ respectively from March 2002 to March 2004.
Peak density on KCS rose from ~350/ha during late summer 2002 to 570/ha in August 2003 (Fig. 1A). A similar pattern was seen on PLJ, with densities rising from 210/ha in August 2002, to 717/ha in August 2003 (Fig. 1D). Lowest densities were recorded during June–July 2002 (36–73/ha) on PLJ and during April–June 2002 on KCS (73–86/ha). Flea prevalence on both grids increased during the early part of the year and remained relatively constant over much of the summer before returning to low levels over the winter months (Fig. 1B, E). Trypanosome prevalence appeared to increase rapidly, though later in the year than flea prevalence, then declined steadily to a low point during March and April (Fig. 1C, F).
Flea prevalence
The best-fit seasonal model for flea prevalence included 2 seasons: winter (November–March) and summer (April–October) (ΔSC >3 compared to next best model). The random terms individual and session both explained significant variation in the probability of flea infestation amongst hosts (Individual: Z=2·9, P=0·0019; Session: Z=3·58, P=0·0002) and were retained throughout the full modelling process. Of the population level parameters, the following were included in the final stage analysis: season (F(1,1589)=20·20, P=<0·0001) density (F(1,1589)=6·4, P=0·0115) and season*density (F(1,1589)=0·0157, P=0·0157). The final model retained the interaction between season and density and also included the individual level factors mass (F(3,1589)=1·09, P=0·3513), sex (F(1,1589)=39·98, P=<0·0001) and density*mass (F(3,1589)=6·03, P=0·0004). Parameter estimates are given in Table 2. Overall, males are significantly more likely to be associated with fleas than females, and the absence of interactions between sex and other terms suggests the difference remains effectively constant over all ranges of density, mass and season and their interaction terms.

In general, the probability that an individual was infested with fleas increased with the current population density of field voles, with the relationship showing a steeper slope in the winter (density*season interaction, Table 2). The interaction term density*mass was driven mainly by significant differences between mass categories in the slopes relating the probability of infestation to density in the summer season. During the summer, larger animals (mass categories 3 and 4) were more likely to be infested with fleas at higher densities, whilst smaller animals (mass categories 1 and 2) showed no such relationship (Fig. 2).
Trypanosome prevalence
The best-fit model had 4 seasons: ‘spring’ (March–May) ‘early summer’ (June–July (encompassing 3 sessions)), ‘late summer-autumn’ (August–October) and ‘winter’ (November–January). The random terms individual and session contributed significant variation to the presence of trypanosome infection (Individual: Z=8·8, P=<0·0001; Session: Z=3·97, P=<0·0001) and were again retained throughout the analysis. After consideration of the population level parameters, the following were included in the final stage analysis: season (F(3,1589)=30·24, P=<0·0001) and flea prevalence at lag-3 months (F(1,1589)=11·32, P=0·0008). After consideration of individual level parameters an interaction between mass and whether the animal was new or recaptured was also retained (F(3,1589)=13·64, P=<0·0001). Parameter estimates for the full model are given as logit values in Table 3.

The interaction between mass and N-R is driven by the fact that the recaptured animals in the lower 2 mass categories have higher probabilities of infection than new animals, whilst new animals in the upper 2 mass categories have higher probabilities of infection than recaptured animals (Fig. 3A). These patterns probably reflect differences between the true ages of new and recaptured animals classified within the same mass category. By definition, recaptured animals within mass category 1 are unlikely to be very young and may more closely resemble individuals within the second weight group in terms of actual age and exposure levels rather than small, new individuals. Similarly, new animals assigned to the upper mass categories may in fact be relatively young, compared to recaptured animals within the same mass category. A model with no mass*new/recapture interaction, intended to demonstrate the convex shape of the age-prevalence distribution (Fig. 3B), suggests that the probability of infection is significantly lower among the youngest animals (<17 g), and reaches a peak within the middle two groups (17–25 g and 26–39 g) before declining again amongst the heaviest or oldest animals (>39 g).

Fig. 2. Predicted probabilities of flea occurrence for males from all 4 mass classes (1=smallest, 4=largest). Plotted values are derived from reverse transformed linear predictors previously estimated from the model output in Table 2. Probabilities vary according to the interactions between mass*density and season*density but are shown here in terms of ‘summer’ and ‘winter’ over a realistic range of density estimates for the appropriate season. Estimates for females show a similar relationship but with approximately 11% lower overall values. Dotted lines represent 95% CI associated with estimates for mass groups 1 and 4.

Fig. 3. (A) Probability of trypanosome infection for new and recaptured field voles within each mass group estimated during autumn (season 3), when infection prevalence is highest, as predicted by the best-fit model in Table 3. (B) An alternative model without the new/recapture*mass interaction to emphasize the convex shape of the age-prevalence distribution.
The significant positive effect of flea prevalence at lag-3 months suggests an increase or decrease in flea prevalence at the population level is followed by a corresponding increase or decrease in the probability of trypanosome infection 3 months later. The probability of trypanosome infection is lowest during ‘spring’ (Fig. 4), which corresponds to the low levels of flea prevalence during the winter season (see Fig. 1B and E). Probability of infection then increases to 0·38 by ‘early summer’, then to 0·52 by ‘late summer-autumn’, again reflecting the increases in flea prevalence. By winter, the probability of infection has declined, which corresponds to the onset of the autumn reduction in flea prevalence.

Fig. 4. Probability of trypanosome infection within each of the 4-seasonal categories predicted for new animals in mass class 2.
Although the best-fit model selected flea prevalence at lag-3 months as a significant factor in determining current trypanosome prevalence, cross-correlation analysis suggests that the range over which this delayed density effect may be occurring actually ranges between lags 1–3 months (Fig. 5).

Fig. 5. Cross-correlation between flea prevalence and trypanosome prevalence up to lag-7. Positive coefficients suggest trypanosome prevalence was high 1–3 months following high flea levels. Negative values indicate low levels of trypanosome infection 3–5 months before high levels of flea prevalence. Confidence limits are set at 2 standard errors.
DISCUSSION
There was a high degree of heterogeneity within our field vole populations in their susceptibility to both ectoparasitism by fleas and infection by T. microti. Flea prevalence showed a strong seasonal pattern and was linked to field vole density, with males consistently more likely to be infested than females within the same age group. T. microti prevalence also showed a seasonal pattern and was related to flea prevalence with a lag of approximately 3 months, but showed no variation between host sexes.
Similar sex-differences in ectoparasite prevalence have been observed across a wide range of vertebrate taxa and are particularly common amongst mammals (Poulin, 1996). The underlying mechanisms behind such discrepancies are often divided into 2 broad categories, namely ecological and physiological (Zuk and McKean, 1996; Morales-Montor et al. 2004). The ecological mechanisms within our system are likely to be related to factors such as behavioural differences between the sexes in habitat use and hence variable exposure to parasites. Field voles are territorial during the breeding season and males aggressively defend relatively large non-contiguous home ranges, whereas females are less aggressive and often occupy smaller territories that overlap with those of neighbouring females (Reich et al. 1982; Taylor et al. 1984; Agrell Erlinge et al. 1996; Borowski, 2003). Young males are often forced to disperse as a result of aggressive encounters with older resident males within whose territory the natal nest is situated (Myllymaki, 1977). Fleas that increase fitness through dispersal would benefit through a greater association with male hosts (Lundqvist, 1988) – a suggestion apparently supported by data on the fleas of Californian ground squirrels, Spermophilus beecheyi (Bursten, Kimsey and Owings, 1997). Flea prevalence may thus be determined by host sex-specific differences in behaviour as well as behavioural modifications by fleas to adapt to those differences.
The physiological aspect of sex-bias in ectoparasite prevalence is commonly thought of as reflecting variation in the ability to mount an effective immune response. For example, increased levels of testosterone are known to depress both cell and humoral-mediated immune responses in reproductively active males, while stress-related corticosteroids are known to confound the production of antibodies (Khansari, Murgo and Faith, 1990). This effect is more pronounced in mammals that adopt a polygynous mating strategy due to the additional stresses associated with social (i.e. aggressive) interactions (Deerenberg et al. 1997; Klein and Nelson, 1999; Saino et al. 2000). Male M. agrestis, being highly polygynous, may encounter increasingly physiologically stressful situations during the breeding season when population density increases and territorial defence and competition for mates becomes intense (Pusenius and Viitala, 1993). Older males may therefore not only be physiologically more susceptible to flea infestation, but may also allow an ectoparasite to more readily obtain a longer bloodmeal and thus increase its fecundity levels (Lehmann, 1992; Tschirren, Fitze and Richner, 2003).
Older males supporting a disproportionate number of ectoparasites are an example of the commonly observed aggregated distribution of ectoparasites within host populations (Robbins and Faulkenberry, 1982; Shaw and Dobson, 1995). This has often been expressed as an 80/20 ‘rule’, which suggests that, typically, 20% of the host population supports 80% of the parasite population (Woolhouse et al. 1997; see, for example, Perkins et al. 2003). However, while in the present case males in the upper two mass groups comprise 22% of the population, the number of fleas estimated to have been found on them is only approximately 36% of the total (where category 1 is taken as 1·5 fleas, category 2 as 4 fleas and category 3 as 8 fleas). This emphasizes that the 80/20 or any other ‘rule’ is inevitably an oversimplification, and that flea prevalence is determined by a range of factors including climate, season and host density as well as age and sex (Lang, 1996; Krasnov, Khokhlova and Shenbrot, 2002; Stark, 2002; Stanko et al. 2002).
Variation in flea prevalence between the upper and lower mass groups at high densities may be the result of a saturation effect whereby, due to a rapid increase of juveniles during the summer breeding season, there are relatively more small transient animals in the habitat which do not enter the burrow systems and hence do not come into contact with as many fleas as the older and larger territory holders. A similar saturation effect, which resulted in lower flea infestation rates on non-resident Gerbillus dasyurus was reported by Krasnov et al. (2002). It must also be noted that the scoring of flea prevalence based on the method described here (all flea species grouped) may hide species-specific patterns of infestation. Different flea species may be more or less associated with the host or the burrow system and may differ in their seasonal patterns (Stark, 2002).
In comparison to previous studies, the overall level of trypanosome prevalence here (59·6%) is relatively high. For example, Healing (1981) reported Trypanosoma prevalences of 10·3% in M. agrestis and 11·1% in C. glareolus; Turner (1986) found 20·2% in C. glareolus and only 2·2% in the wood mouse Apodemus sylavaticus; Bajer et al. (2001) found an average prevalence of 15% in C. glareolus over 3 years; and Pawelczyk et al. (2004) reported prevalence levels ranging from 20% to less than 10% in M. arvalis over 4 years. However, the differences between these and the present results may largely be due to differences in diagnostic methods. Traditionally, detection of trypanosomes in field samples has been based on microscopic observations of Giemsa-stained thin and thick blood smears or culture (Hoare, 1972; Noyes et al. 1999). The sensitivity of PCR-based methods is believed to be 2–3 times higher (Masiga et al. 1992; Desquesnes and Davila, 2002), which is borne out by the survey of Solano et al. (1999) of a cattle herd in Burkina Faso (microscopy 5·3%, PCR 11·5%), and by the study of De Almeida et al. (1998) on goats in The Gambia (microscopy 8%, PCR 24%). To our knowledge, ours is the first study to employ PCR-based methods in a longitudinal survey of trypanosome dynamics in a natural wildlife population.
The seasonal variation in T. microti prevalence fits well with recent observations by Bajer et al. (2001) and Pawelczyk et al. (2004) and corresponds, with a delay, with seasonal variations in flea prevalence. Trypanosome prevalence was positively related to the prevalence of fleas within the population during the preceding 3-month period. Although the regression model selected past flea prevalence at a lag of 3 months, the range over which the cross correlation coefficient between the two time series is significant includes the additional lags of 1 and 2 months. This is consistent with our understanding of T. microti infection, which remains detectable within the host by microscopy for [ges ]70 days (Hoare, 1972), and presumably for some time longer during the decline phase by PCR (Desquesnes and Davila, 2002). Due to the seasonal dynamics of fleas, flea prevalences will be temporally autocorrelated. The problem of distinguishing between correlated explanatory variables in multiple regression is likely to explain why only a lag at 3 months was selected in the GLMM analysis. However, the important point biologically is that the cross-correlation analysis and the GLMM both indicate that trypanosome prevalence is linked to past rather than current flea prevalence.
The probability of trypanosome infection was lowest amongst individuals within the youngest age/weight class (<17 g) and highest amongst individuals in the second and third weight groups (17–24 g and 25–39 g), declining again in the heaviest, or oldest group, representing reproductively mature and overwintered animals. The convex or humped shape of the age-prevalence distribution, referred to as a Type III curve by Hudson and Dobson (1995), may be related to age-dependent changes in host susceptibility, such as behavioural adaptations related to vector avoidance, or an increase in infection-induced host mortality (Hudson and Dobson, 1995). However, considering the low pathogenicity of rodent trypanosomes in general (Hoare, 1972), and the fact that older field voles are more heavily parasitized by fleas and thus more exposed to infection than the younger animals, neither readily explains our observations. Alternatively, a convex age-prevalence curve may be generated when older individuals develop a degree of acquired immunity following infection, as has been observed in mice experimentally infected with T. musculi and T. lewisi (Albright and Albright 1991; Sato et al. 2004). The lowest levels of infection in the youngest cohort may be explained by their low probability of encountering fleas (see above), or possibly due to maternal antibodies acquired during development or through milk from the mother (Brambell, 1958).
The interaction term mass*new/recapture indicates that the probability of trypanosome infection amongst older individuals was higher in the ‘new’ category than those recaptured from a previous session. As recapture rates are high, this is likely to reflect a distinction between residents or territory holders (recaptured), and non-resident or transitory animals that have recently entered the trappable population (new). This suggests either that non-territory holders are more likely to become infected through differences in exposure levels, or that infected animals are less likely to become territory holders than their uninfected counterparts. However, the absence of a mass*new/recapture interaction in the flea prevalence model suggests that resident and transitory animals of similar ages are equally exposed to fleas and hence to the possibility of trypanosome infection. This in turn suggests a possible condition-dependent difference between new and recaptured individuals in their susceptibility to parasitaemia, which may lead to a subtle but potentially important effect of infection on host morbidity (Brown et al. 2000, 2003), exerting an influence on host dynamics that is only detectable at the population level.
We would like to thank Bill Burlton (Forestry Commission) for permission to work within Kielder Forest; Gill Telford, Sarah Helyar, Laura Taylor and David Carslake for help with fieldwork; Kevin Bown and Chris McCracken for help in the laboratory and Xavier Lambin for advice. This work was carried out under Home Office Project Licence no. 40/1813 with the aid of a grant from the Natural Environmental Research Council (NERC) and a NERC studentship to A.S.
References
REFERENCES
Agrell, J.,
Erlinge, S.,
Nelson, J. and
Sandell, M. (
1996).
Shifting spacing behaviour of male field voles (Microtus agrestis) over the reproductive season.
Annales Zoologici Fennici
33,
243–248.Google Scholar
Albright, J. W. and
Albright, J. F. (
1991).
Rodent trypanosomes: Their conflict with the immune system of the host.
Parasitology Today
7,
137–140.CrossRefGoogle Scholar
Bajer, A.,
Pawelczyk, A.,
Behnke, J. M.,
Gilbert, F. S. and
Sinski, E. (
2001).
Factors affecting the component community structure of haemoparasites in bank voles (Clethrionomys glareolus) from the Mazury Lake District region of Poland.
Parasitology
122,
43–54.CrossRefGoogle Scholar
Barrett, M. P.,
Burchmore, R. J. S.,
Stich, A.,
Lazzari, J. O.,
Frasch, A. C.,
Cazzulo, J. J. and
Krishna, S. (
2003).
The trypanosomiases.
Lancet
362,
1469–1480.CrossRefGoogle Scholar
Borowski, Z. (
2003).
Habitat selection and home range size of field voles Microtus agrestis in Slowinski National Park, Poland.
Acta Theriologica
48,
325–333.CrossRefGoogle Scholar
Bown, K. J.,
Begon, M.,
Bennett, M.,
Woldehiwet, Z. and
Ogden, N. H. (
2003).
Seasonal dynamics of Anaplasma phagocytophila in a rodent-tick (Ixodes trianguliceps) system, United Kingdom.
Emerging Infectious Diseases
9,
63–70.CrossRefGoogle Scholar
Brambell, F. W. R. (
1958).
The passive immunity of the young mammal.
Biological Reviews of the Cambridge Philosophical Society
33,
488–531.CrossRefGoogle Scholar
Brown, M. J. F.,
Loosli, R. and
Schmid-Hempel, P. (
2000).
Condition-dependent expression of virulence in a trypanosome infecting bumblebees.
Oikos
91,
421–427.CrossRefGoogle Scholar
Brown, M. J. F.,
Schmid-Hempel, R. and
Schmid-Hempel, P. (
2003).
Strong context-dependent virulence in a host-parasite system: reconciling genetic evidence with theory.
Journal of Animal Ecology
72
994–1002.CrossRefGoogle Scholar
Burnham, K. P. and
Anderson, D. R. (
2002).
Model Selection and Multi-model Inference: A Practical Information-Theoretic Approach,
Springer Verlag,
Berlin.
Burnham, K. P.,
White, G. C. and
Anderson, D. R. (
1995).
Model selection strategy in the analysis of capture-recapture data.
Biometrics
51,
888–898.CrossRefGoogle Scholar
Bursten, S. N.,
Kimsey, R. B. and
Owings, D. H. (
1997).
Ranging of male Oropsylla montana fleas via male California ground squirrel (Spermophilus beecheyi) juveniles.
Journal of Parasitology
83,
804–809.CrossRefGoogle Scholar
Cavanagh, R. D. (
2001).
Interactions between population dynamics, body condition and infectious diseases (Cowpox virus and Mycobacterium microti of wild rodents). Ph.D. thesis, University of Liverpool.
Cavanagh, R. D.,
Lambin, X,
Ergon, T.,
Bennett, M.,
Graham, I. M.,
Van Soolingen, D. and
Begon, M. (
2004).
Disease dynamics in cyclic populations of field voles (Microtus agrestis): cowpox virus and vole tuberculosis (Mycobacterium microti).
Proceedings of the Royal Society of London, B
271,
859–867.CrossRefGoogle Scholar
Daszak, P.,
Cunningham, A. and
Hyatt, A. D. (
2000).
Wildlife ecology – emerging infectious diseases of wildlife – threats to biodiversity and human health.
Science
287,
443–449.CrossRefGoogle Scholar
De almeida, P.,
Ndao, M.,
Goossens, B. and
Osaer, S. (
1998).
PCR primer evaluation for the detection of trypanosome DNA in naturally infected goats.
Veterinary Parasitology
80,
111–116.CrossRefGoogle Scholar
Deerenberg, C.,
Arpanius, V.,
Daan, S. and
Bos, N. (
1997).
Reproductive effort decreases antibody responsiveness.
Proceedings of the Royal Society of London, B
264,
1021–1029.CrossRefGoogle Scholar
Desquesnes, M. and
Davila, A. M. R. (
2002).
Applications of PCR-based tools for detection and identification of animal trypanosomes: a review and perspectives.
Veterinary Parasitology
109,
213–231.CrossRefGoogle Scholar
Healing, T. D. (
1981).
Infections with blood parasites in the small British rodents Apodemus sylvaticus, Clethrionomys glareolus and Microtus agrestis.
Parasitology
83,
179–189.CrossRefGoogle Scholar
Hoare, C. A. (
1972).
The Trypanosomes of Mammals: a Zoological Monograph.
Blackwell Scientific Publications,
Oxford.
Hudson, P. J. and
Dobson, A. P. (
1995).
Macroparasites: observed patterns. In
Ecology of Infectious Diseases in Natural Populations (
ed. Grenfell, B. T. and Dobson, A. P.), pp.
114–176.
Cambridge University Press,
Cambridge.CrossRef
Johnson, J. B. and
Omland, K. S. (
2004).
Model selection in ecology and evolution.
Trends in Ecology and Evolution
19,
101–108.CrossRefGoogle Scholar
Khansari, D. N.,
Murgo, A. J. and
Faith, R. E. (
1990).
Effects of stress on the immune system.
Immunology Today
11,
170–175.CrossRefGoogle Scholar
Klein, S. L. and
Nelson, R. J. (
1999).
Influence of social factors on immune function and reproduction.
Reviews of Reproduction
4,
168–178.CrossRefGoogle Scholar
Krasnov, B.,
Khokhlova, I. and
Shenbrot, G. (
2002).
The effect of host density on ectoparasite distribution: An example of a rodent parasitized by fleas.
Ecology
83,
164–175.CrossRefGoogle Scholar
Krebs, C. J. (
1966).
Demographic changes in fluctuating populations of Microtus californicus.
Ecological Monographs
36,
240–273.CrossRefGoogle Scholar
Lambin, X.,
Petty, S. J. and
MacKinnon, J. L. (
2000).
Cyclic dynamics in field vole populations and generalist predation.
Journal of Animal Ecology
69,
106–118.CrossRefGoogle Scholar
Lang, J. D. (
1996).
Factors effecting the seasonal abundance of ground squirrel and wood rat fleas (Siphonaptera) in San Diego County, California.
Journal of Medical Entomology
33,
790–804.CrossRefGoogle Scholar
Lehmann, T. (
1992).
Reproductive activity of Synosternus cleopatrae (Siphonaptera, Pulicidae) in relation to host factors.
Journal of Medical Entomology
29,
946–952.CrossRefGoogle Scholar
Littell, R. C.,
Milliken, G. A.,
Srtoup, W. W. and
Wolfinger, R. D. (
1996).
SAS System for Mixed Models.
SAS Institute InC.,
Cary, NC.
Lundqvist, L. (
1988).
Reproductive strategies of ectoparasites on small mammals.
Canadian Journal of Zoology-Revue Canadienne De Zoologie
66,
774–781.CrossRefGoogle Scholar
Masiga, D. K.,
Smyth, A. J.,
Hayes, P.,
Bromidge, T. J. and
Gibson, W. C. (
1992).
Sensitive detection of trypanosomes in tsetse flies by DNA amplification.
International Journal for Parasitology
22,
909–918.CrossRefGoogle Scholar
Molyneux, D. H. (
1968).
Trypanosomes of Microtus agrestis and Clethrionomys glareolus.
Parasitology
58,
6.Google Scholar
Molyneux, D. H. (
1969).
Morphology and life history of Trypanosoma (Herpetosoma) microti of field vole, Microtus agrestis.
Annals of Tropical Medicine and Parasitology
63,
229–244.CrossRefGoogle Scholar
Morales-Montor, J.,
Chavarria, A.,
De Leon, M. A.,
Del Castillo, L. I.,
Escobedo, E. G.,
Sanchez, E. N.,
Vargas, J. A.,
Hernandez-Flores, M.,
Romo-Gonzalez, T. and
Larralde, C. (
2004).
Host gender in parasitic infections of mammals: An evaluation of the female host supremacy paradigm.
Journal of Parasitology
90,
531–546.CrossRefGoogle Scholar
Morner, T. D.,
Obendorf, L.,
Artois, M. and
Woodford, M. H. (
2002).
Surveillance and monitoring of wildlife diseases.
Revue Scientifique et Technique de L' Office International des Epizooties
21,
67–76.CrossRefGoogle Scholar
Myllymaki, A. (
1977).
Intraspecific competition and home range dynamics in field vole Microtus agrestis.
Oikos
29,
553–569.CrossRefGoogle Scholar
Noyes, H. A.,
Ambrose, P.,
Barker, F.,
Begon, M.,
Bennet, M.,
Bown, K. J. and
Kemp, S. J. (
2002).
Host specificity of Trypanosoma (Herpetosoma) species: evidence that bank voles (Clethrionomys glareolus) carry only one T. (H.) evotomys 18S rRNA genotype but wood mice (Apodemus sylvaticus) carry at least two polyphyletic parasites.
Parasitology
124,
185–190.Google Scholar
Noyes, H. A.,
Stevens, J. R.,
Teixeira, M.,
Phelan, J. and
Holz, P. (
1999).
A nested PCR for the ssrRNA gene detects Trypanosoma binneyi in the platypus and Trypanosoma sp. in wombats and kangaroos in Australia.
International Journal for Parasitology
29,
331–339.CrossRefGoogle Scholar
Noyes, H. A.,
Stevens, J. R.,
Teixeira, M.,
Phelan, J. and
Holz, P. (
2000).
A nested PCR for the ssrRNA gene detects Trypanosoma binneyi in the platypus and Trypanosoma sp. in wombats and kangaroos in Australia.
International Journal for Parasitology
30,
228–228.CrossRefGoogle Scholar
Otis, D. L.,
Burnham, K. P.,
White, G. C. and
Anderson, D. R. (
1978).
Statistical inference from capture data on closed animal populations.
Wildlife Monographs
62,
7–135.Google Scholar
Paterson, S. and
Lello, J. (
2003).
Mixed models: getting the best use of parasitological data.
Trends in Parasitology
19,
370–375.CrossRefGoogle Scholar
Pawelczyk, A.,
Bajer, A.,
Behnke, J. M.,
Gilbert, F. S. and
Sinski, E. (
2004).
Factors affecting the component community structure of haemoparasites in common voles (Microtus arvalis) from the Mazury Lake District region of Poland.
Parasitology Research
92,
270–284.CrossRefGoogle Scholar
Perkins, S. E.,
Cattadori, I. M.,
Tagliapietra, V.,
Rizzoli, A. P. and
Hudson, P. J. (
2003).
Empirical evidence for key hosts in persistence of a tick-borne disease.
International Journal for Parasitology
33,
909–917.CrossRefGoogle Scholar
Pollock, K. H. (
1982).
A capture-recapture design robust to unequal probability of capture.
Journal of Wildlife Management
46,
752–757.CrossRefGoogle Scholar
Poulin, R. (
1996).
Sexual inequalities in helminth infections: A cost of being a male?
American Naturalist
147,
287–295.Google Scholar
Pusenius, J. and
Viitala, J. (
1993).
Varying spacing behaviour of field voles, Microtus agrestis.
Annales Zoologici Fennici
30,
143–152.Google Scholar
Reich, L. M.,
Wood, K. M.,
Rothstein, B. E. and
Tamarin, R. H. (
1982).
Aggressive behaviour of male Microtus breweri and its demographic implications.
Animal Behaviour
30,
117–122.CrossRefGoogle Scholar
Robbins, R. G. and
Faulkenberry, G. D. (
1982).
A population model for fleas of the grey tailed vole, Microtus canicaudus Miller.
Entomological News
93,
70–74.Google Scholar
Saino, N.,
Canova, L.,
Fasola, M. and
Martinelli, R. (
2000).
Reproduction and population density affect humoral immunity in bank voles under field experimental conditions.
Oecologia
124,
358–366.CrossRefGoogle Scholar
SAS/STAT (
1992).
SAS/STAT Users Guide. Version 6, Fourth Edition.
SAS Institute,
Cary, North Carolina,
USA.
Sato, H.,
Ishita, K.,
Osanai, A.,
Yagisawa, M.,
Kamiya, H. and
Ito, M. (
2004).
T cell dependent elimination of dividing Trypanosoma grosi from the bloodstream Mongolian jirds.
Parasitology
128,
295–304.CrossRefGoogle Scholar
Shaw, D. J. and
Dobson, A. P. (
1995).
Patterns of macroparasite abundance and aggregation in wildlife populations: a quantitative review.
Parasitology
111 (Suppl.)
S111–S133.CrossRefGoogle Scholar
Solano, P.,
Michel, J. F.,
Lefrancois, T.,
De la Rocque, S.,
Sidibe, I.,
Zoungrana, A. and
Cuisance, D. (
1999).
Polymerase chain reaction as a diagnosis tool for detecting trypanosomes in naturally infected cattle in Burkina Faso.
Veterinary Parasitology
86,
95–103.CrossRefGoogle Scholar
Stanko, M.,
Miklisova, D.,
De Bellocq, J. G. and
Morand, S. (
2002).
Mammal density and patterns of ectoparasite species richness and abundance.
Oecologia
131,
289–295.CrossRefGoogle Scholar
Stark, H. E. (
2002).
Population dynamics of adult fleas (Siphonaptera) on hosts and in nests of the California vole.
Journal of Medical Entomology
39,
818–824.CrossRefGoogle Scholar
Taylor, G. T.,
Haller, J.,
Rupich, R. and
Weiss, J. (
1984).
Testicular hormones and intermale aggressive behaviour in the presence of a female rat.
Journal of Endocrinology
100,
315–321.CrossRefGoogle Scholar
Tschirren, B.,
Fitze, P. S. and
Richner, H. (
2003).
Sexual dimorphism in susceptibility to parasites and cell- mediated immunity in great tit nestlings.
Journal of Animal Ecology
72,
839–845.CrossRefGoogle Scholar
Turchin, P. (
2003).
Complex Population Dynamics: A Theoretical Synthesis.
Princeton University Press,
Princeton, New Jersey.
Turner, C. M. R. (
1986).
Seasonal and age distributions of Babesia, Hepatozoon, Trypanosoma and Grahamella species in Clethrionomys glareolus and Apodemus sylvaticus populations.
Parasitology
93,
279–289.CrossRefGoogle Scholar
Wiger, R. (
1977).
Some pathological effects of endoparasites on rodents with special reference to population ecology of microtines.
Oikos
29,
598–606.CrossRefGoogle Scholar
Williams, E. S.,
Yuill, T.,
Artois, M.,
Fischer, J. and
Haigh, S. A. (
2002).
Emerging infectious diseases in wildlife.
Revue Scientifique et Technique de L' Office International des Epizooties
21,
139–157.CrossRefGoogle Scholar
Wita, I.,
Karbowiak, G. and
Czaplinska, U. (
2003).
Trypanosoma (Herpetosoma) microti Laveran et Pettit, 1909 in the social vole, Microtus socialis (Pallas, 1771) from Ukraine.
Acta Parasitologica
48,
155–162.Google Scholar
Woolhouse, M. E. J.,
Dye, C.,
Etard, J. F.,
Smith, T.,
Charlwood, J. D.,
Garnett, G. P.,
Hagan, P.,
Hii, J. L. K.,
Ndhlovu, P. D.,
Quinnell, R. J.,
Watts, C. H.,
Chandiwana, S. K. and
Anderson, R. M. (
1997).
Heterogeneities in the transmission of infectious agents: implications for the design of control programs.
Proceedings of the National Academy of Sciences, USA
94,
338–342.CrossRefGoogle Scholar
Zuk, M. and
McKean, K. A. (
1996).
Sex differences in parasite infections: Patterns and processes.
International Journal for Parasitology
26,
1009–1023.CrossRefGoogle Scholar

Table 1. Summary of the number of individuals caught by sex and site

Fig. 1. Temporal variation in Microtus agrestis population density/ha (±S.E.) (A and D), flea prevalence (B and E) and trypanosome prevalence (C and F) on trapping grids KCS and PLJ respectively from March 2002 to March 2004.
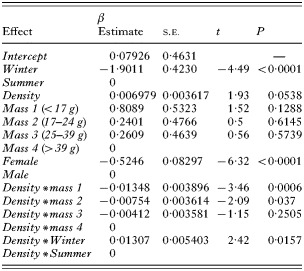
Table 2. Parameter estimates on a logit-scale for the final flea prevalence GLMM model
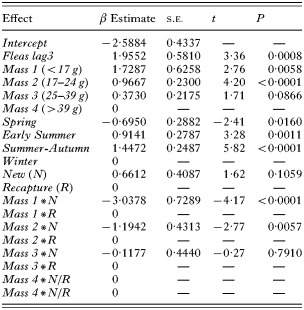
Table 3. Parameter estimates on a logit scale for the final trypanosome GLMM model

Fig. 2. Predicted probabilities of flea occurrence for males from all 4 mass classes (1=smallest, 4=largest). Plotted values are derived from reverse transformed linear predictors previously estimated from the model output in Table 2. Probabilities vary according to the interactions between mass*density and season*density but are shown here in terms of ‘summer’ and ‘winter’ over a realistic range of density estimates for the appropriate season. Estimates for females show a similar relationship but with approximately 11% lower overall values. Dotted lines represent 95% CI associated with estimates for mass groups 1 and 4.

Fig. 3. (A) Probability of trypanosome infection for new and recaptured field voles within each mass group estimated during autumn (season 3), when infection prevalence is highest, as predicted by the best-fit model in Table 3. (B) An alternative model without the new/recapture*mass interaction to emphasize the convex shape of the age-prevalence distribution.

Fig. 4. Probability of trypanosome infection within each of the 4-seasonal categories predicted for new animals in mass class 2.

Fig. 5. Cross-correlation between flea prevalence and trypanosome prevalence up to lag-7. Positive coefficients suggest trypanosome prevalence was high 1–3 months following high flea levels. Negative values indicate low levels of trypanosome infection 3–5 months before high levels of flea prevalence. Confidence limits are set at 2 standard errors.
 You have
Access
- 39
- Cited by