INTRODUCTION
Salmon aquaculture plays a major role in the Scottish economy, providing an important source of employment in rural areas and a major export commodity. Scottish salmon has a worldwide retail value of over £1 billion (Scottish Salmon Producers Organization, 2014). Fish are reared in sea cages from smolt (~1-year post-hatch and 60–100 g), for up to 18 months to achieve market size of 3–5 kg. During this period, they are vulnerable to waterborne environmental threats, including plankton such as medusozoan jellyfish, which have at times caused considerable economic losses up to and including 100% mortality at a farm (e.g. Doyle et al., Reference Doyle, De Haas, Cotton, Dorschel, Cummins, Houghton, Hays and Davenport2008).
Sudden appearances of jellyfish in perceived high densities are referred to as blooms. (While no formal definition of a bloom exists across all taxa of jellyfish, the visual perception of an unusually large aggregation of individuals often attracts the term, e.g. Graham et al., Reference Graham, Pagès and Hamner2001 and Condon et al., Reference Condon, Duarte, Pitt, Robinson, Lucas, Sutherland, Mianzan, Bogeberg, Purcelle, Decker, Uye, Madin, Brodeur, Haddock, Malej, Parry, Eriksen, Quinones, Acha, Harvey, Arthur and Graham2013.) Historically, dense blooms of large-bodied scyphozoan jellyfish have been recognized as causing harm in aquaculture by physical crushing, localized anoxia, and stinging by venomous nematocysts (Doyle et al., Reference Doyle, De Haas, Cotton, Dorschel, Cummins, Houghton, Hays and Davenport2008; Baxter et al., Reference Baxter, Rodger, McAllen and Doyle2011a; Mitchell et al., Reference Mitchell, Baxter and Rodger2011). The effects of smaller hydromedusan jellyfish are less well-recognized, in part because their small body size (often between 0.5–10 mm) and lack of pigmentation allows them to be easily overlooked by lay workers. As a result, very few incidents which could be termed ‘hydrozoan blooms’ have been adequately studied or even recorded. A review of the literature surrounding salmon farms’ interactions with hydrozoan jellyfish reveals that most investigations are retrospective rather than prospective in nature – that is, a dramatic major mortality event or visually obvious bloom prompts an investigation after the fact (e.g. Bruno & Ellis, Reference Bruno and Ellis1985; Seaton, Reference Seaton1989; Doyle et al., Reference Doyle, De Haas, Cotton, Dorschel, Cummins, Houghton, Hays and Davenport2008; Tørud & Håstein, Reference Tørud and Håstein2008). A notable exception considered hydrozoan populations in western Ireland, and suggested a probable association between summertime hydrozoan populations and gill disease in farmed salmon (Baxter et al., Reference Baxter, Rodger, McAllen and Doyle2011a); however, it did so at a spatially and temporally broad resolution by examining two sites fortnightly, and did not identify environmental triggers for blooms. Overall, the typical retrospective approach has limited information in two key ways. First, the present understanding of physical and biotic factors which may contribute to blooms is insufficient to develop prediction or mitigation strategies. Second, with only high-profile acute mortality incidents having been investigated, any sub-lethal consequences of bloom exposure remain unknown. Possibly as a result, fish health issues related to jellyfish blooms – particularly the less visually obvious hydrozoan species – are under-researched compared with day-to-day health hazards such as sea lice and communicable microbial pathogens.
This study used weekly, geographically nested, and targeted population sampling of planktonic hydrozoans at four salmon aquaculture facilities across the Scottish north-west coast in order to seek links with environmental conditions in the periods prior to blooms, and links with gill health and fish welfare in the period following a bloom.
MATERIALS AND METHODS
Locations
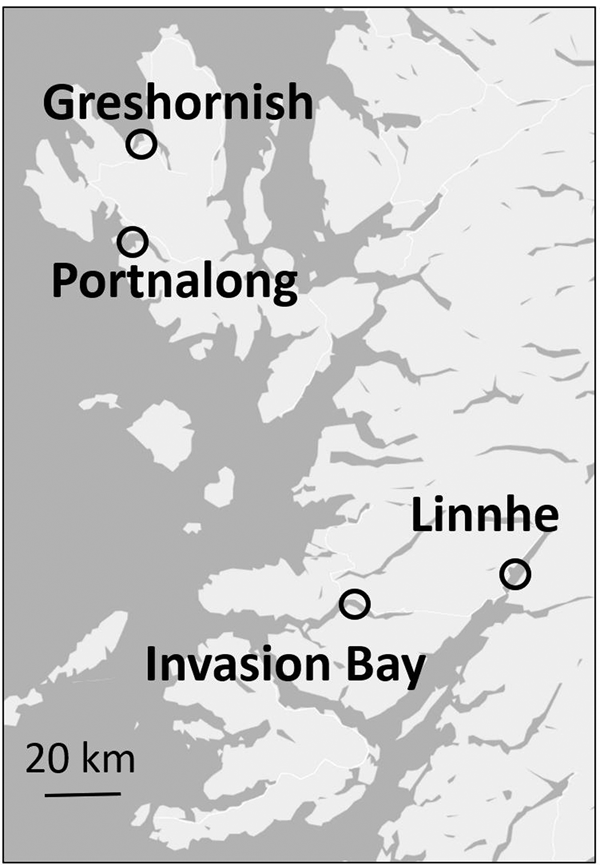
Four salmon aquaculture sites owned by Marine Harvest Ltd were sampled over a 3-year period. Portnalong and Greshornish are two west-facing sites on the Isle of Skye, comparatively exposed to the broad stretch of open water in the Minch, while Linnhe and Invasion Bay are sited within narrow sea lochs in Lochaber (Figure 1). All sites consisted of between 12 and 22 sea cages of 32 m diameter surrounded by floating walkway structures, with 4 cm mesh net pens sinking to 11–18 m depth. Nets were cleaned by farm staff on a bi-weekly basis using an automated washer to remove fouling communities. Floating structures such as walkways and feeding infrastructure were cleaned as necessary, normally on a 2- to 4-year basis. Farms were on a production cycle of 17–21 months, with 14–18 months given over to raising salmon from smolt to harvest weight (normally 3–4 kg), and 3 months given over to a fallow period during which site maintenance was carried out. The study period included observations during both active and fallow periods.
Map of study sites (UK Ordnance Survey 2015).

Hydrozoan sampling methods
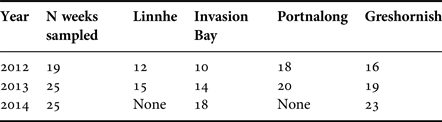
Plankton tows were conducted at each farm using a 0.5 m ring net plankton tow with a 270 µm mesh cod end with sinker, to collect a 5 m vertical towed sample. Using the formula V water towed = πr 2l, where r = net radius and l = the vertical distance towed, each towed sample using this equipment would filter just under 1 m3 seawater. Triplicate vertical tows were conducted from the seaward side of sea cage sites, ~10 m away from net pens, on a weekly summertime basis and a monthly wintertime basis (Table 1). Samples were then pooled and placed in seawater with 4% buffered formalin. All hydrozoan plankton were identified, counted and recorded per cubic metre seawater (denoted hereafter as jm−3) (Russell 1953; Conway 2012). Individual siphonophore segments, almost exclusively from Muggiaea atlantica pelagic colonies, were also included in this count. Because these appeared as polygastric and eudoxid segments rather than as linked colonies, these were quantified as n segments and counted as single units (Cornelius et al., Reference Cornelius, Barnes and Crothers1995).
Weekly sample coverage during the survey period.

A total of 165 dates were sampled with triplicate tows collected on each date.
Sampling in 2012 commenced 11 June and was carried out until 19 October, spanning weeks 24–42 for a total of 19 weeks. Sampling in 2013 began on 1 May and continued to 18 October (25 weeks). In 2014, only Greshornish and Invasion Bay participated regularly. Greshornish conducted sampling from 19 May to 6 October; Invasion Bay sampled from 5 May to 29 September. Table 1 gives details of sampling coverage of the 165 dates sampled in total. Missed or incorrectly preserved samples were occasionally grouped in 2- to 3-week periods, causing gaps in time-series data. Monthly winter sampling was conducted with good compliance, though only extremely low cnidarian population density was in evidence during these periods.
Health monitoring methods
Mortality rates of salmon were estimated on a weekly basis as a percentage by collection of dead fish from pens, with a low level of 0.005% population mortality as baseline expectation. Specific monitoring of gill health at each site was implemented beginning in late July and early August 2012. Five to 10 fish were randomly selected from each pen on site using a dip net and anaesthetized using MS-222. Gills were examined by eye, and a small lamellar scraping transferred to a slide for microscopy. Healthy fish were returned live to the pen; moribund fish were euthanized. Proliferative gill disease (PGD) and amoebic gill disease (AGD) were then assessed and scored based on guidelines laid out in Mitchell et al. (Reference Mitchell, Baxter and Rodger2011), wherein a score of 0 indicates good health and 5 indicates widespread disease across the gills. Incidence and degree of both PGD and AGD were reported on a per fish, per cage, site-by-site basis. When evaluating gill health across the site, scores were converted to a unitless rate of severity by adding the total gill scores observed, then dividing by the number of fish sampled.
Water quality
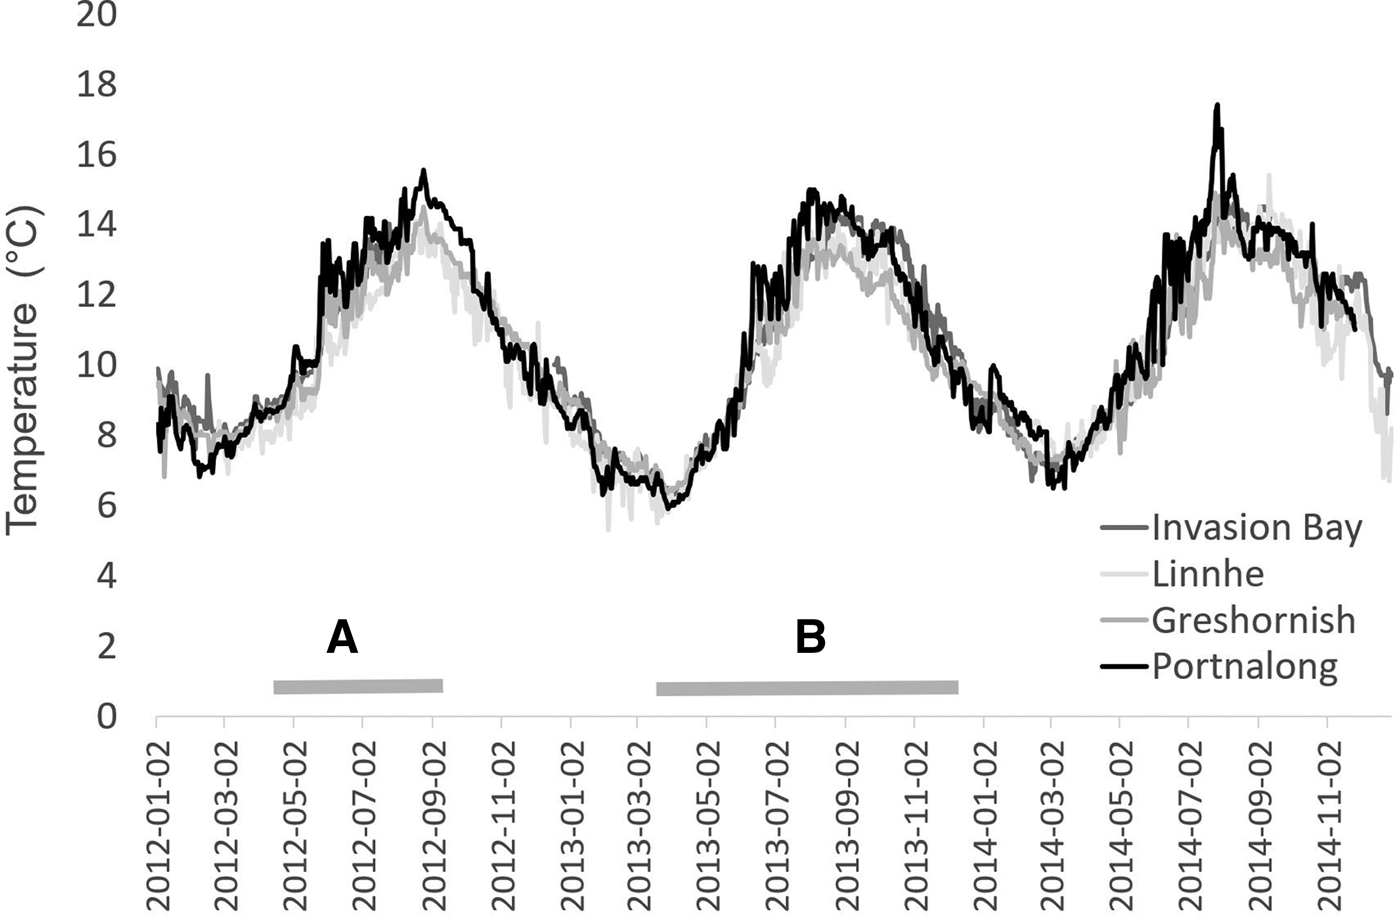
Automated monitoring of conditions at each site was carried out continuously at each site using a YSI EXO2 multi-parameter sonde submerged at 5 m depth at the seaward edge of the sea cage array at each site. Sondes measured temperature, salinity and light penetration (vertical metres to attenuation) during periods of active farming, but were removed during fallow periods. Complete data records were available for the duration of the observation, bar two periods during farm fallowing (Portnalong 28 April 2012–17 October 2012; Greshornish 10 March 2013–15 December 2013). Temperature records during these periods were hindcast, using a regression relationship arising from time periods measured concurrently (T Portnalong = 0.9996 × T Greshornish − 0.2919; P < 0.001, df = 1, r 2 = 0.9373). Temperature fluctuated annually between ~6 °C in winter and 17 °C in summer (Figure 2).
Temperature records (including hindcast values) for all sites. Period A indicates values hindcast at Portnalong; Period B indicates values hindcast at Greshornish.

Primary productivity
Productivity for each site was estimated using ocean colour reflectance data obtained from flyovers by the MODIS-enabled Aqua EOS satellite, downloaded to the NASA Goddard Spaceflight Center and accessed through the University of Strathclyde. Remotely sensed reflectance measures were used to calculate estimated chlorophyll-a concentration values using the standard chlor_a product distributed by Ocean Biology Distributed Active Archive Center (NASA OB.DAAC, 2014).
Statistical analyses
Data were collated and analysed using Microsoft Excel, R and Matlab. Time series of hydrozoan population data were plotted along a time series at each site. Site and regional means were compared using one-way ANOVA. For any log-transformation analyses, raw data were normalized by adding a count of one individual medusa to each data point, then natural-log transforming the values. Autocorrelation in time-series data, and the suitability of their use in linear modelling, was assessed using the Durbin-Watson test statistic. Regression analysis comparing proximate sites Greshornish and Portnalong was used to produce hindcasts of temperature during fallow periods between Greshornish and Portnalong, when the sonde equipment was removed from the water.
RESULTS
Planktonic hydrozoan population density
COMMONLY OCCURRING SPECIES
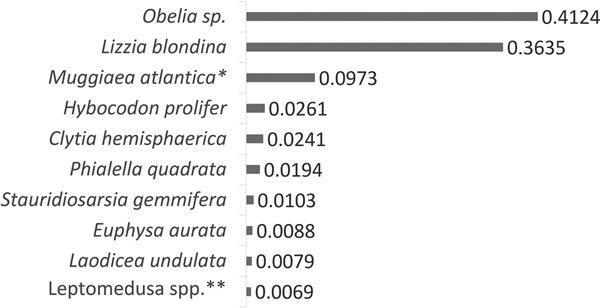
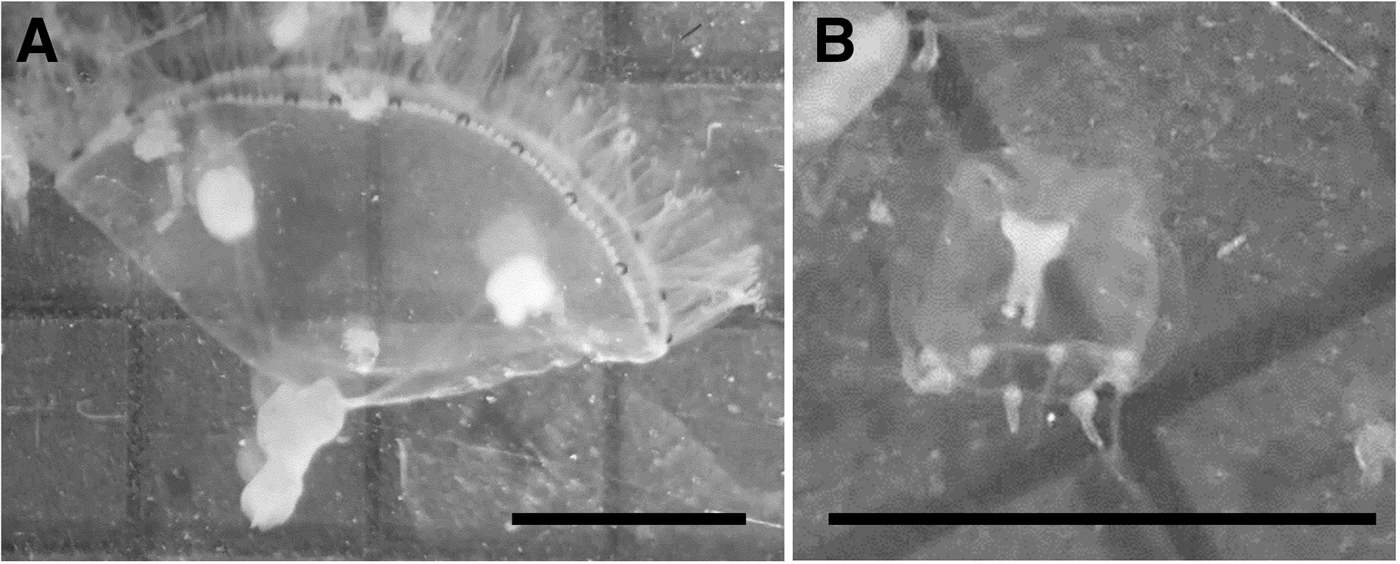
Of the 90+ species of medusa-producing hydrozoans reported in UK waters, 44 identifiable species were found during this survey (Supplementary Table 1). The majority of these species appeared singly or very rarely; two species, Obelia sp.Footnote 1 and Lizzia blondina, stood out as having considerably greater frequency of occurrence (Figures 3 and 4). Combined, these contributed the majority of individuals in the pooled observations.
Relative frequency of 10 most frequently occurring hydromedusan species appearing in the survey (N observations of each species/N total observations). The remaining 34 species found in this study are listed in Supplementary Table S1. *M. atlantica relative frequency reflects number of segments appearing in samples. **Several species of leptomedusa lack identifying features at juvenile stages, and cannot be further classified from preserved specimens. Such individuals are grouped here.

Hydrozoan species occurring most frequently included (A) Obelia sp. medusae, (B) L. blondina medusae. Scale bars show 2 mm.

TIME-SERIES COMPARISONS
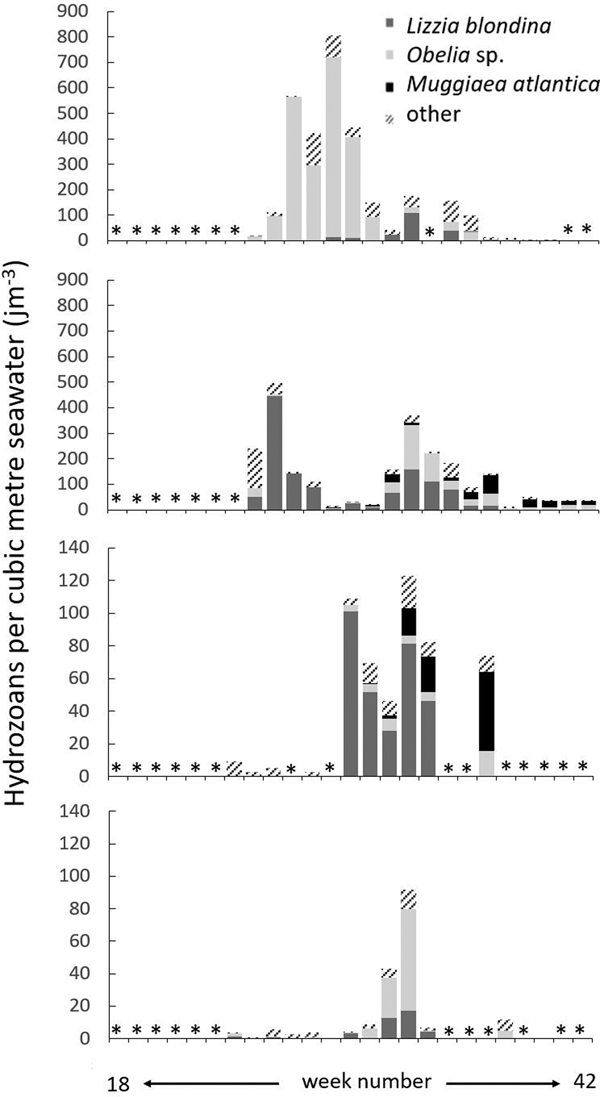
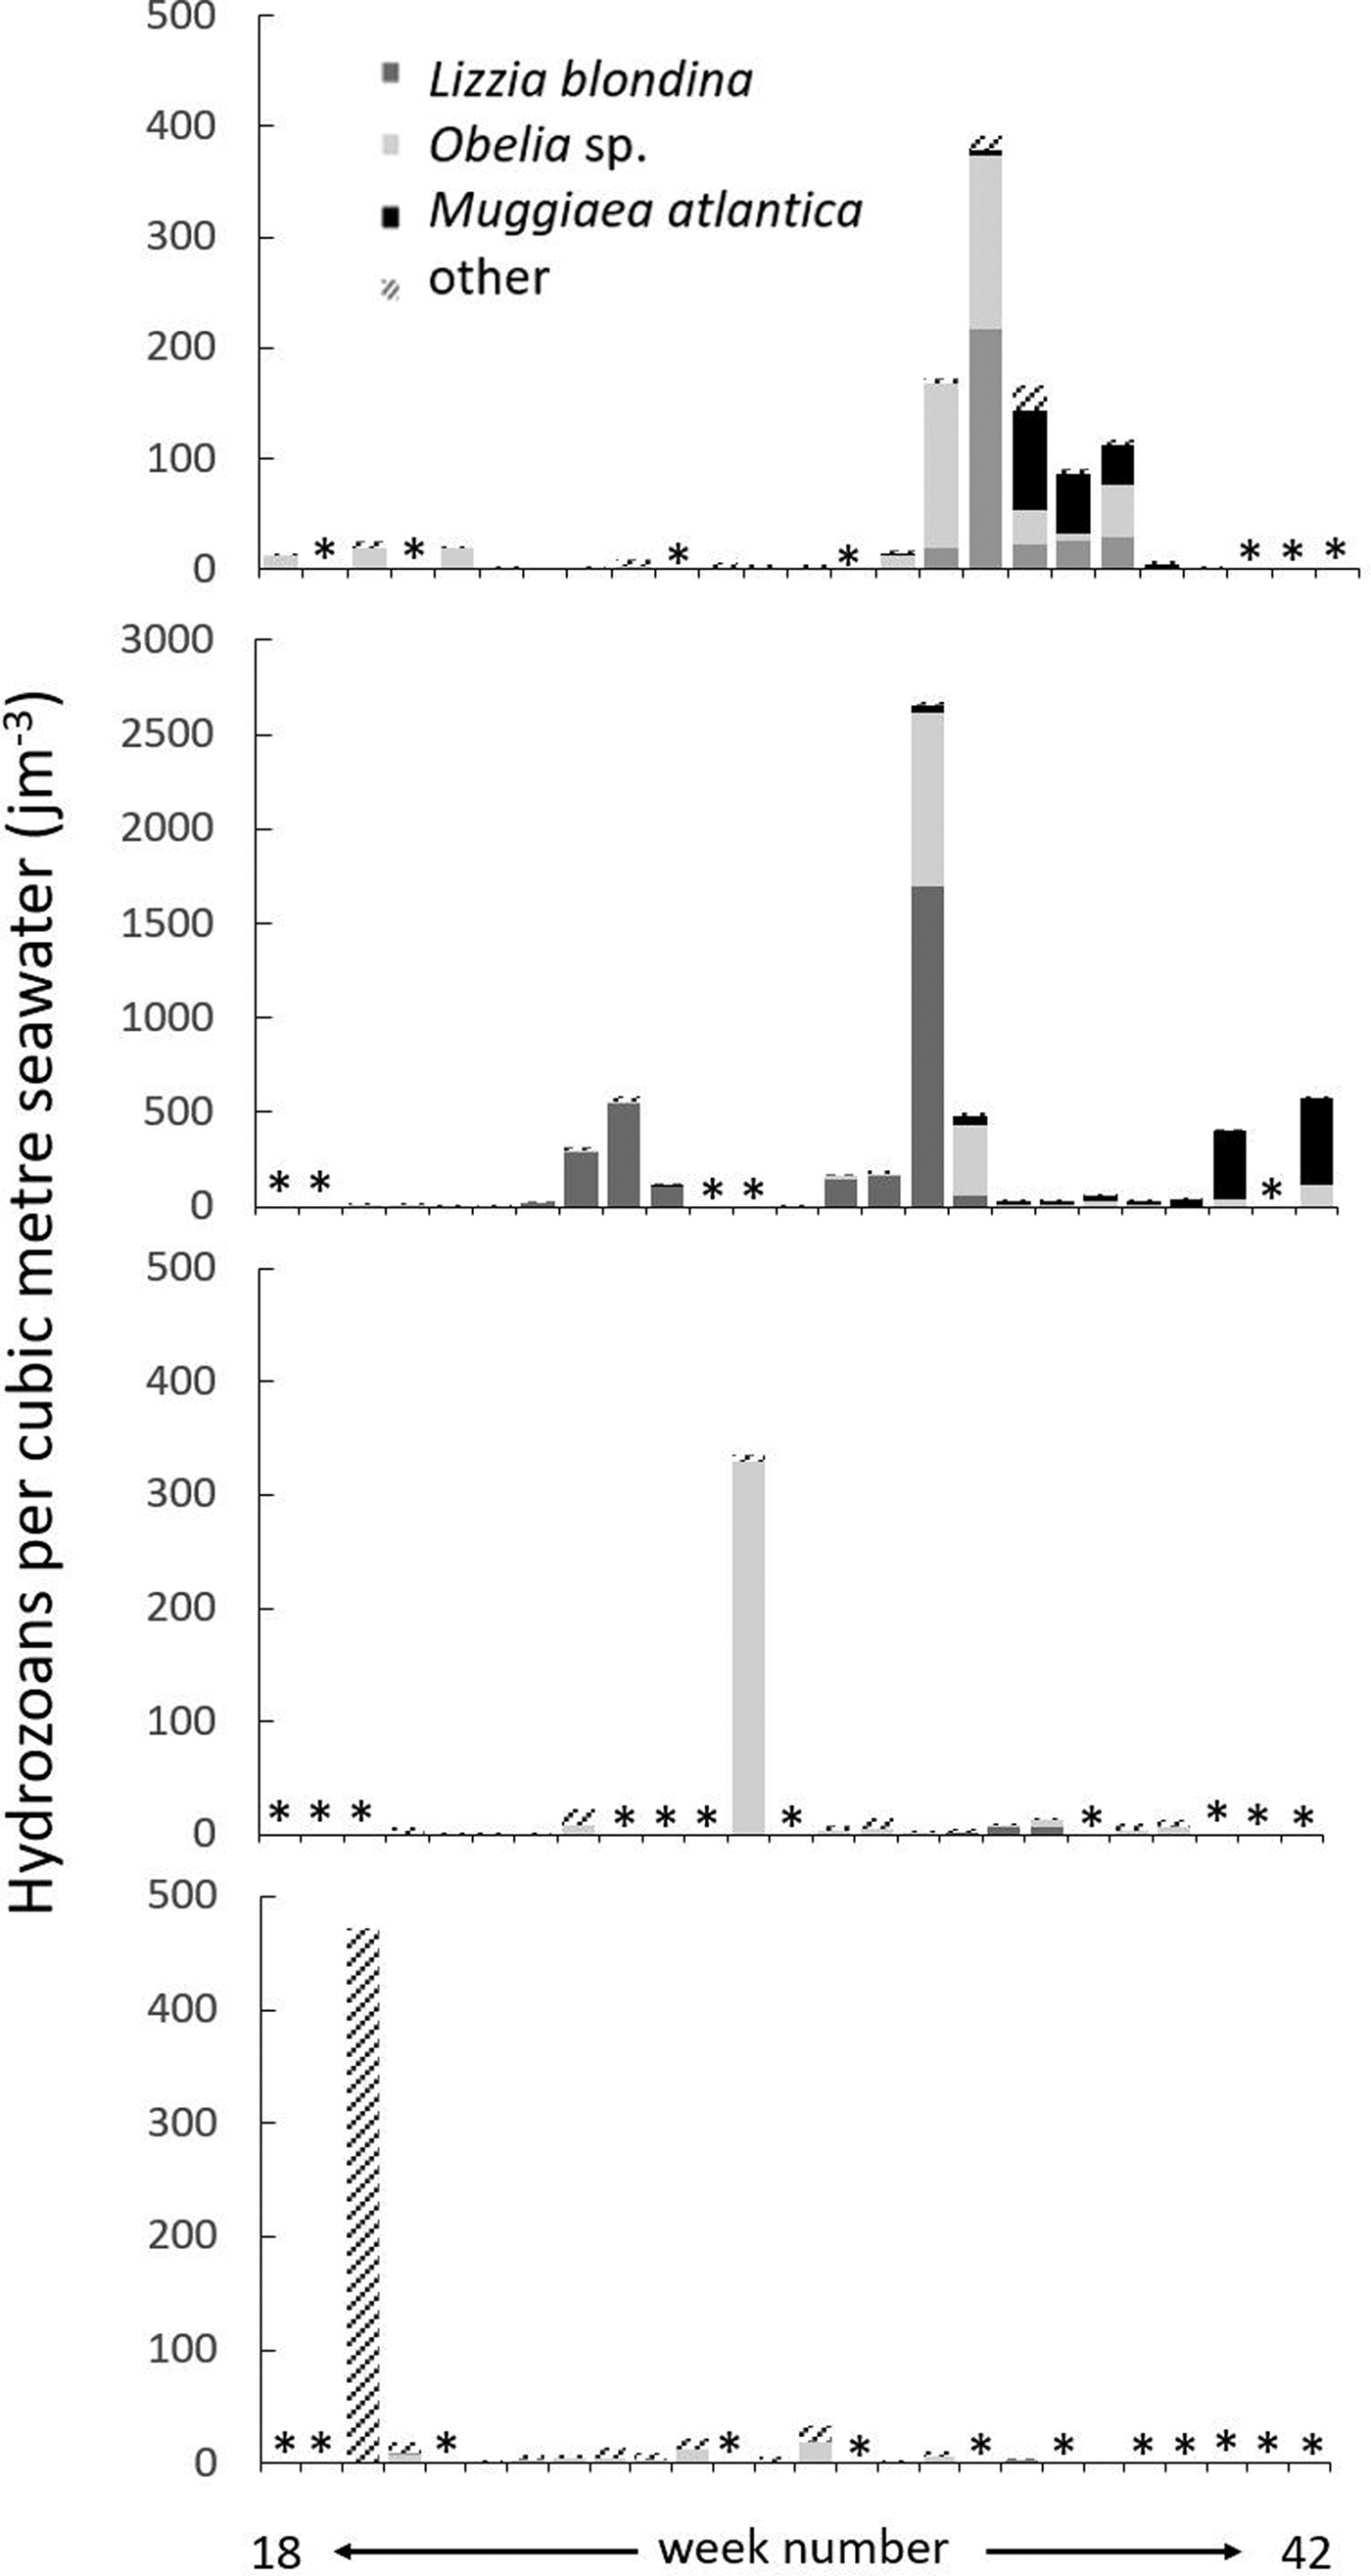
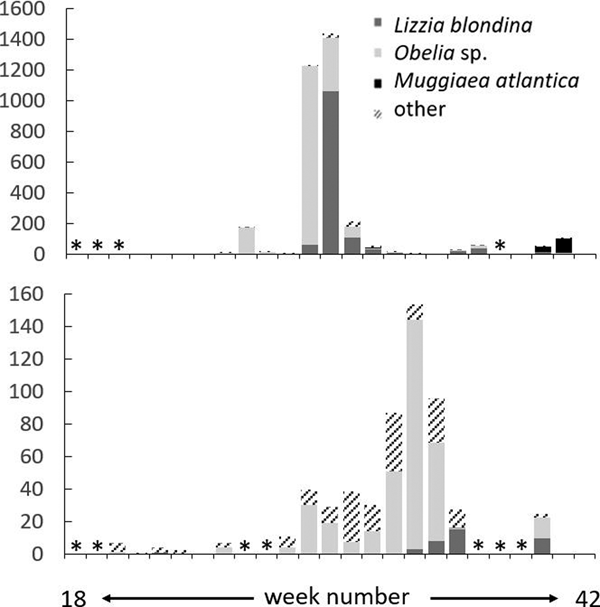
Figures 5–7 show hydrozoan density from 2012–2014 at all sites observed, with taxa of most common occurrence denoted (Obelia sp., L. blondina and M. atlantica). All sites were strikingly different from one another in terms of timing, species and magnitude of spikes and blooms.
Time-series 2012 hydromedusa populations (jm−3 per date), aligned by sampling date, spanning weeks 18–42 (30 April–15 October). From top to bottom: Greshornish, Portnalong (Skye sites); Invasion Bay, Linnhe (mainland sites). Asterisks * denote no sampling on this date. Note that y-axes are not standard between Skye and mainland sites.

Time-series 2013 hydromedusa populations (jm−3 per date), aligned by sampling date, spanning weeks 18–42 (30 April–15 October). From top to bottom: Greshornish, Portnalong (Skye sites); Invasion Bay, Linnhe (mainland sites). Asterisks * denote no sampling on this date. Note that y-axes are not standard.

Time series of 2014 hydromedusa populations (jm−3 per date), aligned by sampling date, spanning weeks 18–42 (30 April–15 October). Top: Greshornish. Bottom: Invasion Bay. Asterisks * denote no sampling on this date. Note that y-axes are not standard.

BLOOM MAGNITUDES AND SPATIAL-TEMPORAL CHARACTERISTICS
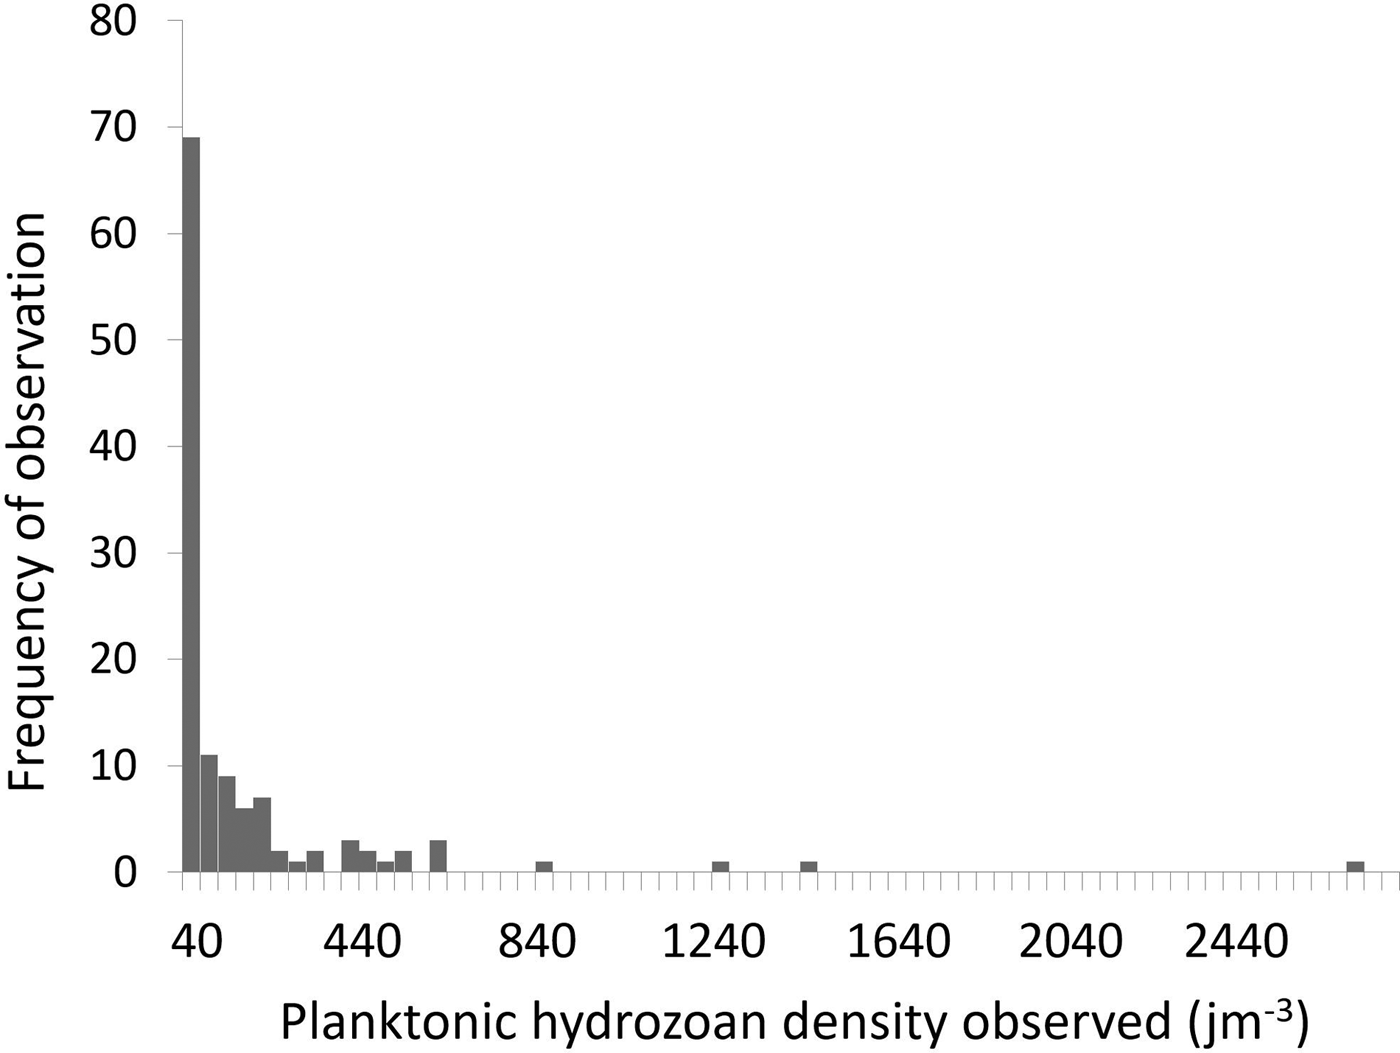
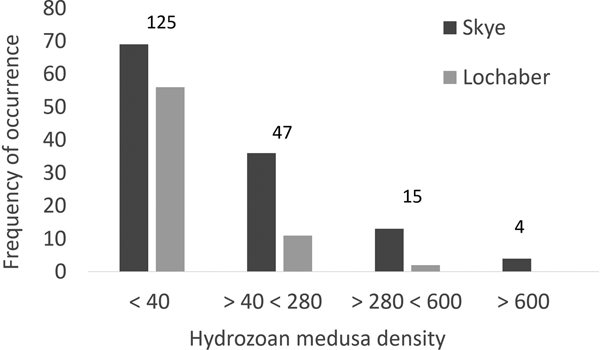
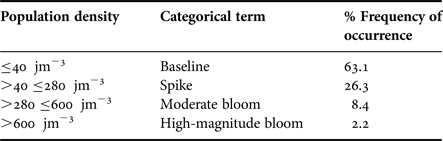
Each of the four sites showed marked fluctuations in planktonic hydrozoan population density over summer periods of weekly observation, with the majority of measures below 40 jm−3 but with values ranging from 0 to nearly 2700 jm−3. Every population density greater than 0.4 jm−3 was observed during weekly summer periods of observation rather than the monthly observations made over winter, and the probability of observing larger populations diminished rapidly by mid-autumn. Population density measures of all species pooled were arbitrarily grouped into four broad categories based on the frequency of occurrence (Figure 8, Table 2). These categories will be used to refer to population sizes. High-density populations were observed significantly more frequently in Skye sites than mainland sites (ANOVA, P = 0.007) (Figure 9). This pattern of population density held true for the three most frequently occurring taxa of Obelia sp. (P < 0.001), L. blondina (P < 0.001) and M. atlantica (P < 0.001). Density across other species summed was not significantly different among sites (P = 0.798).
Observations of varying population density measures, considering all species pooled. Days in which baseline population density was observed were far more common than observations of blooms.

Observations of varying population density measures, considering all species pooled, binned by the categorical divisions described in Table 2. Numbers above columns give the summed totals from both sites. Skye sites showed a significantly greater number of high-density population measures.

Terminology used to describe planktonic hydrozoan population densities observed in this study.

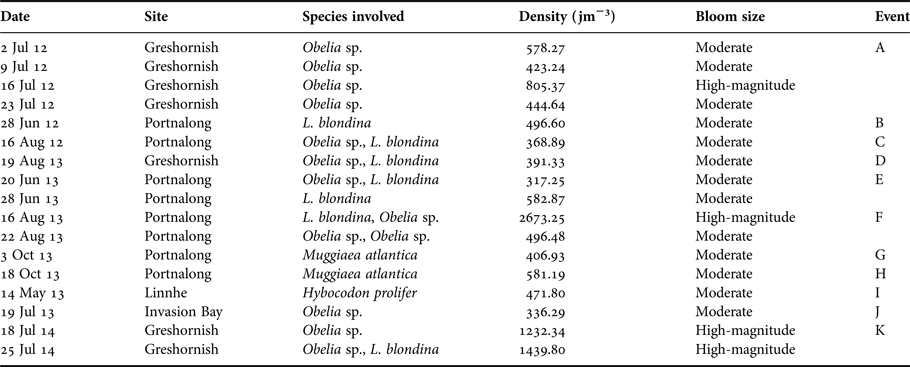
Seventeen instances of moderate or high-magnitude hydrozoan population density were recorded (Table 3). Of these, two were attributable to the presence of segments of M. atlantica, indicating advection of a colony or colonies into the study area. As such, these should not be considered a true bloom in the same manner as understood for other hydrozoan species. Of the remaining 15 instances, one other stands out as particularly unusual: 14 May 2013 at Linnhe showed a bloom by Hybocodon prolifer, a species not seen blooming at any other times during this study, and which is reported elsewhere to be primarily spring-blooming (Costello & Mathieu, Reference Costello and Mathieu1995; Nakayama & Numakunai, Reference Nakayama and Numakunai2000). The remaining 14 instances were attributable to either Obelia sp. (50% incidence), Lizzia blondina (14% incidence), or a co-occurrence of both (36% incidence). All but one of these blooms occurred at Skye sites. Finally, several of these 14 incidents are attributable to an apparently protracted single bloom event spanning several weeks’ observation; these dates are grouped together in Table 3. In total, eight distinct blooms of Obelia sp., L. blondina, or both in combination were recorded.
Record of all moderate and high-magnitude blooms observed during the study period.

Densities reported constitute all observed species combined. Long-duration single events occurring across multiple sampling dates are grouped by letter labels.
Time-series analysis of population density using a Durbin–Watson test showed positive autocorrelation in L. blondina, Obelia sp. and summed population density. This indicates that despite major week-to-week differences in population density, time-series measures are not entirely independent from one another, limiting the potential for linear model analyses using the full dataset. Analysis of only the dates showing moderate to high-magnitude blooms shows no statistically significant positive or negative autocorrelation, meaning these measures do not violate linear modelling assumptions.
Environmental factors prior to and during blooms
TEMPERATURE
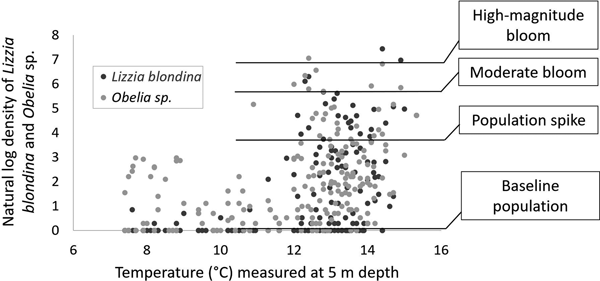
All blooms involving Obelia sp. and/or Lizzia blondina occurred in waters above 12.8 °C measured at 5 m depth (Figure 10). (The single outlying moderate bloom in Figure 10, recorded in water of 8 °C, involved Hybocodon prolifer.) In addition, 94% of population spikes took place in temperatures above 12 °C. Temperatures in the 7 days prior to both moderate and high-magnitude blooms averaged 12.65 °C; during 14 days prior, 12.44 °C; during 28 days prior, 12.20 °C. Temperature records in the 60-day periods prior to Obelia sp. and L. blondina blooms shared some general characteristics: in days 60–30 before blooms commenced, temperatures rose overall; in the 30 days prior to all except bloom J (Table 3), temperatures fluctuated around a mean of 12 °C or above.
Natural log of hydromedusan population density measured at sea surface temperature as measured at 5 m depth, with population magnitudes demarcated. Lizzia blondina and Obelia sp. medusae are most likely to occur in both spike and bloom-level population density measures in water greater than 12 °C.

PHOTOPERIOD
Most blooms took place in late summer, with photoperiod in the 7 days prior to bloom measures averaging 963 min (σ ± 136.4). In practice, this translated to the bloom season closing around mid to late September. One outlier was observed in Portnalong in 2013 in mid-October (Figure 6).
SALINITY AND WATER CLARITY
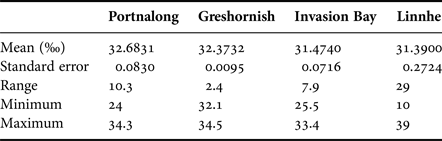
Salinity measures varied independently between sites, with considerable fluctuations likely reflecting localized rainfall and runoff events (Table 4) (Park & Rennilson, Reference Park and Rennilson2002). Due to sonde equipment removal during fallowing, the summer period in 2013 at Greshornish was not monitored. Regression analysis based on Portnalong values could not produce a reliable record of values for either salinity or clarity. These limitations meant that only blooms E, F, I and J (Table 3) could be associated with salinity and clarity data.
Salinity observations at all four sites, showing comparable mean salinity with large fluctuations occurring at some sites, particularly Linnhe.

Bloom occurrence
Blooms took place in salinity conditions ranging from 31–35, with no discernible association between rapid changes or trends in salinity and bloom occurrence. While salinity did vary considerably from site to site, this variability did not map to geographic occurrence of blooms: the site with the greatest range of salinity, Linnhe, had the least frequent incidence of blooms; meanwhile, the site with the second-greatest range of salinity measures, Portnalong, had the most frequent incidence of blooms (Table 4). Nor could any common pattern in the 30 or 60 day periods prior to blooms be discerned.
PRIMARY PRODUCTIVITY
Satellite remote-sensing of surface chl-a distribution was found to be inadequate to develop site-by-site data that could be correlated with hydromedusan populations, making any associations with chlorophyll measures impossible to analyse using this approach. This is due to both biological findings and physical constraints. Based on the dissimilarity of the hydromedusan population sizes and species assemblage between sites, it is likely that blooms develop locally rather than being the result of advection. Therefore, geographically and temporally specific data, rather than averages over broad areas, are required to assess bottom-up trophic influences on hydromedusa populations. Reflectance from adjacent land topography and frequent cloud cover (McKee et al., Reference McKee, Cunningham, Wright and Hay2007; Zibordi et al., Reference Zibordi, Berthon, Mélin, D'Alimonte and Kaitala2009) in the area of all sites prevented sufficient fine-resolution measurement for flyover measurements to be used as a reliable data source. Therefore, under present limitations of available technology and regional weather, we suggest that bottom-up trophic influences might be better investigated using in situ methods.
Fish health outcomes
DATA COVERAGE
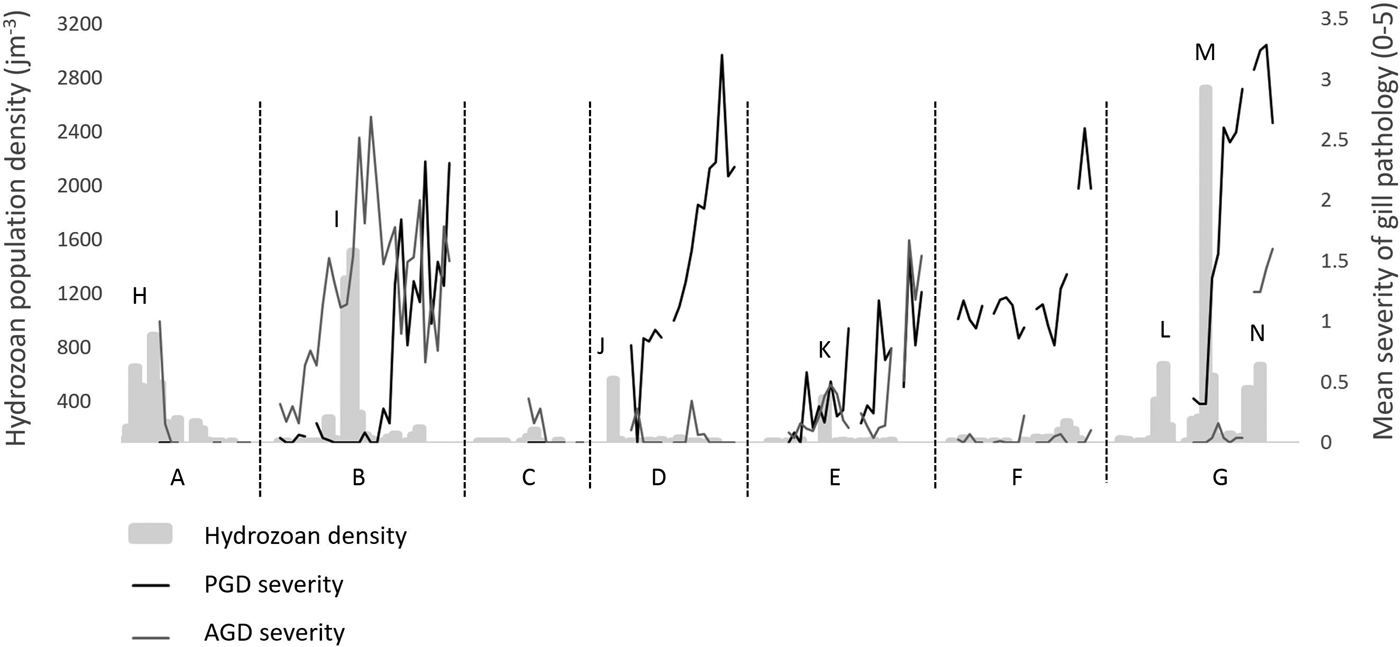
Hydrozoan population densities at or above 280 jm−3 were recorded on 17 dates, representing 10 discrete blooming events (Table 3). These overlapped with fully stocked salmon populations on seven occasions (Figure 11); three took place during fallow periods.
Hydromedusa population density and incidence of gill pathology, summer 2012–2014. Periods shown: (A) Greshornish 2012; (B) Greshornish 2014; (C) Linnhe 2012; (D) Linnhe 2013; (E) Invasion Bay 2013; (F) Invasion Bay 2014; and (G) Portnalong 2013. Specific blooms (see Table 3): (H) Bloom A, moderate to high magnitude and 4-week duration, involving Obelia sp.; (I) Bloom J, high magnitude and 2-week duration, involving both Obelia sp. and Lizzia blondina; (J) Bloom H, moderate and 1-week duration involving Hybocodon prolifer; (K) Bloom I, moderate and 1-week duration involving Obelia sp.; (L) Bloom E, moderate and 2-week duration, involving both Obelia sp. and Lizzia blondina; (M) Bloom F, moderate to high magnitude and 2-week duration; involving both Obelia sp. and Lizzia blondina; and (N) Bloom G, representing not a true bloom but an incursion by Muggiaea atlantica siphonophore.

It is important to note that in addition to cnidarian involvement, a number of physical factors, microbial pathogens and phytoplankton species can affect gill health. Both AGD and PGD can and do occur independently of detectable hydrozoan blooming, and this appears to have been the case in two of the periods of measurement: Linnhe in 2013 and Invasion Bay in 2014 experienced a persistently elevated population of Chaetoceros phytoplankton (Chris Wallace (2015) Personal communication with Marine Harvest Ltd re: treatment and mortality of caged salmon in Portnalong, summer 2013). (In both cases, fish recovered without intervention.) However, it is also worth noting that the largest bloom and the greatest incidence of poor gill health observed during the study period coincide.
QUALITATIVE IMPACT OF A HIGH-MAGNITUDE BLOOM
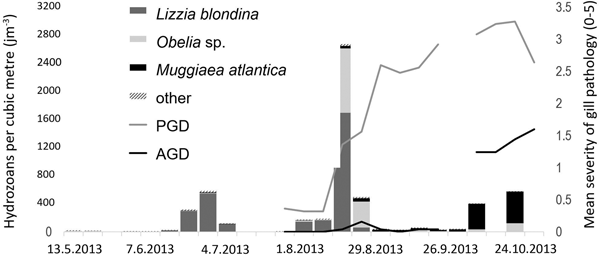
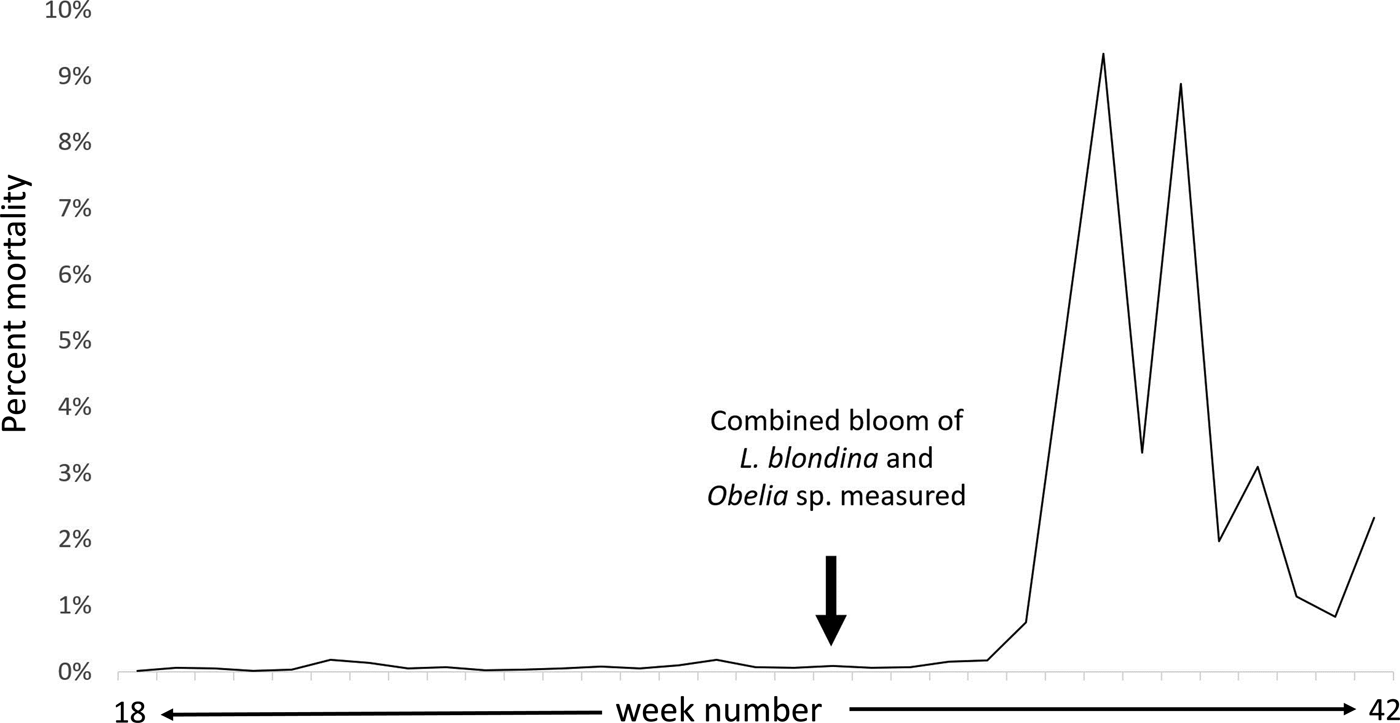
In 2013, Portnalong was subject to the largest hydrozoan bloom event recorded during the study period (Figure 6). Lizzia blondina population density rose to the point of moderate bloom for 2 weeks, measured in the weeks of 20 and 28 June (Table 3); three more spikes in L. blondina abundance were recorded before the beginning of August. In mid-August, a larger combined population of L. blondina (1696 jm−3) and Obelia sp. (892 jm−3) was recorded. Fewer L. blondina medusae (60 jm−3) were recorded the following week on 19 August, but the Obelia sp. population remained at moderate bloom level at 494 jm−3. The initial mid-August observation constituted the highest population density measured during the study period. Within days of this, the severity of PGD measured in sampled fish increased rapidly (Figure 12). Gill health continued to deteriorate for the following several weeks, followed by increasing mortality at the site (Figure 13). Beginning 12 September, moribund fish were sampled and histopathology analysed by FishVet Group staff. On 12 September, severe acute gill changes suggestive of a waterborne insult were reported; secondary chronic amoebic pathology had also developed, with small clusters of amoeba colonies appearing (Cox, Reference Cox2013). Inflammatory changes in the hindgut epithelial tissues were found, suggesting that the causative agent may also have been ingested.
Increase in PGD and AGD following bloom exposure. A major increase in PGD followed a high-magnitude spike in populations of Obelia sp. and Lizzia blondina; AGD also increased with lag.

Mortality increased dramatically at Portnalong in 2013 following exposure to multiple hydromedusan species and a rise in gill pathology.

A second histopathology analysis of Portnalong gills was conducted on 24 September, during a continuing rise in mortality. This examination found consistently poor gill condition and an increased incidence of secondary infection by amoebae (Cox, Reference Cox2013). During early October, over 400 segments m−3 of the M. atlantica siphonophore were observed over two separate sampling days, indicating potentially as much as 3 weeks of exposure to this species (Figure 12). Concurrently, a low-grade sea lice infestation had begun (Cox, Reference Cox2013), at a level not usually considered to be harmful to fish, but which could increase rapidly as well as strongly affect market value. Under normal circumstances, this infestation could be treated effectively with hydrogen peroxide at a concentration of 1800 ppm, with no harm to fish and minimal environmental impact. However, because this treatment would have further compromised damaged gills, the problem could not be adequately addressed.
Further histopathology examination on Oct 30 found significant chronic PGD in sampled fish with 50–80% of lamellar area involvement, and a further increased incidence of secondary AGD (Cox, Reference Cox2013). A final examination on 12 November found amoebic infestation had increased further on compromised gill tissues, with no sign of resolving in PGD-affected areas (Cox, Reference Cox2013). At this point the decision was taken to cull the remaining fish, at significant cost in both lost product revenue and in treatment expenses.
Other bloom incidents of lower magnitude produced less-pronounced results that were nevertheless similar in pattern (e.g. rise in AGD, PGD or both following hydrozoan exposure) (Figure 11), suggesting that lower-density exposures to planktonic hydrozoa are also likely to cause problems. The precise threshold levels for exposure, in terms of time and density, could not be conclusively estimated from these data.
DISCUSSION
Key findings
SPATIAL-TEMPORAL VARIABILITY
Hydrozoan population time series have been considered previously on a basis of two sites observed bi-weekly (Baxter et al., Reference Baxter, Rodger, McAllen and Doyle2011a). The present investigation expands monitoring to finer geographic and temporal resolution, targeted to summertime higher-risk periods. Using this approach, we found major differences in both the timing and the species composition of blooms between geographically proximate sites. This is inconsistent with a universal environmental mediator, such as lunar periodicity, being the primary stimulus for medusa production by hydroid colonies, even intraspecifically (as suggested by Elmhirst, Reference Elmhirst1925, for Obelia geniculata). Additionally, given the proximity of Portnalong and Greshornish, the temporal differences in species assemblage between these sites argues against geographically broad advection as responsible for the occurrence of Obelia sp. and L. blondina populations. Moreover, the presence of M. atlantica segments likely represent a siphonophore colony that has been advected into the area and dissociated, but these likewise did not appear in geographic patterns that would indicate wide-scale environmental stimuli.
On this basis, we recommend that future studies should be focused specifically at farm sites of interest, and that spatial-temporal generalizations of either observations or treatment responses cannot be made. While temperature was found to be an important mediator of blooms, it was not found to be directly predictive of blooms or spikes in either Obelia sp. or L. blondina populations. Meanwhile, changes in salinity and water clarity were not found to be significantly associated with changes in either Obelia sp. or L. blondina populations.
FISH HEALTH
This is also the first study linking Obelia sp. and L. blondina blooms to adverse gill health outcomes in salmon, warranting further dedicated study.
Population dynamics of Obelia sp. and Lizzia blondina
This investigation found that in spite of broad species richness in the hydrozoan fauna, L. blondina and Obelia sp. medusae together contributed the vast bulk of observed population density. Similar, if less dramatic, diversity dynamics have been found during past investigations into North Atlantic gelatinous zooplankton, with Obelia sp. occurring occasionally in somewhat larger population magnitudes than other recorded species, though not to the degree found in this study (e.g. Ballard & Myers, Reference Ballard and Myers2000, at Lough Hyne, Ireland; Primo et al., Reference Primo, Marques, Falcão, Crespo, Pardal and Azeiteiro2012, at Mondego estuary, Portugal). Previous studies did not involve the same degree of spatial-temporal resolution in their monitoring; as such, they may have missed short-lived high magnitude occurrences, or conducted sampling at sites not as prone to population fluctuations. Consequently, the boom-and-bust nature of many of the blooms reported here, as well as the tendency for the co-occurrence of L. blondina and Obelia sp. blooms, have not been previously reported in surveyed studies.
Complicating these observations are unavoidable problems of taxonomy. Obelia congenerics can only be visually identified to species level at the hydroid colony life stage, with the medusae indistinguishable. It is possible that the samples reported here, as well as in those in previous reports, reflect the presence of several different Obelia species, each with a different set of environmental parameters conducive to reproduction. Three species are frequently cited in UK waters: O. geniculata, O. longissima and O. dichotoma (Cornelius et al., Reference Cornelius, Barnes and Crothers1995), though the presence of thick settlement of O. geniculata colonies in the Laminaria digitata fouling communities at numerous aquaculture facilities is suggestive of a link to the medusae collected in this study. Useful next steps might include comparisons of reproductive behaviour amongst Obelia congenerics’ hydroid colonies, as well as molecular comparisons between local colonies and local blooms.
The complete lack of published information on the L. blondina colonial stage is similarly confounding, though a different bloom production dynamic can also be considered. Lizzia blondina is one of several hydrozoan species which deviates from the classic life cycle pattern in its ability to clone at the medusa stage, reproducing in the plankton by budding from the manubrium (Stibor & Tokle, Reference Stibor and Tokle2003; Hosia & Båmstedt, Reference Hosia and Båmstedt2007). Shucksmith et al. (Reference Shucksmith, Irvine and McEvoyin prep.) found that L. blondina populations near Shetland flourished during periods of high microzooplankton abundance, suggesting that response to favourable trophic conditions may account for the rapidly developing large populations seen in this study.
The high-density, short-term presence of both of these species in the plankton may be an intriguing indicator of reproductive strategy. The medusa life stage represents a step in hydrozoan reproduction that is not strictly necessary for survival: hydroid colonies can and do persist and grow without carrying out a planktonic dispersal phase, and a number of species, such as Dynamena pumila, lack a medusa stage altogether, dispersing only as planula larvae (Cornelius et al., Reference Cornelius, Barnes and Crothers1995). While the hydroid colony may be, in theory, functionally immortal in its ability to continue to grow clonally, the medusa life stage is suited to recombination and/or longer-distance dispersal rather than longevity. In the case of Obelia longissima, Stepanjants (Reference Stepanjants1998) found that medusae produced by a laboratory-maintained colony lived for only 7–30 days. Most species found in this study tended to occur in low numbers with relative evenness over time, suggesting that their hydroid stages are releasing few medusae at a steady rate. The boom populations of L. blondina and Obelia sp. represent a major deviation from this pattern, suggesting strategic overproduction of medusae.
Role of water quality
The finding of 12 °C as a threshold temperature for Obelia sp. and L. blondina spikes and blooms has not been previously reported. Cornelius et al. (Reference Cornelius, Barnes and Crothers1995) reports Obelia sp. medusae as occurring off the south of England in March to late April, during seasonal temperatures of 9–10 °C and in eastern Denmark between late March and June, in water of 3–4 °C; Bruce et al. (Reference Bruce, Colman and Jones1963) report Obelia sp. medusae as occurring as early as April off the Isle of Man, in water as cold as 8.5 °C. Baxter et al. (Reference Baxter, Sturt, Ruane, Doyle, McAllen, Harman and Rodger2011b) and Shucksmith et al. (Reference Shucksmith, Irvine and McEvoyin prep.) also found L. blondina present in summer periods. However, these publications do not specify the population density observed, and the data gathered in this study do show baseline low population incidence of Obelia sp. in the plankton at cooler temperatures. Based on the data in this study, warmer temperatures should be regarded as a threshold requirement for large population densities to be generated. Blackett et al. (Reference Blackett, Lucas, Harmer and Licandro2015) found a 10 °C temperature threshold for production of the eudoxid life stage of M. atlantica in the English Channel, with overall colder years associated with fewer cohorts produced due to a temporal mismatch in zooplankton prey availability. Although the threshold for observing large populations of M. atlantica in this dataset was found to be higher at 12 °C, this may similarly be due to biotic cycles of its prey in Scottish waters.
A temperature threshold would be a useful focus for further investigation, both in terms of focused observation and in terms of physical parameters to explore in laboratory-cultured colonies. As mentioned previously, a notable contradiction of this is found in Elmhirst (Reference Elmhirst1925), who describes an O. geniculata colony at a pier in Millport, Scotland producing medusae specifically in 10-day stretches ‘in the third week of the lunar cycles in July, August and September and not at other times.’ However, while often repeated in the literature, this phenomenon has not been reproduced in controlled studies or been clearly reflected in a published zooplankton record.
Our data also likely demonstrate that temperature is a stronger driver of bloom dynamics than photoperiod, and almost certainly more so than salinity or water clarity. In our Results, we point out that the bloom season appeared to end around mid to late September, with the exception of a single outlier in mid-October at Portnalong in 2013. As temperature measures at Portnalong at this time were consistently a full degree warmer than those in October 2012, we surmise that temperature is a strong determinant, with photoperiod an artefact of this. Meanwhile, neither salinity nor water clarity could be mapped with any kind of pattern to bloom occurrence, either in the period immediately preceding blooms or in the 30- to 60-day run-up periods. Additionally, it is notable that no blooms were observed during short-lived periods of very low salinity. The statistical significance of this could not be tested with the present dataset, but the observation may be a fruitful area for future investigation. Taken together, this suggests that freshwater runoff events or periods increasing salinity are unlikely to be causative stimuli for local blooms.
Role of geography
There was a substantial difference between Skye sites (Portnalong and Greshornish) and Lochaber sites (Linnhe and Invasion Bay) in the probability of large-scale blooms occurring, with Portnalong and Greshornish showing considerably more frequent and larger population density increases of both Obelia sp. and L. blondina. There are a number of potential abiotic factors that could influence this. First, Loch Harport and Loch Snizort (where Portnalong and Greshornish are located, respectively) are far more exposed to the broad expanse of open water in the Minch than are Loch Sunart and Loch Linnhe (Invasion Bay and Linnhe). Some scyphozoan aggregations have been recorded as the result of surface current advection (e.g. Doyle et al., Reference Doyle, De Haas, Cotton, Dorschel, Cummins, Houghton, Hays and Davenport2008), and hydrozoan blooms may be subject to similar influences. However, if bloom populations recorded at Portnalong and Greshornish were the result of advection alone, a temporal relationship between the two sites’ hydromedusan populations might be expected, and this was not found to be the case; instead, species assemblage and population density in the two lochs were independent of one another. It seems likely that blooms are locally arising phenomena, with local stimuli prompting the development and release of medusae to the plankton. Wave action has previously been put forward as one possibility for inducing investment in sexual reproduction in other hydrozoan species, particularly the intertidal species Dynamena pumila (e.g. Dayton, Reference Dayton1975; Rossi et al., Reference Rossi, Gili and Hugues2000), which might be consistent with the relative exposure of Greshornish and Portnalong to the broad sea surface fetch of the Minch. These studies consistently found that locations with high wave action were strongly associated with higher proportions of reproductive gonangia to feeding hydranths in the colonies. Ellyat (2015) found that in a time series assessment of D. pumila colonies in an intertidal rockpool, a period of high wave action was immediately followed by a large increase in gonangia. The limited amount of time over which this study was conducted prevented a replication of this observation, but it does suggest periods of wave exposure may trigger reproductive investment in a hydroid species. Meanwhile, sea surface energy as a reproductive cue is well known in various neritic or intertidal limpet and abalone species (e.g. Orton et al., Reference Orton, Southward and Dodd1956, regarding Patella vulgata; Creese & Ballantine, Reference Creese and Ballantine1983, regarding Cellana radians; Sasaki & Sheperd, Reference Sasaki and Sheperd1995, regarding Haliotis discus; and Tegula spp., Shanks, Reference Shanks1998 regarding Lottia digitalis). In all of these cases, strong onshore wind-driven waves were associated with coastal downwelling, which when coupled with coastal currents, swept propagules out of the surf zone but retained them near the shoreline and suitable settlement substrate (Shanks, Reference Shanks1998). An association between similar oceanographic phenomena and neritic hydroid fauna found in Scottish sites may be worth further investigation.
Other interlinked physical differences amongst the sites should also be considered as possible stimuli. A number of factors cited as stimuli for other species, such as photoperiod and lunar cycle (e.g. Elmhirst, Reference Elmhirst1925; Arai, Reference Arai1992), are unlikely to be applicable, as these do not differ considerably across the sites observed. Fluctuations in salinity were temporally variable between sites, but all sites’ mean salinity were within one standard deviation of one another, and rapid changes in salinity were not associated with subsequent major changes in hydromedusan population density. The temperature parameter established above is certainly striking, but while both Linnhe and Invasion Bay experienced sustained temperatures above 12.5 °C throughout the summer periods investigated, neither experienced the blooms characterized at Portnalong and Greshornish. Difference in character in terms of the sea lochs’ geography and bathymetry could play a role. Linnhe and Invasion Bay are situated within deep, steep-sided, narrow lochs of 155 and 124 m maximum depths, respectively. These lochs are also bathymetrically complex, with multiple sills distinguishing discrete basins (Edwards & Sharples, Reference Edwards and Sharples1986). Conversely, Loch Harport and Loch Greshornish, where Portnalong and Greshornish are situated, are much simpler: Loch Greshornish possesses only one minor sill and Loch Harport none, and neither are deeper than 50 m. These factors affect the residence time of the lochs, with the Lochaber sites requiring considerably longer for complete flushing. This could limit bloom likelihood by restricting the availability of critical nutritional resources. Alternatively, while freshwater runoff is itself unlikely to be a main causative factor, soluble chemicals associated with geographically specific runoff might also have a dampening effect on medusa production over long-term exposure.
Finally, this study did not quantitatively consider the distribution of the hydroid stage of Obelia geniculata or its congenerics, and the hydroid colony (or its absence) of Lizzia blondina has never been discovered or described. The presence and density of the parent colonies will almost certainly have a bearing on the magnitude of bloom incidence in a given area, particularly if the theory of local medusa production is correct. Anecdotal evidence suggests patchiness of Obelia geniculata across the west of Scotland, with some areas showing thick colonization across Laminaria digitata fronds and others showing few, if any, colonies present. Obelia geniculata hydroids were present in the fouling communities at all four sites in this study, but the degree of colonization was not examined. A quantitative study of geographic distribution of both medusa and colony density would be useful in assessing the impact of the colonial stage.
Impact on aquaculture
Small overall sample size and inconsistent site compliance make it difficult to statistically link mortality and gill pathology in sea-caged salmon with exposure to hydrozoan blooms. It may be that the only conclusive approach to forging this link will be the use of challenge trials, e.g. the intentional exposure of salmon to dose-calibrated population density levels of hydrozoans in a controlled setting. However, serious and enduring effects of high-density nematocyst exposure on the gills of caged fish has been demonstrated by Baxter et al. (Reference Baxter, Sturt, Ruane, Doyle, McAllen, Harman and Rodger2011b) with Aurelia aurita and Bosch-Belmar et al. (Reference Bosch-Belmar, M'Rabet, Dhaouadi, Chalghaf, Daly Yahia, Fuentes, Piraino and Kéfi-Daly Yahia2016) with Pelagia noctiluca, and similar histopathological outcomes were observed here. The magnitude of both L. blondina and Obelia sp. population densities immediately prior to a period of sustained and ultimately lethal gill pathology seems unlikely to be coincidental.
Some degree of gill damage is likely to self-resolve, when given opportunity to heal without further insult. However, sea-caged fish do not live in a proverbial vacuum, and are subject to a highly non-sterile environment. Neoparamoeba perurans, the species implicated in amoebic gill disease, is frequently present in very low numbers in farmed fish populations (Mitchell et al., Reference Mitchell, Baxter and Rodger2011). An insult producing sustained PGD and inflammation, as seen in this investigation, may catalyse the overgrowth of amoebae and establishment of clinically relevant AGD. Complicating this further is the consideration of sea lice. Of the treatments for low-grade sea lice infestation, hydrogen peroxide baths have the least environmental impact, and are becoming comparatively less costly than pyrethroid pesticide treatments due to the development of parasitic resistance (Aaen et al., Reference Aaen, Helgesen, Bakke, Kaur and Horsberg2015). Hydrogen peroxide treatments have no appreciable side effects on healthy salmon, but may produce considerable mortality when used on fish with highly compromised gills. The knock-on health effects of exposure to hydrozoan blooms should put aquaculturists on their guard.
Recommendations and future work
On the basis of the understanding developed in this investigation, it is apparent that dedicated monitoring of planktonic hydrozoans could be a useful part of the weekly or even daily environmental monitoring conducted around sea cages for salmon health and welfare. Effects of medusozoan blooms on salmon aquaculture have historically been reported retrospectively in the wake of a fish kill (e.g. Doyle et al., Reference Doyle, De Haas, Cotton, Dorschel, Cummins, Houghton, Hays and Davenport2008; Ferguson et al., Reference Ferguson, Delannoy, Hay, Nicolson, Sutherland and Crumlish2010); samples are either taken after morbidity and mortality are noticed, or are presumptively associated with the visible presence of a medusa bloom. This dataset demonstrates that such an approach will almost certainly miss relevant information. First, the short-lived nature of many blooms results in the original causative species being missed in retrospective sampling. Second, most of the species encountered in this study, and particularly the two most responsible for bloom events, are too small to be seen without dedicated sampling and microscopic examination. Many idiopathic fish kills or morbidity events in the past are likely to have been the result of such cryptic blooms. A proactive, real-time approach to monitoring could be very useful in recognizing the source of serious problems as well as increasing options for early mitigation. High frequency, geographically broad sampling would also help in future data-gathering, in terms of pinpointing the thresholds of bloom size and exposure duration that may be of concern to aquaculturists, as well as providing opportunity for more detailed histopathological investigations. Finally, an increased awareness of the environmental threats to which the fish are exposed might help in avoiding or minimizing dilemmas such as that described for Portnalong in 2013, wherein poor gill health precluded effective treatment for sea lice infestation.
Controlled experiments on the hydroid stages of L. blondina and Obelia congenerics would also be a logical next step. Difference in medusa production patterns between O. geniculata, longissima and dichotoma may help to account for spatial-temporal difference in Obelia sp. medusa blooms. Lizzia blondina reproduction is even less well understood, with the hydroid colony as yet undescribed. An array of stimuli operating on various hydroid species has been reviewed in Arai (Reference Arai1992); many of these are worthy of investigation, particularly in conjunction with the temperature-based patterns seen here. Finally, a quantitative examination of colony presence and density at each site, matched with its bloom record, would be useful to help assess the risk of hydroid presence in the fouling community.
SUPPLEMENTARY MATERIAL
The supplementary material for this article can be found at https://doi.org/10.1017/S002531541800022X
ACKNOWLEDGEMENTS
We would like to thank Marine Harvest workers for their participation, and Chris Wallace and Dave Cockerill for their assistance in helping to organize equipment and provide access and collaboration. We would also like to thank Mary Mackay, Luke Holman and Fiona Grieve for contributed data collection. We would lastly like to thank Rachel Shucksmith and Christine Beveridge for assistance with medusa identification.
FINANCIAL SUPPORT
This study was made possible through a Marine Alliance for Science and Technology Scotland Prize PhD Studentship awarded to Anna Kintner in 2011, and was further supported with contributions from the School of Biology, University of St Andrews.