

1 Introduction
While turbulent flows are generally chaotic and random, coherent large-scale motions can exist within them. Wall-bounded turbulent flows are not an exception, and large-scale organized structures have been reported in both experiments and numerics (Jimenez Reference Jimenez2012). The study of structures was pioneered in channel flow, i.e. the pressure-driven flow between two parallel plates, a popular model to study wall-bounded turbulence. Using large-eddy simulation, Moin & Kim (Reference Moin and Kim1982) found large-amplitude streamwise vortical structures concentrated near the wall. These large-scale structures were attributed to a splatting effect (a net transfer of energy between perpendicular velocity fluctuations) and to Helmholtz-type instabilities of intense shear layers at and near the wall. Similar large-scale structures were also found by Moser & Moin (Reference Moser and Moin1984) using direct numerical simulation (DNS) in turbulent channel flow with a curved geometry, and by Kim, Moin & Moser (Reference Kim, Moin and Moser1987) in a fully turbulent channel. Kim et al. (Reference Kim, Moin and Moser1987) further characterized these structures through local maxima and minima of the streamwise vorticity, i.e. a streamwise vortex model. With the increased availability of computational power, the achievable Reynolds numbers and domain sizes in simulations have kept on growing. Large coherent structures have still been observed even for the recent simulations at  $Re_{\unicode[STIX]{x1D70F}}\approx 5200$ by Lee & Moser (Reference Lee and Moser2015). Coherent flow structures have also been observed in other types of high-Reynolds-number wall-bounded flows, including pipe flows (Eckhardt et al. Reference Eckhardt, Schneider, Höf and Westerweel2007), plane Couette flow, i.e. the shear flow between two parallel plates, in turbulent boundary layers (Smits, McKeon & Marusic Reference Smits, McKeon and Marusic2011), and in von Kármán flow, i.e. the flow between two coaxial rotating discs (Zandbergen & Dijkstra Reference Zandbergen and Dijkstra1987; Ravelet et al. Reference Ravelet, Marié, Chiffaudel and Daviaud2004).
Taylor–Couette flow (Grossmann, Lohse & Sun Reference Grossmann, Lohse and Sun2016), the flow between two coaxial and independently rotating cylinders, is another canonical wall-bounded flow where coherent large-scale structures are present. Their formation has usually been attributed to centrifugal (linear) instabilities since the seminal study by Taylor (Reference Taylor1923). Because of this, they are usually referred to as Taylor rolls. Owing to the centrifugal effects, Taylor–Couette flow and its structures have usually been studied from the point of view of angular momentum convection, and not from the perspective of a wall-bounded flow (Lathrop, Fineberg & Swinney Reference Lathrop, Fineberg and Swinney1992). A notable difference between Taylor rolls and more general structures in wall-bounded flows is that Taylor rolls are pinned, i.e. they do not move around the fluid domain, and this is true with increasing Reynolds numbers up to the so-called turbulent Taylor rolls seen at  $Re\simeq 10^{6}$ by Huisman et al. (Reference Huisman, van der Veen, Sun and Lohse2014). Turbulent Taylor rolls survive at high Reynolds number only for some combinations of curvature and mild outer-cylinder rotation (Huisman et al. Reference Huisman, van der Veen, Sun and Lohse2014; Ostilla-Mónico et al. Reference Ostilla-Mónico, van der Poel, Verzicco, Grossmann and Lohse2014). Remarkably, in a Taylor–Couette geometry with a large curvature, rolls do not exist at high Reynolds number for pure inner-cylinder rotation (Ostilla-Mónico et al. Reference Ostilla-Mónico, van der Poel, Verzicco, Grossmann and Lohse2014). This means that something else aside from centrifugal effects must play a role. Numerical studies of Taylor–Couette flow conducted by Sacco, Verzicco & Ostilla-Mónico (Reference Sacco, Verzicco and Ostilla-Mónico2019) found that turbulent Taylor rolls appeared with a combination of shear and mild anticyclonic rotation. Their onset was not controlled by the curvature of the system. At high Reynolds numbers, Taylor rolls would unpin, or even disappear, if anticyclonic rotation was removed. Sacco et al. (Reference Sacco, Verzicco and Ostilla-Mónico2019) also found that the rolls are persistent in the limit of vanishing curvature, i.e. when Taylor–Couette flow becomes rotating plane Couette flow, if anticyclonic rotation is present.
This showed that the study of turbulent Taylor rolls could be better approached from a shear flow perspective, and not simply by thinking of them as a continuation of the centrifugal linear instability seen at low Reynolds numbers. Indeed, low-curvature Taylor–Couette flow shows some characteristics of shear flows for Reynolds numbers just beyond the onset of the linear, centrifugal instability. Taylor rolls develop a streamwise modulation, after which they are usually denoted ‘wavy’ Taylor vortices Andereck, Liu & Swinney (Reference Andereck, Liu and Swinney1986). This is linked to the appearance of large-scale streaks (Dessup et al. Reference Dessup, Tuckerman, Wesfreid, Barkley and Willis2018). Taylor rolls are then fed by the nonlinear interaction of streaks. This nonlinear interaction between the pinned Taylor roll and the streak was attributed to the activation of the self-sustained process (SSP) of shear flows (Dessup et al. Reference Dessup, Tuckerman, Wesfreid, Barkley and Willis2018), which is described below. In this spirit, Sacco et al. (Reference Sacco, Verzicco and Ostilla-Mónico2019) showed that the energy of turbulent Taylor rolls and streaks varied periodically with a distinct phase shift, and a long-time-scale multistage process energized the pinned structures. But despite the low-Reynolds-number link (Dessup et al. Reference Dessup, Tuckerman, Wesfreid, Barkley and Willis2018), it is not clear how the high-Reynolds-number turbulent Taylor roll–streak process is related to the SSP responsible for the generation of turbulence in shear flows.
The name SSP commonly refers to a multistage process responsible for regenerating wall-bounded turbulence, where streamwise rolls interact with streamwise velocity to cause streaks. These unstable streaks interact nonlinearly, reinforcing the rolls and completing the SSP cycle. Waleffe (Reference Waleffe1997) was the first to show that a generic process was responsible for the regeneration of turbulence in wall-bounded flows. Unlike earlier studies of the regeneration mechanisms in channel flow (Hamilton, Kim & Waleffe Reference Hamilton, Kim and Waleffe1995), Waleffe (Reference Waleffe1997) studied the SSP in a fluid system where the flow is bounded by two infinite stress-free plates and forced using a body shear force. Waleffe (Reference Waleffe1997) was the first to study this system in detail to assess the role of the no-slip condition in the SSP, even if it had been used by Tollmien (Reference Tollmien1936) to show that an inflection point was not a sufficient condition for linear instability (Drazin & Reid Reference Drazin and Reid2004). Because of this, it has been recently associated with Waleffe’s name (Beaume et al. Reference Beaume, Chini, Julien and Knobloch2015; Chantry, Tuckerman & Barkley Reference Chantry, Tuckerman and Barkley2016), and we will refer to it as Waleffe flow from here on.
In the spirit of Waleffe (Reference Waleffe1997), we set out to investigate whether the large-scale coherent structures of plane Couette and Taylor–Couette flow are part of a more general class of structures, which require only shear (and anticyclonic rotation), as the SSP does, or if they are something distinct, separated from the SSP because they require the presence of a no-slip wall. The natural system to investigate this is rotating Waleffe flow.
The absence of a no-slip wall also provides for a second avenue of investigation. In Taylor–Couette and in rotating plane Couette flow, the transport of torque or shear is greatly enhanced by the presence of large-scale structures. In particular, in Taylor–Couette flow, the angular velocity current, non-dimensionalized as a Nusselt number ( $Nu_{\unicode[STIX]{x1D714}}$), depends mainly on three parameters: first, the shear, which can be non-dimensionalized as a shear Reynolds number,
 $Re_{s}=U(r_{o}-r_{i})/\unicode[STIX]{x1D708}$; second, the solid-body system rotation, which appears in the equations as a Coriolis force, and its magnitude can be expressed non-dimensionally as a rotation number,
 $R_{\unicode[STIX]{x1D6FA}}=2\unicode[STIX]{x1D6FA}(r_{o}-r_{i})/U$; and finally, the curvature, expressed as a radius ratio,
 $\unicode[STIX]{x1D702}=r_{i}/r_{o}$. Here,
 $r_{i}$ (
 $r_{o}$) is the inner (outer) cylinder radius,
 $U$ is a characteristic shear velocity,
 $\unicode[STIX]{x1D708}$ is the kinematic viscosity of the fluid and
 $\unicode[STIX]{x1D6FA}$ is the background rotation. Each of these parameters is linked both to the torque and to the presence of large-scale structures (van Gils et al. Reference van Gils, Huisman, Grossmann, Sun and Lohse2012; Brauckmann & Eckhardt Reference Brauckmann and Eckhardt2013; Ostilla-Mónico et al. Reference Ostilla-Mónico, van der Poel, Verzicco, Grossmann and Lohse2014). In the low-curvature regime (
 $\unicode[STIX]{x1D702}\geqslant 0.9$), where centrifugal forces are negligible, Brauckmann, Salewski & Eckhardt (Reference Brauckmann, Salewski and Eckhardt2016) showed that, at
 $Re_{s}\sim O(10^{4})$, there are two local maxima in the
 $Nu_{\unicode[STIX]{x1D714}}(R_{\unicode[STIX]{x1D6FA}})$ curve: one narrow and one broad. The ‘broad maximum’ at
 $R_{\unicode[STIX]{x1D6FA}}\approx 0.2$ dominated at lower shear Reynolds number (
 $Re_{s}$) and was related to the enhancement of large-scale vortical flow structures (Brauckmann et al. Reference Brauckmann, Salewski and Eckhardt2016). On the other hand, the ‘narrow peak’ at
 $R_{\unicode[STIX]{x1D6FA}}=0.02$ was linked to a shear instability due to turbulent boundary layers (Brauckmann & Eckhardt Reference Brauckmann and Eckhardt2017) and emerged with increasing
 $Re_{s}$. It was argued that this narrow peak would supersede the broad peak at very high
 $Re_{s}$ (Brauckmann et al. Reference Brauckmann, Salewski and Eckhardt2016; Brauckmann & Eckhardt Reference Brauckmann and Eckhardt2017), and this was confirmed experimentally (R. Ezeta, unpublished observations).
The broad and narrow peaks in the shear/torque transport were found to exist even in the limit of rotating plane Couette flow, when curvature was completely absent. If large-scale vortical structures similar to the so-called turbulent Taylor rolls appear in Waleffe flow, one could expect that, in the regions of parameter space where they are strengthened, a similar shear transport enhancement will exist. And if it existed, this optimal transport would survive well into the turbulent regime, as it would not be superseded by boundary layer instabilities from a no-slip wall. Thus the second and third questions we set out to answer are these: (i) Does optimal transport exist in rotating Waleffe flow? (ii) If so, how is it linked to large-scale structure enhancement?
The paper is organized as follows. In § 2, we define the numerical set-up, control parameters, spatial resolution and domain size study. These include details of the numerical scheme (§ 2.1), energy spectrum studies to assess the spatial resolution (§ 2.2) and autocorrelation studies (§ 2.3) to assess the size of the domain. We then detail the results of our investigation in § 3, including a characterization of the transport of shear in § 3.1, the effect of rotation on the statistics of Waleffe flow at high Reynolds number in § 3.2, including a discussion of optimal transport, the effect of rotation on the large-scale structures, and how it is further linked to optimal transport and measures against plane Couette flow in § 3.3, and a further characterization of these structures in § 3.4. We conclude in § 4 with a brief summary and an outline for further research.
2 Numerical set-up
2.1 Problem set-up and non-dimensionalization
We perform DNS of rotating Waleffe flow in a three-dimensional domain that is bounded by free-slip walls in the  $y$ direction at
 $y=0$ and
 $y=d$, and is periodic in the streamwise (
 $x$) and spanwise (
 $z$) directions with periodicity lengths
 $L_{x}$ and
 $L_{z}$, respectively. A body force
 $\boldsymbol{f}$ is used to force the flow. A Coriolis body force is used to simulate solid-body rotation in the flow, which can be either cyclonic, i.e. where the spanwise rotation vector is parallel to the vorticity of the laminar base flow (
 $R_{\unicode[STIX]{x1D6FA}}<0$), or anticyclonic, i.e. the spanwise rotation vector is antiparallel to the vorticity of laminar base flow (
 $R_{\unicode[STIX]{x1D6FA}}>0$). With this, the Navier–Stokes equations thus read
 $$\begin{eqnarray}\frac{\unicode[STIX]{x2202}\boldsymbol{u}}{\unicode[STIX]{x2202}t}+\boldsymbol{u}\boldsymbol{\cdot }\unicode[STIX]{x1D735}\boldsymbol{u}+2\unicode[STIX]{x1D6FA}(\boldsymbol{e}_{z}\times \boldsymbol{u})=-\unicode[STIX]{x1D735}p+\unicode[STIX]{x1D708}\unicode[STIX]{x1D6FB}^{2}\boldsymbol{u}+\boldsymbol{f},\end{eqnarray}$$
which are solved alongside the incompressibility condition
 $$\begin{eqnarray}\unicode[STIX]{x1D735}\boldsymbol{\cdot }\boldsymbol{u}=0,\end{eqnarray}$$
where  $\boldsymbol{u}$ is the velocity,
 $\unicode[STIX]{x1D6FA}$ is the background spanwise rotation,
 $p$ is the pressure and
 $t$ is time.
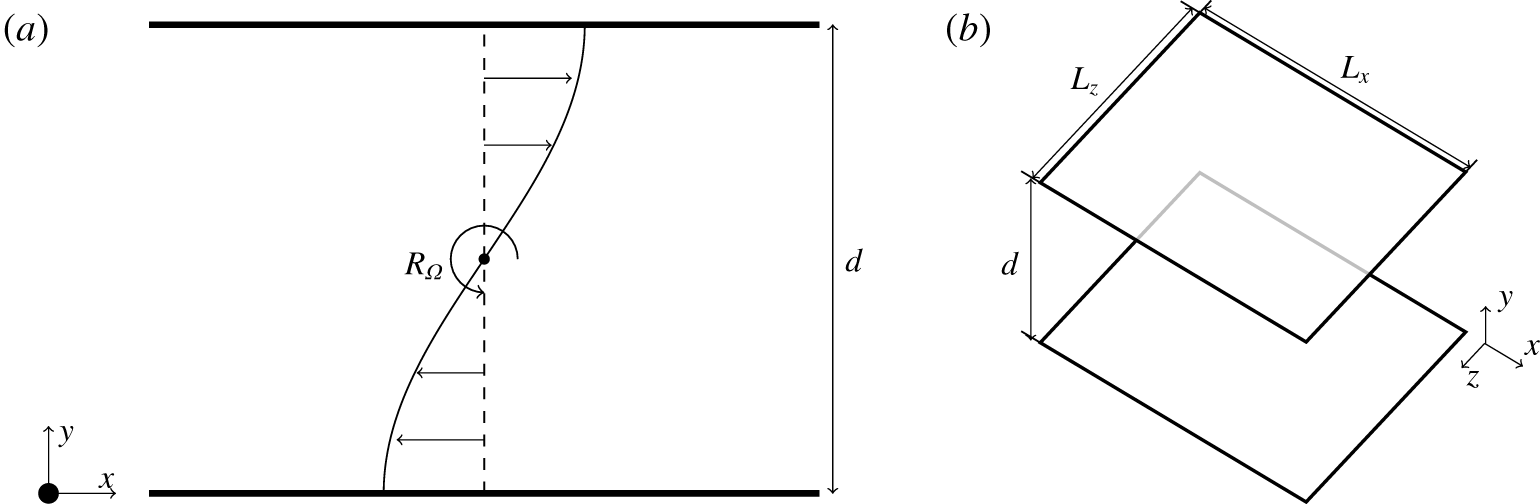
The geometrical configuration and the input body force of Waleffe flow is show in figure 1. The velocities in the  $x$,
 $y$ and
 $z$ directions are denoted by
 $u$,
 $v$ and
 $w$, respectively. A streamwise shear body force is required to force the flow, as, unlike plane Couette, flow no energy is injected through the walls. A sinusoidal profile is chosen, i.e.
 $\boldsymbol{f}=F\cos (\unicode[STIX]{x1D6FD}y)\boldsymbol{e}_{x}$, with
 $\unicode[STIX]{x1D6FD}=\unicode[STIX]{x03C0}/d$, analogous to the set-up used in Waleffe (Reference Waleffe1997). This means that the force is maximum, but in opposite directions at both slip walls, and zero at the mid-plane. The force must have zero average as otherwise the flow would constantly accelerate unopposed by the free-slip walls.
(a) Two-dimensional spanwise cut of the system showing the streamwise shear force and background rotation of the Waleffe flow system. The  $y$ origin of the system is shown as a thick black circle. (b) Three-dimensional view of the simulation geometry.

Furthermore, in the absence of the Dirichlet (no-slip) boundary condition, the system is completely Galilean-invariant. An arbitrary translation velocity can be added in either the streamwise or spanwise direction with no effect. A reference frame must be chosen, and we take the one for which the mean streamwise and spanwise velocities are zero. We will denote with the operator  $\langle \cdots \rangle$ a streamwise, spanwise and temporal average. In this spirit,
 $\langle \unicode[STIX]{x1D719}\rangle$ represents a mean quantity,
 $\unicode[STIX]{x1D719}^{\prime }$ the instantaneous fluctuation around the mean quantity, and
 $\langle \unicode[STIX]{x1D719}^{\prime }\rangle$ the root-mean-square fluctuation around this mean.
The equations are non-dimensionalized using the distance between the walls  $d$ and the forcing amplitude
 $F$. We define a characteristic velocity
 $\tilde{U}$ for non-dimensionalization as
 $\tilde{U} =\sqrt{Fd}$. We note that we use a different characteristic velocity than the one classically used for Waleffe flow (cf. Beaume et al. Reference Beaume, Chini, Julien and Knobloch2015), as we focus on the fully turbulent case, and not in perturbations around the laminar state. This definition results in a Reynolds number defined as
 $Re=\tilde{U} d/\unicode[STIX]{x1D708}=\sqrt{Fd^{3}}/\unicode[STIX]{x1D708}$, which is our first control parameter. The second non-dimensional control parameter accounts for the cyclonic and anticyclonic rotation of the system, and is defined as
 $R_{\unicode[STIX]{x1D6FA}}=2\unicode[STIX]{x1D6FA}d/\tilde{U} =2\unicode[STIX]{x1D6FA}d/\sqrt{Fd}$. For this study, we fix
 $Re=3.16\times 10^{3}$, large enough such that the flow is fully turbulent and that the shear transport takes place purely through Reynolds stresses (cf. § 3.1), and vary
 $R_{\unicode[STIX]{x1D6FA}}$ in the range
 $[-0.16,2.21]$ to study the effect of rotation. After the initial transient, we run the simulations between 200 and 250
 $d/\tilde{U}$ time units to collect statistics.
The equations are discretized in space using a second-order energy-conserving centred finite difference scheme, while temporal discretization is done using a third-order Runge–Kutta method for the explicit terms and a second-order Adams–Bashforth scheme for the implicit viscous terms in the wall-normal direction. The simulation code used is based on the highly parallel FORTRAN-based AFiD (www.afid.eu), which has been used mainly for simulating turbulent Rayleigh–Bénard convection and Taylor–Couette flow (van der Poel et al. Reference van der Poel, Ostilla-Mónico, Donners and Verzicco2015). This code has been comprehensively validated. Detailed information regarding the code algorithms can be found in Verzicco & Orlandi (Reference Verzicco and Orlandi1996) and van der Poel et al. (Reference van der Poel, Ostilla-Mónico, Donners and Verzicco2015).
2.2 Resolution study
For determining what is an adequate spatial resolution of the flow, a series of simulations were performed at  $Re=3.16\times 10^{3}$, for both no rotation (
 $R_{\unicode[STIX]{x1D6FA}}=0$) and mild anticyclonic rotation (
 $R_{\unicode[STIX]{x1D6FA}}=0.32$). We can expect the wall-normal resolution to be less stringent in Waleffe flow due to the absence of the no-slip boundary condition. However, the streamwise and spanwise directions were found to be more restrictive than a plane Couette flow simulation at comparable Reynolds numbers. Indeed, if one compares the Kolmogorov length scale
 $\unicode[STIX]{x1D702}_{K}$ at
 $Re\sim 3\times 10^{3}$ for both systems, we obtain that
 $\unicode[STIX]{x1D702}_{K}$ is between five and six times smaller for non-rotating Waleffe flow than for non-rotating plane Couette flow.
Adequate resolution for the streamwise and spanwise directions was ensured through a spectral analysis of velocity data. We found that for  $L_{x}/d=2\unicode[STIX]{x03C0}$ and
 $L_{z}/d=\unicode[STIX]{x03C0}$,
 $N_{x}=1024$ and
 $N_{z}=512$ points distributed uniformly were enough to accurately represent the velocity spectra at mid-gap at both no rotation and
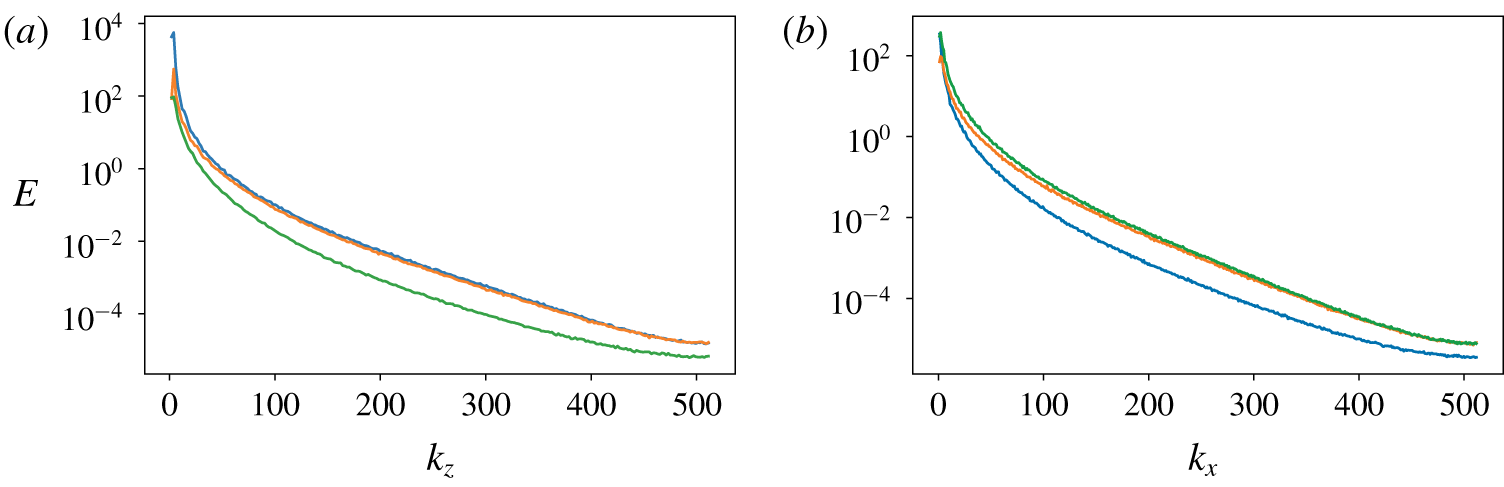
 $R_{\unicode[STIX]{x1D6FA}}=0.32$. An extended dissipative regime at high wavenumbers, with energy
 $E\sim \exp (-k)$, is seen in figure 2 for both the streamwise and the spanwise directions.
Energy spectra for the streamwise velocity  $u$ (blue), the wall-normal velocity
 $v$ (orange) and the spanwise velocity
 $w$ (green) in the spanwise (a) and streamwise (b) directions at the mid-gap at
 $R_{\unicode[STIX]{x1D6FA}}=0$.

We note that both homogeneous directions have the same effective grid spacing,  $\unicode[STIX]{x1D6E5}/d=6.13\times 10^{-3}$. Non-dimensionalized by the Kolmogorov length scale, this is approximately
 $\unicode[STIX]{x1D6E5}/\unicode[STIX]{x1D702}_{K}\approx 2.51$. Using this grid spacing in the wall-normal direction would result in a grid of
 $N_{y}\approx 163$ points. For safety, we use
 $N_{y}=384$, and cluster points near the wall, such that the minimum wall-normal grid spacing is
 $\unicode[STIX]{x1D6E5}/d=3.84\times 10^{-4}$ and the maximum wall-normal grid spacing is
 $\unicode[STIX]{x1D6E5}/d=3.85\times 10^{-3}$, or
 $0.157\lesssim \unicode[STIX]{x1D6E5}/\unicode[STIX]{x1D702}_{K}\lesssim 1.58$ in Kolmogorov units.
2.3 Domain periodicity study
We performed a domain-size study in order to quantify the effect of the spanwise and streamwise periodicity lengths on the flow field statistics and on the large structures that might be present in the flow. We simulated several domain sizes, where  $L_{x}$ and
 $L_{z}$ were doubled each time to produce larger and larger domains. The spatial resolution in both
 $x$ and
 $z$ directions was also doubled every time the domain was doubled, to keep the resolution from the previous section. We refer to the domains henceforth as ‘very small’ (
 $L_{x}/d=\unicode[STIX]{x03C0}$ and
 $L_{z}/d=\unicode[STIX]{x03C0}/2$), ‘small’ (
 $L_{x}/d=2\unicode[STIX]{x03C0}$ and
 $L_{z}/d=\unicode[STIX]{x03C0}$), ‘medium’ (
 $L_{x}/d=4\unicode[STIX]{x03C0}$ and
 $L_{z}/d=2\unicode[STIX]{x03C0}$) and ‘large’ (
 $L_{x}/d=8\unicode[STIX]{x03C0}$ and
 $L_{z}/d=4\unicode[STIX]{x03C0}$). We also note that the run time required to obtain adequate statistics does not decrease with domain size. The evolution of large scales takes place in long time scales (cf. § 3.4 for more details), and this strongly affects the value obtained for the mean streamwise velocity.
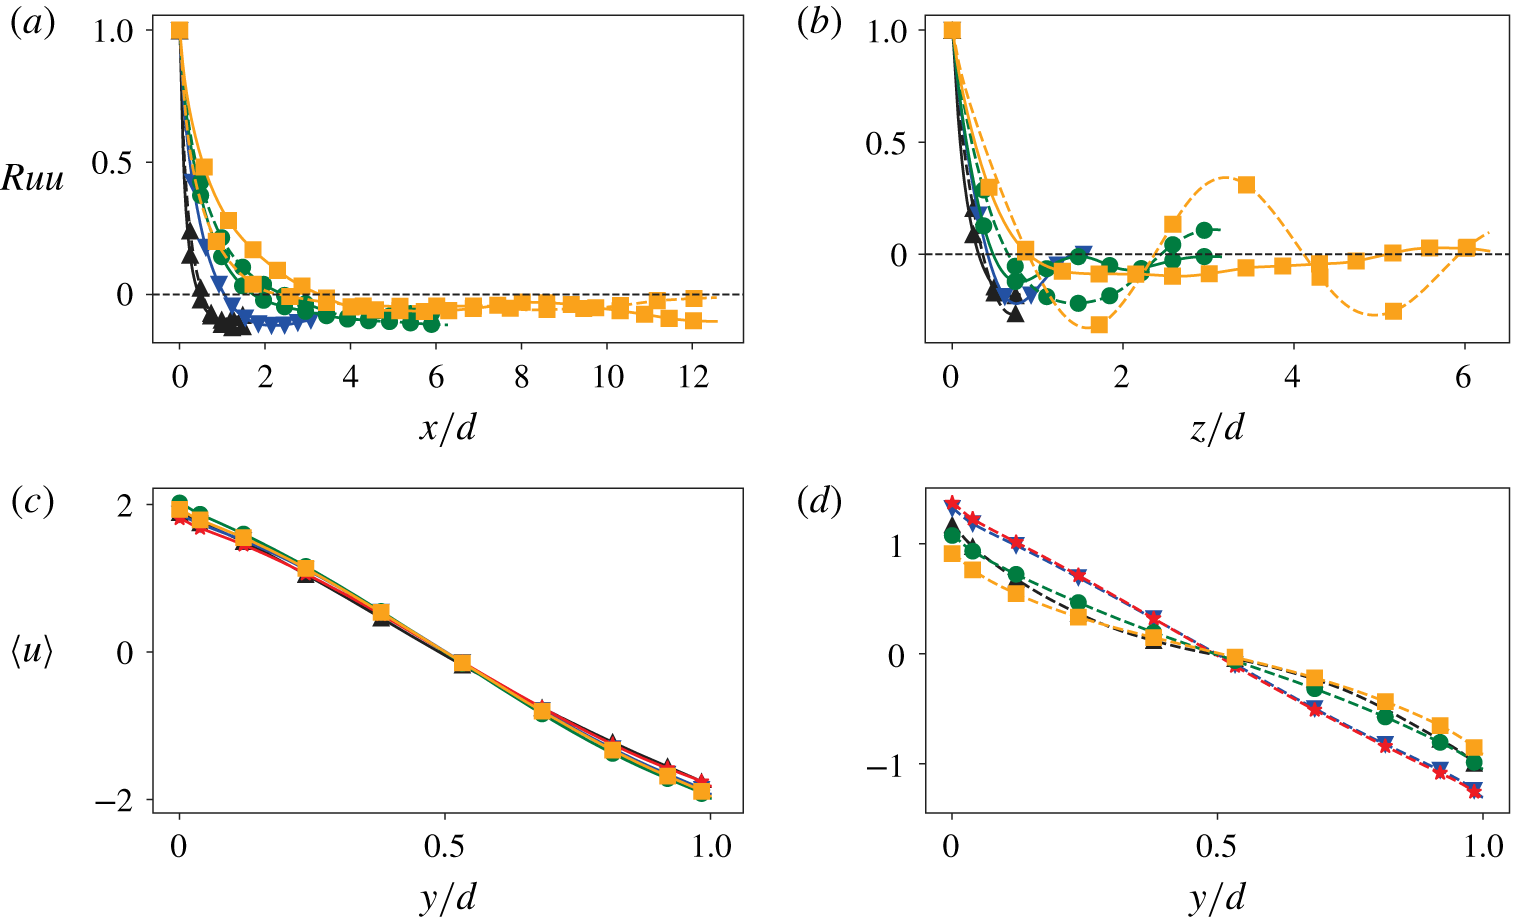
The effect of the domain size on the results was checked in several ways. First, figure 3(a,b) show the streamwise velocity autocorrelation in the streamwise and spanwise directions. The behaviour of non-rotating Waleffe flow is quite similar to what is commonly seen for plane Couette flow in the streamwise direction, with long decorrelation wavelengths. A strong effect of both rotation and domain size is seen in the autocorrelations, showing that the domain size will affect the behaviour of the structures inside the flow, and that rotation has a crucial effect on large-scale structures. All domains are sufficiently long in both the streamwise and spanwise dimensions for the velocity autocorrelations to change sign at least once. However, the domains are not large enough to show full decorrelation.
Another way to check domain-size independence is done by simply comparing the mean velocities obtained from the different computational domains. Owing to the presence of large-scale structures which fill up the domain, the velocity profiles could be affected by the wavelength of these structures. Doubling the domain would not account for the changing wavelength of these structures, as the domain would simply be filled up with twice as many structures with the same wavelength. To avoid this, we run an additional case with periodicity lengths ( $L_{x}/d=3\unicode[STIX]{x03C0}$ and
 $L_{z}/d=\frac{3}{2}\unicode[STIX]{x03C0}$), denoted as the ‘three-halves’ domain.
In figure 3(c,d), we show the streamwise, spanwise and temporally averaged streamwise velocity  $\langle u\rangle$ for all cases. Remarkably, for the non-rotating case, the average streamwise velocity for all domains from the smallest domain to the largest collapse on top of each other. For the rotating case, there is collapse between the small and three-halves domain, while the other domains show strong variability.
(a,b) The streamwise velocity autocorrelation in the streamwise (a) and spanwise (b) directions. Solid lines are without rotation ( $R_{\unicode[STIX]{x1D6FA}}=0$) while dashed lines are with mild rotation (
 $R_{\unicode[STIX]{x1D6FA}}=0.32$). Symbols: black upward triangle (▴),
 $L_{x}/d=\unicode[STIX]{x03C0}$,
 $L_{z}/d=\unicode[STIX]{x03C0}/2$; blue downward triangle (▾),
 $L_{x}/d=2\unicode[STIX]{x03C0}$,
 $L_{z}/d=\unicode[STIX]{x03C0}$; green circle (●),
 $L_{x}/d=4\unicode[STIX]{x03C0}$,
 $L_{z}/d=2\unicode[STIX]{x03C0}$; and yellow square (▪),
 $L_{x}/d=8\unicode[STIX]{x03C0}$,
 $L_{z}/d=4\unicode[STIX]{x03C0}$. (c,d) The magnitude of averaged streamwise velocity for non-rotating (c) and
 $R_{\unicode[STIX]{x1D6FA}}=0.32$ (d). The three-halves domain (red star (
 $\star$),
 $L_{x}/d=3\unicode[STIX]{x03C0}$,
 $L_{z}/d=\frac{3}{2}\unicode[STIX]{x03C0}$) is also included.

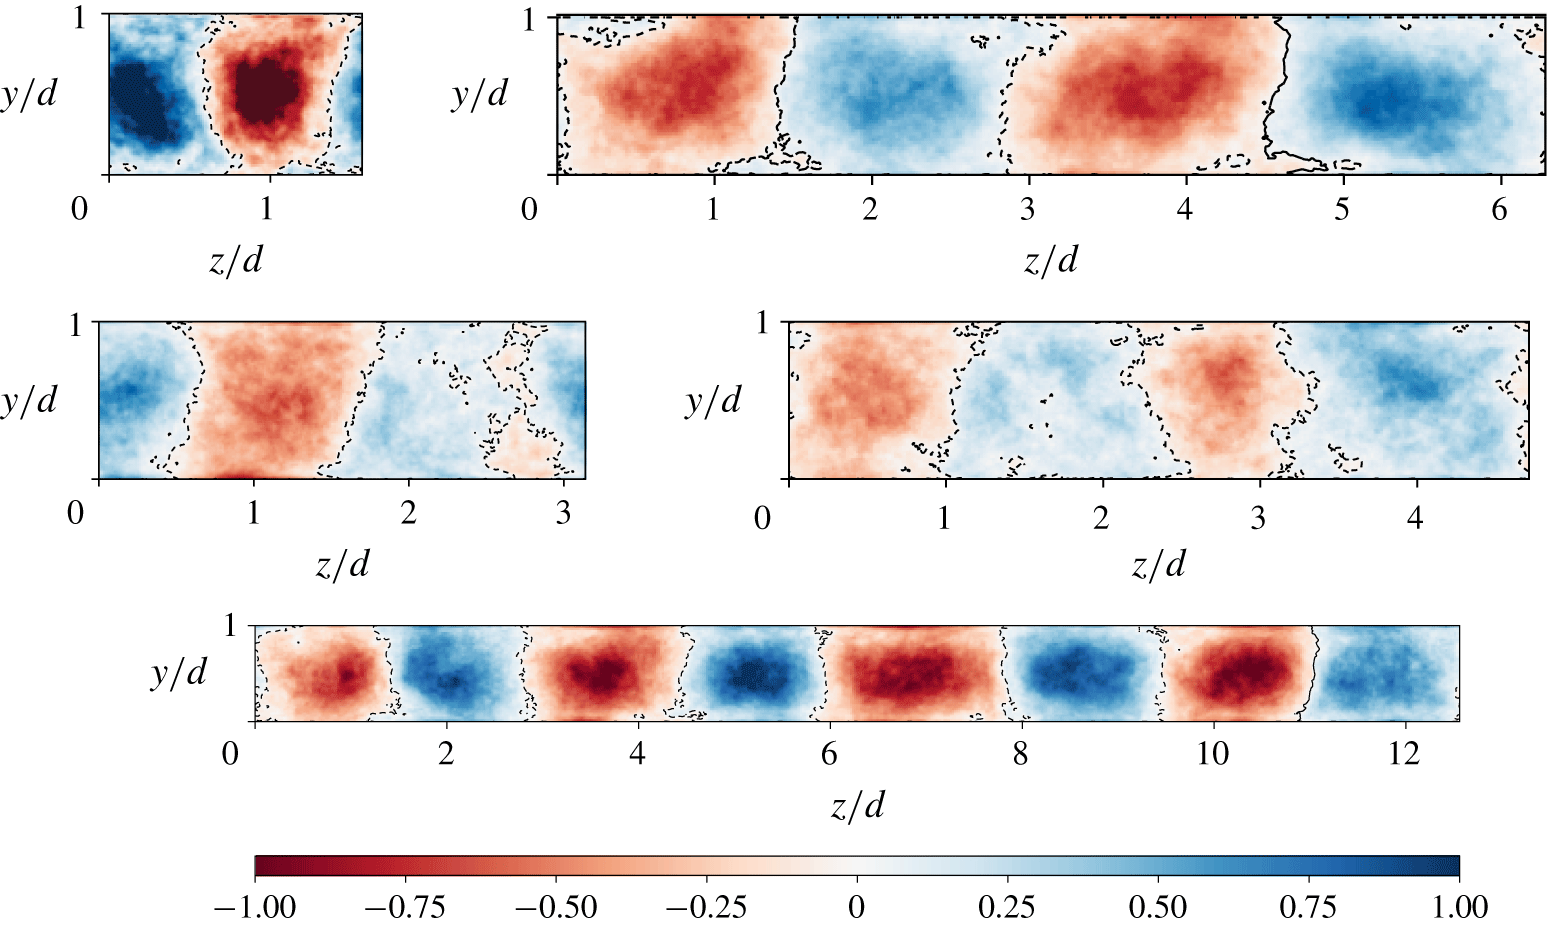
To understand this variation between the domains, which only appears for the rotating case, we analyse the domain-size effects on the strength of large-scale pinned structures. In figure 4, we show visualizations of the temporally and streamwise-averaged streamwise vorticity  $\unicode[STIX]{x1D6FA}_{x}$. Why this definition of
 $\unicode[STIX]{x1D6FA}_{x}$ captures the large-scale structures is discussed more elaborately in § 3.3, but for now we note that it highlights streamwise-invariant structures that are pinned in the spanwise direction. A strong pinned structure is prominent for the very small domain, due to the constrained periodicity. The structure is somewhat weakened for the small domain, and the colours are less intense on figure 4. The three-halves domain shows an organized pinned structure at three-halves the wavelength of the small domain, which remarkably does not affect the mean flow statistics of figure 3. The medium domain and large domains present a larger number of organized structures, consistent with what is seen in the autocorrelations. Even if the medium and small domains have structures with the same wavenumber, the number of structures is different. This indicates that what is causing the differences in velocities must not be within the structures themselves, but in their interactions with each other and the near-wall regions.
Pseudo-colour plot of  $\unicode[STIX]{x1D6FA}_{x}$ for the five domain sizes simulated, at
 $R_{\unicode[STIX]{x1D6FA}}=0.32$. Contours levels for vorticity are shown at zero to highlight the large-scale structures.

We will not be able to completely remove domain-size effects, as this study shows. From here, we proceed with the ‘small’ domain with a single structure, as it allows us to explore a large parameter space while running the simulations for long times to gather enough statistics. We acknowledge that domain-size effects are unavoidable.
3 Results
3.1 The nature of shear transport
First, we show that the shear force in large-Reynolds-number Waleffe flow is transported almost exclusively by Reynolds stresses. In the statistically stationary regime, the mean velocities do not depend on time. We can write down an average of the total shear  $\unicode[STIX]{x1D70F}$ transported across a wall-normal plane, which is
 $$\begin{eqnarray}\langle \unicode[STIX]{x1D70F}\rangle =\unicode[STIX]{x1D707}\frac{\text{d}\langle u\rangle }{\text{d}y}+\unicode[STIX]{x1D70C}\langle uv\rangle ,\end{eqnarray}$$
where  $\unicode[STIX]{x1D70C}$ is the fluid density and
 $\unicode[STIX]{x1D707}$ is the dynamic viscosity. Equation (3.1) just states that, in the statistically stationary regime, shear is transported either through viscosity or through Reynolds stresses.
In high-Reynolds-number Waleffe flow, we may assume that the viscous shear transport ( $\unicode[STIX]{x1D707}\,\text{d}\langle u\rangle /\text{d}y$) is negligible. This is because, as
 $Re$ increases, the velocity gradients remain approximately constant. No viscous boundary layer where the average velocity has a sharp gradient is formed, because there is no wall with a no-slip condition. Hence, in the turbulent regime, the magnitude of the viscous term in (3.1) is
 $O(Re^{-1})$ smaller than that of the Reynolds stress term. With this, equation (3.1) becomes
 $$\begin{eqnarray}\langle \unicode[STIX]{x1D70F}\rangle \approx \unicode[STIX]{x1D70C}\langle uv\rangle .\end{eqnarray}$$
By differentiating (3.1) with respect to the wall-normal direction, and comparing it to the Navier–Stokes equations, we have that the shear transported must be balanced by the body force,
 $$\begin{eqnarray}\frac{\text{d}\langle \unicode[STIX]{x1D70F}\rangle }{\text{d}y}\approx \frac{\text{d}(\unicode[STIX]{x1D70C}\langle uv\rangle )}{\text{d}y}\approx \unicode[STIX]{x1D70C}\boldsymbol{f},\end{eqnarray}$$
and solving the above equations gives an analytic expression for the Reynolds stress,
 $$\begin{eqnarray}\langle uv\rangle =\frac{F}{\unicode[STIX]{x1D6FD}}\sin (\unicode[STIX]{x1D6FD}y).\end{eqnarray}$$
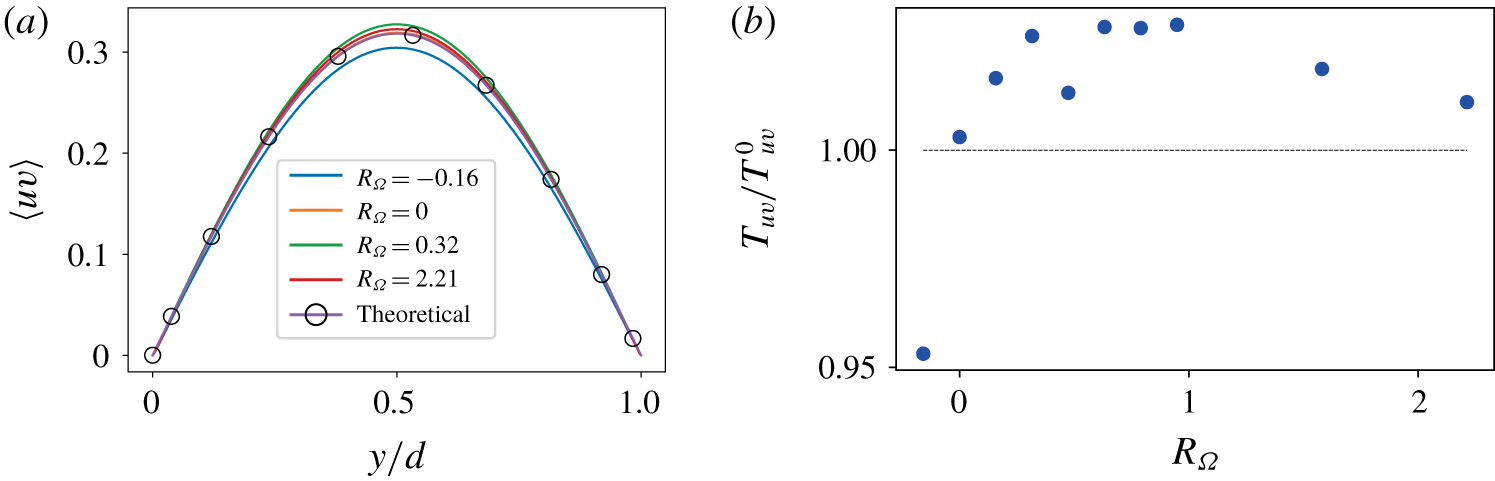
This is valid in the statistically stationary regime only if our assumption that shear transport is fully due to Reynolds stresses. We check this in figure 5(a), where we show the  $\langle uv\rangle$ Reynolds stress components for different rotation numbers, as well as the theoretical value for
 $\langle uv\rangle$ from (3.4). We find that
 $\langle uv\rangle$ is almost equal to the theoretical value for full shear transport due to Reynolds stresses for all rotation numbers shown, even if some deviations exist for
 $R_{\unicode[STIX]{x1D6FA}}=-0.16$, i.e. cyclonic rotation.
(a) Averaged transport for different  $R_{\unicode[STIX]{x1D6FA}}$ values. The theoretical value for fully turbulent shear transport is shown with hollow circles. (b) Normalized integrated transport
 $T_{uv}$ for different
 $R_{\unicode[STIX]{x1D6FA}}$ values.

To further quantify transport, we define  $T_{uv}$ as the integrated momentum transport in the wall-normal direction,
 $$\begin{eqnarray}T_{uv}=\int _{0}^{d}\langle uv\rangle \,\text{d}y,\end{eqnarray}$$
and calculate its deviation from the analytical value for purely turbulent transport  $T_{uv}^{o}=2F/\unicode[STIX]{x1D6FD}^{2}\approx 0.202Fd^{2}$. We show this quantity in figure 5(b). The numerical values of
 $T_{uv}$ are within approximately 3 % of the theoretical value for different rotation numbers, except for
 $R_{\unicode[STIX]{x1D6FA}}=-0.16$, corresponding to the case with cyclonic rotation. This tells us two things. First, that, as seen in plane Couette and Taylor–Couette flow, cyclonic rotation hampers turbulence and, in this case, the viscous transport accounts for
 ${\sim}5\,\%$ of the total transport. Second, that, for no rotation or anticyclonic rotation, the shear transport is fully turbulent and
 $T_{uv}$ instead gives us an estimate for the temporal convergence errors in the simulations, as
 $T_{uv}/T_{uv}^{o}$ is close to unity. From figure 5(b), these can be estimated at approximately 2 %–3 %.
Unlike previous studies of rotating plane Couette flow (Brauckmann et al. Reference Brauckmann, Salewski and Eckhardt2016), where the transported shear was a response of the system, an optimum momentum transport cannot be deduced from  $T_{uv}$, because this is an input of the simulation, and
 $T_{uv}\approx T_{uv}^{o}$ in all cases. To define an optimum momentum transport, we must turn towards other diagnostics. This is further investigated in §§ 3.2 and 3.3.
3.2 Velocity magnitudes and optimum shear transport
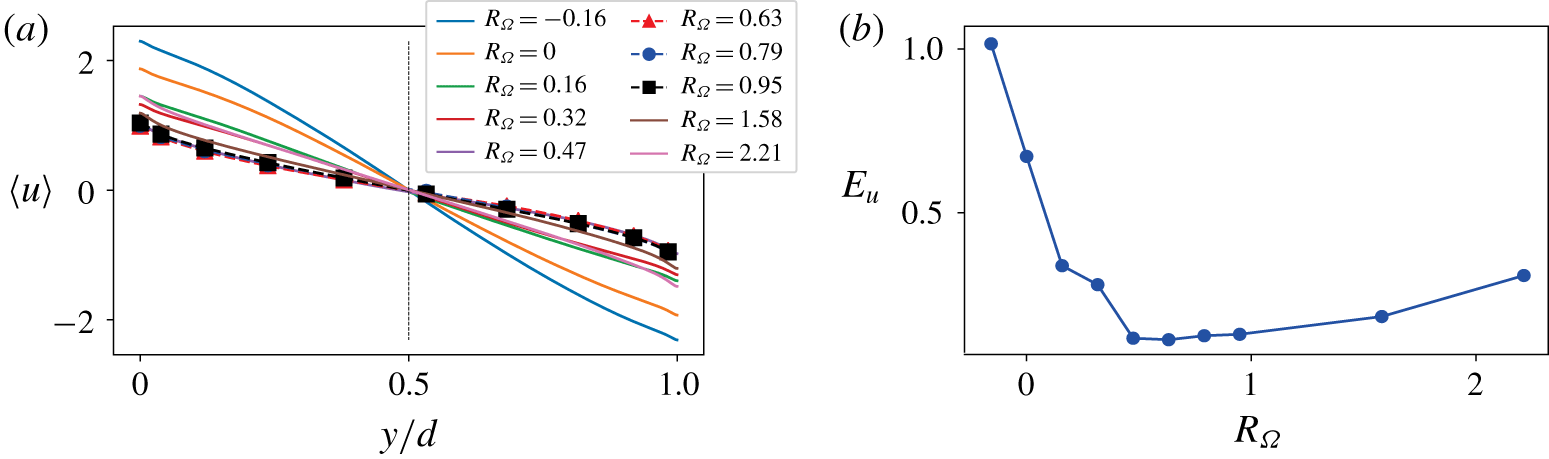
We now analyse the effect of rotation on the velocity profiles. In figure 6(a), we show the averaged streamwise velocity profiles between the free-slip walls for various rotation numbers  $R_{\unicode[STIX]{x1D6FA}}$. First, it can be seen that the velocity profiles are symmetric around the mid-gap (
 $y/d=0.5$), and that the slip velocity at the walls is maximum for
 $R_{\unicode[STIX]{x1D6FA}}=-0.16$. As the rotation number increases, the velocity profiles show a decrease in the slip velocity until a minimum is reached at approximately
 $R_{\unicode[STIX]{x1D6FA}}=0.63$.
(a) Averaged streamwise velocity  $\langle u\rangle$ for different values of
 $R_{\unicode[STIX]{x1D6FA}}$. (b) Average kinetic energy of the mean streamwise flow
 $E_{u}$ for different values of
 $R_{\unicode[STIX]{x1D6FA}}$.

To quantify this, we define  $E_{u}$, the average streamwise kinetic energy of the flow, as
 $$\begin{eqnarray}E_{u}=\frac{1}{2d}\int _{0}^{d}\langle u\rangle ^{2}\,\text{d}y=\frac{1}{2}U^{\ast 2},\end{eqnarray}$$
with  $U^{\ast }$ a characteristic streamwise mean velocity. This
 $U^{\ast }$ is a response of the system. The dependence of
 $E_{u}$ on
 $R_{\unicode[STIX]{x1D6FA}}$ is shown in figure 6(b). As anticyclonic rotation is introduced, a prominent decrease of
 $E_{u}$ is seen, with a flat plateau around
 $R_{\unicode[STIX]{x1D6FA}}=0.4{-}1.5$, after which
 $E_{u}$ increases again. This means that the same amount of momentum
 $T_{uv}$ (response) is transferred with a smaller velocity (input). We can use this to define the optimum shear transport as the value of
 $R_{\unicode[STIX]{x1D6FA}}$ for which
 $E_{u}$ is minimum. With this interpretation, we can say that, for our simulations of rotating Waleffe flow, optimal transport appears as a broad ‘peak’ (which is actually a minimum) in a large range of
 $R_{\unicode[STIX]{x1D6FA}}$, similar to what was observed in low-Reynolds-number plane Couette flow by Brauckmann et al. (Reference Brauckmann, Salewski and Eckhardt2016). The minimum
 $E_{u}$ is located at approximately
 $R_{\unicode[STIX]{x1D6FA}}\approx 0.63$, but that minimum lies on a relatively smooth valley in the range
 $R_{\unicode[STIX]{x1D6FA}}\in (0.4,1.0)$.
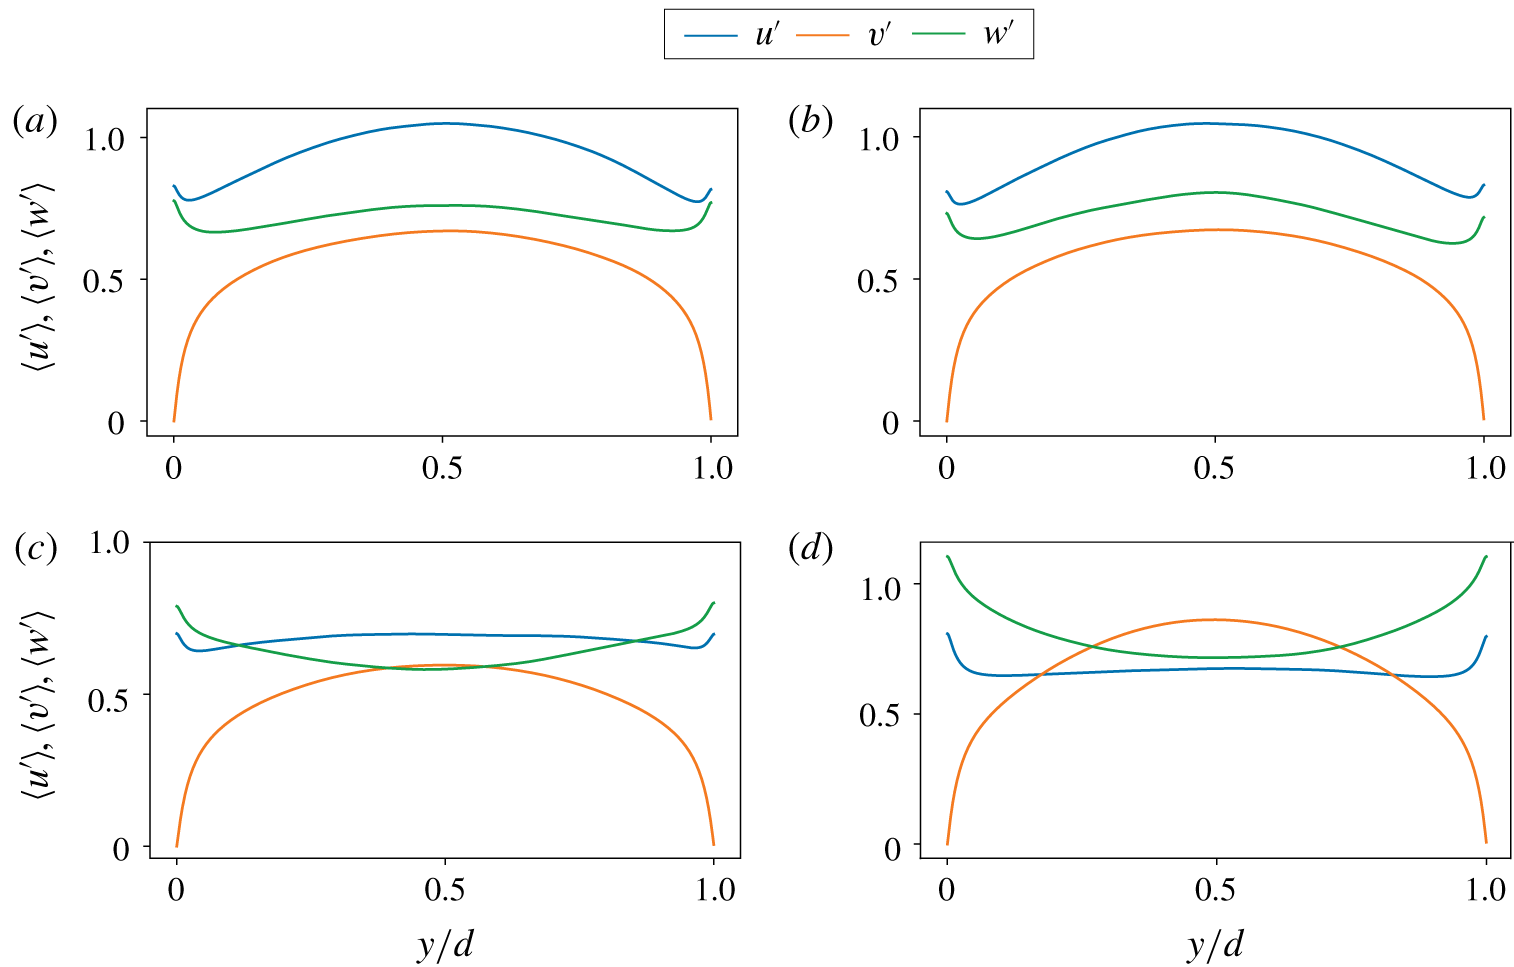
To understand the mechanisms behind the optimal transport, we turn to the velocity root-mean-square velocity fluctuation profiles, shown in figure 7 for some selected values of  $R_{\unicode[STIX]{x1D6FA}}$. The first thing we notice is the absence of a near-wall peak in the streamwise velocity fluctuation profiles. Instead, a local minimum is seen in some, but not all, cases. This suggests the absence of ordinary boundary layers due to the stress-free boundary condition. We expect that the high-Reynolds-number boundary layer instability behind the narrow peak optimum transport in plane Couette flow (Brauckmann & Eckhardt Reference Brauckmann and Eckhardt2017) will be absent.
Root-mean-square velocity fluctuations at  $R_{\unicode[STIX]{x1D6FA}}=-0.16$ (a),
 $R_{\unicode[STIX]{x1D6FA}}=0$ (b),
 $R_{\unicode[STIX]{x1D6FA}}=0.63$ (c) and
 $R_{\unicode[STIX]{x1D6FA}}=2.21$ (d).

The second thing we notice is that, for cyclonic and no rotation, the streamwise velocity fluctuations  $\langle u^{\prime }\rangle$ are largest of the three components at the mid-gap, but, as
 $R_{\unicode[STIX]{x1D6FA}}$ increases, the largest fluctuations become the ones in the wall-normal direction (
 $\langle v^{\prime }\rangle$). The largest streamwise velocity fluctuations
 $\langle u^{\prime }\rangle$ appear when
 $R_{\unicode[STIX]{x1D6FA}}=-0.16$, i.e.
 $R_{\unicode[STIX]{x1D6FA}}$ is minimum. As
 $R_{\unicode[STIX]{x1D6FA}}$ is increased, the values of
 $\langle u^{\prime }\rangle$ monotonically decrease. The smallest value of fluctuations corresponds to the largest value of
 $R_{\unicode[STIX]{x1D6FA}}=2.21$. However, for the wall-normal velocity fluctuations, the opposite pattern is seen, and the values of
 $\langle v^{\prime }\rangle$ increase with increasing
 $R_{\unicode[STIX]{x1D6FA}}$ up to
 $R_{\unicode[STIX]{x1D6FA}}=2.21$. The spanwise fluctuations show no discernible pattern in their variation with
 $R_{\unicode[STIX]{x1D6FA}}$. This gives a hint to the mechanism behind optimum transport: the Coriolis forces due to spanwise rotation appear with different signs in the streamwise (
 $x$) and wall-normal (
 $y$) components of the Navier–Stokes equations, in one case increasing the fluctuations, in the other decreasing them.
3.3 The effect of rotation on large-scale structures
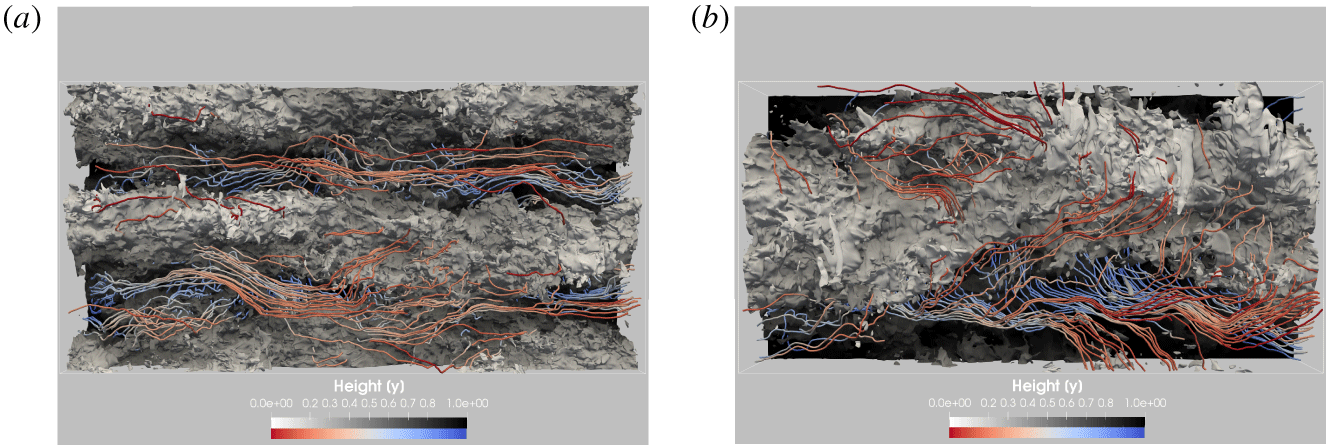
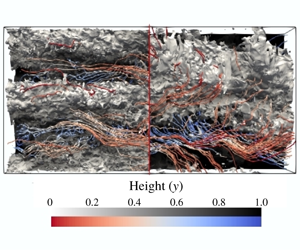
We now turn to the effect of rotation on large-scale structures. A visualization of the instantaneous streamwise velocity is shown in figure 8, with instantaneous streamlines superimposed. We first observe the presence of large-scale structures in the flow for both the rotating and non-rotating cases. This could be expected from the autocorrelations in figure 3.
Contour of instantaneous streamwise velocity  $u$ at
 $R_{\unicode[STIX]{x1D6FA}}=0.0$ (a), contour at
 $u=0.15$, and
 $R_{\unicode[STIX]{x1D6FA}}=0.63$ (b), contour at
 $u=-0.1$. The view is projected onto a
 $x$–
 $z$ plane, with the
 $y$ coordinate represented through colour. Flow is from left to right. The instantaneous streamlines are added, and coloured according to
 $y$ coordinate.

Large-scale flows can be considered secondary flows if their velocity components are perpendicular to the main flow direction. This is not always the case. In the absence of rotation, the streamwise velocity contour in figure 8 is largely invariant in the streamwise direction. The secondary flow, i.e. the cross-flow in the wall-normal and spanwise directions, is very weak. This can be deduced from the relatively straight path of the streamlines. From this, we do not expect it to play a role in transporting shear.
As anticyclonic rotation is introduced, the flow is heavily modified. The streamwise velocity contour now has a completely different shape. More importantly, the secondary flow is strengthened, as can be seen from the visualized streamlines, which move more in the wall-normal and spanwise direction. This secondary flow is of crucial importance, as it helps with the transport of shear.
To analyse these structures more quantitatively, we proceed in an analogous manner to Sacco et al. (Reference Sacco, Verzicco and Ostilla-Mónico2019). Secondary flows are captured through the streamwise vorticity, as they are perpendicular to the main flow direction. By looking at the streamwise and temporal average of this quantity ( $\unicode[STIX]{x1D6FA}_{x}$), we capture only the spanwise-pinned streamwise-invariant structures, which are known to be the most relevant for shear transport. If large-scale structures are moving around the computational domain, they would not be captured by
 $\unicode[STIX]{x1D6FA}_{x}$, as the averages would vanish.
Figure 9 shows  $\unicode[STIX]{x1D6FA}_{x}$ for different values of
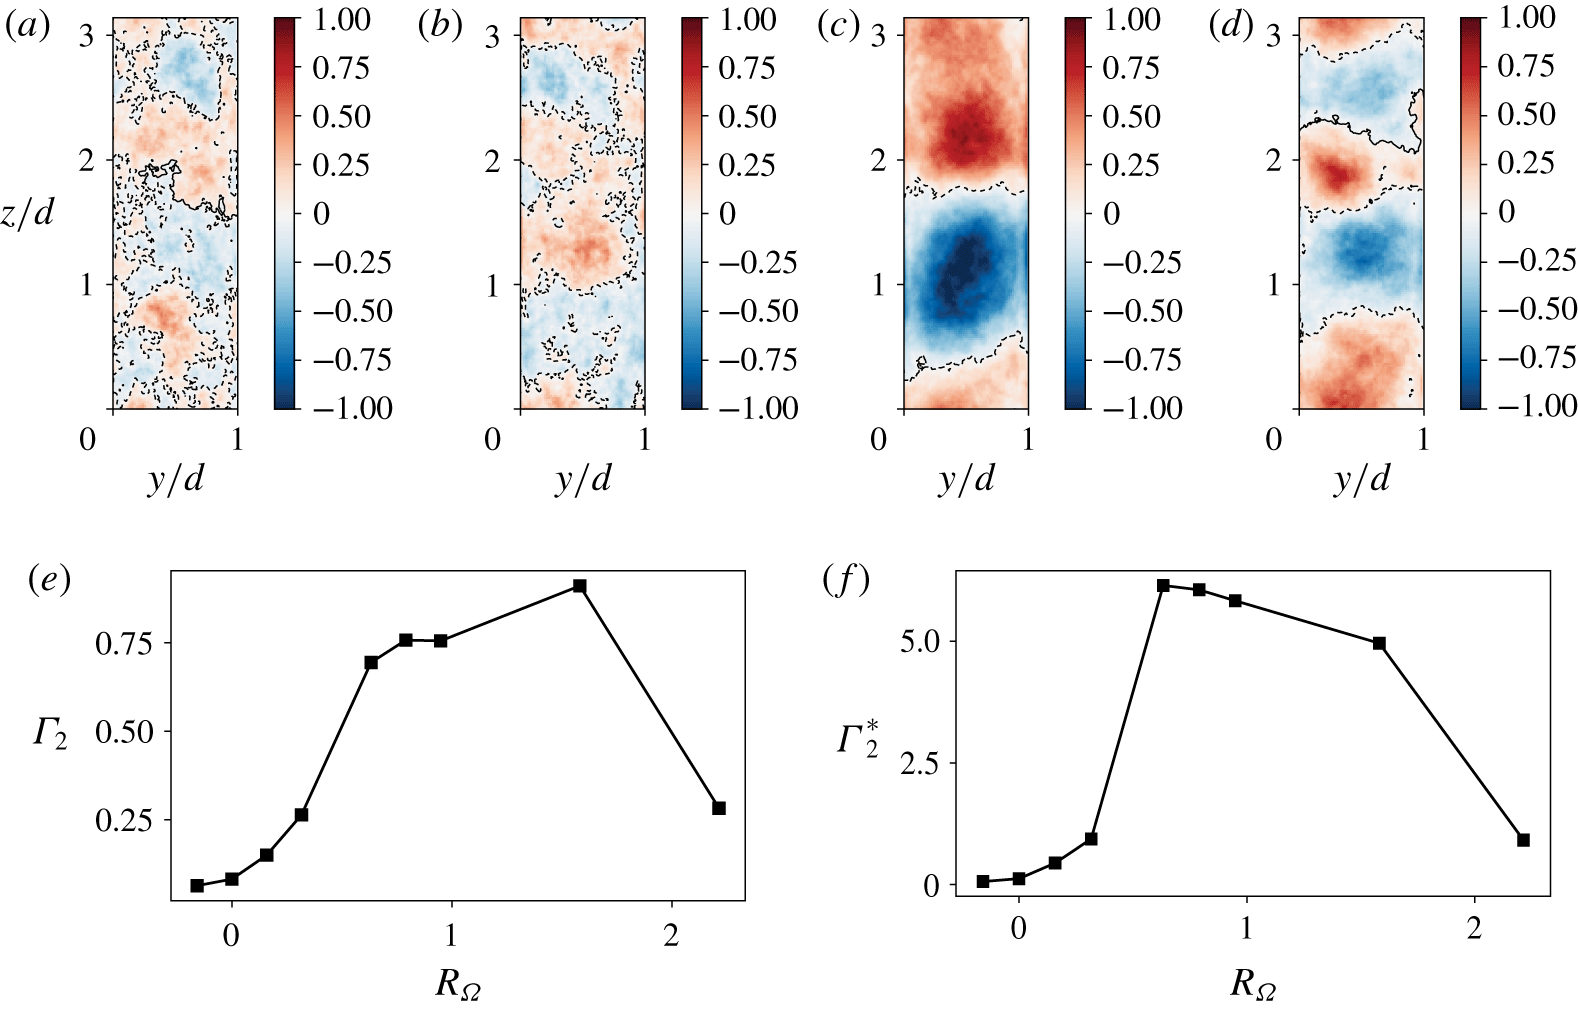
 $R_{\unicode[STIX]{x1D6FA}}$. As hinted at by figure 8, spanwise-pinned and streamwise-invariant secondary flows, with a vorticity core, appear as anticyclonic rotation is introduced. The strength of the roll-like structures appears to increase with increasing anticyclonic rotation. At approximately
 $R_{\unicode[STIX]{x1D6FA}}\approx 1.5$, the trend changes, and further increasing the rotation makes the structures unorganized, as shown in figure 9(d) at
 $R_{\unicode[STIX]{x1D6FA}}=2.21$.
Panels (a–d) represent the streamwise and temporally averaged streamwise vorticity  $\unicode[STIX]{x1D6FA}_{x}$ for
 $R_{\unicode[STIX]{x1D6FA}}=-0.16$, 0.0, 0.63 and 2.21 (left to right). A black contour at zero has been added to delineate negative vorticity from positive vorticity regions. Panel (e) shows the averaged circulation energy
 $\unicode[STIX]{x1D6E4}_{2}$ for the large-scale structures in the range of
 $R_{\unicode[STIX]{x1D6FA}}\in [-0.16,2.21]$, and panel (f) depicts the effective averaged circulation energy
 $\unicode[STIX]{x1D6E4}_{2}^{\ast }$ in the same
 $R_{\unicode[STIX]{x1D6FA}}$ range.

To quantify the strength of the rolls, we define the mean-squared circulation of the rolls as the volume integral
 $$\begin{eqnarray}\unicode[STIX]{x1D6E4}_{2}=\frac{1}{dL_{z}}\int _{0}^{d}\int _{0}^{L_{z}}\unicode[STIX]{x1D6FA}_{x}^{2}\,\text{d}y\,\text{d}z,\end{eqnarray}$$
and show this as a function of  $R_{\unicode[STIX]{x1D6FA}}$ in figure 9(e). We can see how the strength of the pinned rolls increases with increasing
 $R_{\unicode[STIX]{x1D6FA}}$ until the maximum is reached. However, using
 $R_{\unicode[STIX]{x1D6FA}}$ to compare roll strength is not totally fair. As shown in § 3.2, the underlying magnitudes of velocity change. Therefore, we define
 $\unicode[STIX]{x1D6E4}_{2}^{\ast }=\unicode[STIX]{x1D6E4}_{2}\tilde{U} ^{2}/U^{\ast 2}$, where
 $U^{\ast }$, a characteristic streamwise velocity, was defined in (3.6). We show
 $\unicode[STIX]{x1D6E4}_{2}^{\ast }$ as a function of
 $R_{\unicode[STIX]{x1D6FA}}$ in figure 9(f), and observe that the strongest and most ordered structures correspond to the range
 $R_{\unicode[STIX]{x1D6FA}}=0.47{-}1$. This coincides with the range of
 $R_{\unicode[STIX]{x1D6FA}}$ for which optimal shear transport takes place, and highlights the link between optimal transport and strongest large-scale structures as was seen in plane Couette flow by Brauckmann & Eckhardt (Reference Brauckmann and Eckhardt2013, Reference Brauckmann and Eckhardt2017).
3.4 Large-scale structures and the self-sustained process
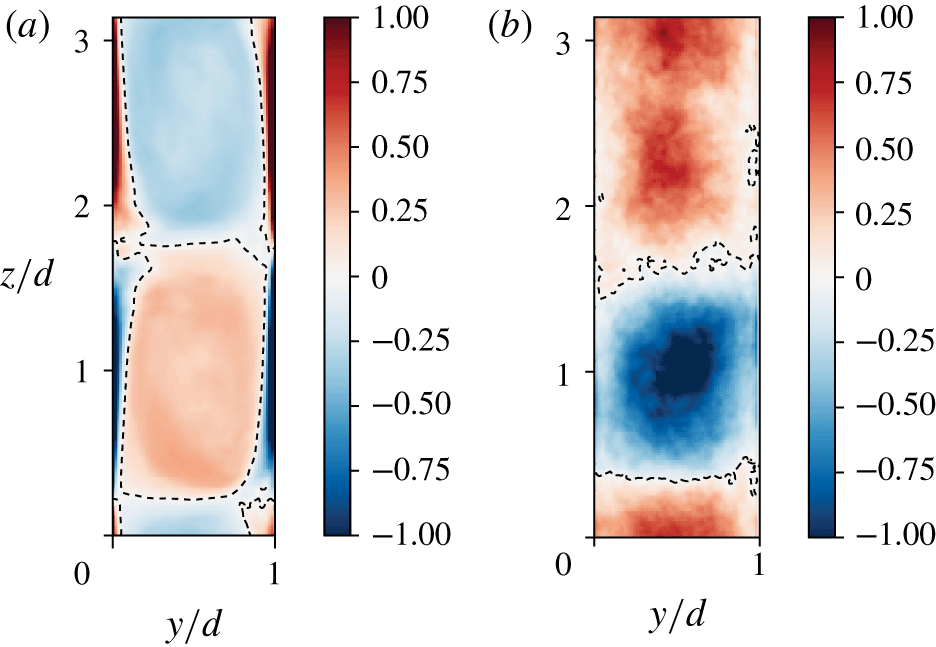
First, we visually compare the rolls in rotating Waleffe flow to those in rotating plane Couette flow in figure 10 using  $\unicode[STIX]{x1D6FA}_{x}$. One thing we notice is that these structures are more clearly defined in plane Couette flow than in Waleffe flow. Furthermore, the streamwise vorticity of the rolls is localized in the core of the structures in Waleffe flow. The streamwise vorticity in plane Couette flow is localized mainly in the boundaries of the structure, with additional vorticity being generated by the boundary layers. Nevertheless, these results show that pinned large-scale structures arise only with a generic shear and anticyclonic rotation.
Pseudo-colour plot of temporally averaged streamwise vorticity  $\unicode[STIX]{x1D6FA}_{x}$ for plane Couette flow at
 $R_{\unicode[STIX]{x1D6FA}}=0.1$ (a) and rotating Waleffe flow at
 $R_{\unicode[STIX]{x1D6FA}}=0.63$ (b). Contour levels for vorticity are shown at zero to highlight the large-scale structures.

We can probe the temporal behaviour of the large-scale structure. In Sacco et al. (Reference Sacco, Verzicco and Ostilla-Mónico2019), a link between the large-scale fixed structures in Taylor–Couette flow, i.e. the turbulent Taylor rolls, and the SSP was found by analysing the rolls in Fourier space following Hamilton et al. (Reference Hamilton, Kim and Waleffe1995). While the analogy was far from perfect, the mean flow energy was found to oscillate in antiphase with the spanwise fundamental mode, which represented the large-scale structure through its rolls and streaks.
We proceed in the same manner, and we begin by defining the modal root-mean-square velocity as
 $$\begin{eqnarray}M(k_{x}=\unicode[STIX]{x1D6FC}m,k_{z}=\unicode[STIX]{x1D6FD}n)=\left[\int _{0}^{d}(\hat{u} ^{2}(m\unicode[STIX]{x1D6FC},y,n\unicode[STIX]{x1D6FD})+\hat{v}^{2}(m\unicode[STIX]{x1D6FC},y,n\unicode[STIX]{x1D6FD})+{\hat{w}}^{2}(m\unicode[STIX]{x1D6FC},y,n\unicode[STIX]{x1D6FD}))\,\text{d}y\right]^{1/2}\!,\end{eqnarray}$$
where  $\unicode[STIX]{x1D6FC}=2\unicode[STIX]{x03C0}/L_{x}$ and
 $\unicode[STIX]{x1D6FD}=2\unicode[STIX]{x03C0}/L_{z}$ are the fundamental streamwise and spanwise wavenumbers, and
 $\hat{\unicode[STIX]{x1D719}}$ represents the Fourier transform of
 $\unicode[STIX]{x1D719}$ in the spanwise and streamwise directions. We focus on two modes:
 $M(0,0)$, the spanwise- and streamwise-invariant mode, which represents the mean flow; and
 $M(0,\unicode[STIX]{x1D6FD})$, the streamwise-independent fundamental in
 $z$, corresponding to the large-scale structure.
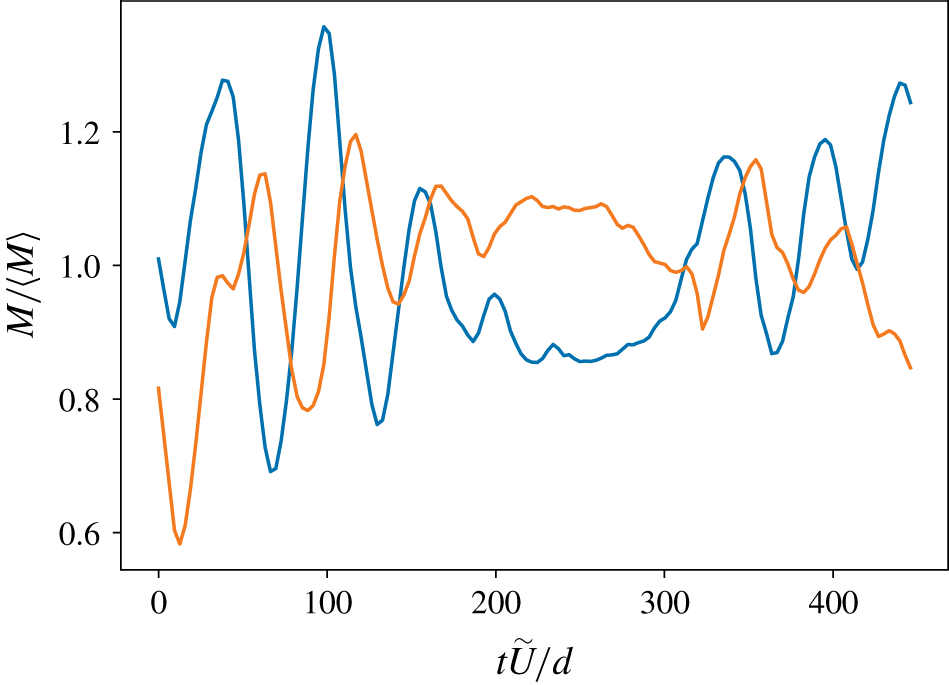
In figure 11 we see that the energies of these two modes oscillate on time scales of  $O(50d/\tilde{U} )$, and the period of the two quantities is almost anticorrelated, consistent with the breakdown–regeneration structure of shear flows described in Hamilton et al. (Reference Hamilton, Kim and Waleffe1995), and the behaviour of the turbulent Taylor rolls in Sacco et al. (Reference Sacco, Verzicco and Ostilla-Mónico2019). Energy is constantly being redistributed from the mean flow into the streaks and rolls of the large-scale structure. Remarkably, there are some ‘dead’ times (
 $t\tilde{U} /d=200{-}300$) where the cycle is temporarily broken and there is no significant exchange of energy.
Temporal evolution of the normalized modal root-mean-square velocity in the Fourier space associated with the  $M(0,\unicode[STIX]{x1D6FD})$ mode (orange) and the
 $M(0,0)$ mode (blue) for
 $R_{\unicode[STIX]{x1D6FA}}=0.63$.

We can probe the origin of the structures following the procedure set out in Pirozzoli et al. (Reference Pirozzoli, Modesti, Orlandi and Grasso2018). Secondary flows are perpendicular to the main flow, and as such will have vorticity mainly in the main flow direction, i.e. the streamwise direction. Starting off with a Reynolds-averaged (in the streamwise and time coordinates) equation for  $\unicode[STIX]{x1D6FA}_{x}$ (Einstein & Li Reference Einstein and Li1958), we have
 $$\begin{eqnarray}\overline{v}\frac{\unicode[STIX]{x2202}\unicode[STIX]{x1D6FA}_{x}}{\unicode[STIX]{x2202}y}+\overline{w}\frac{\unicode[STIX]{x2202}\unicode[STIX]{x1D6FA}_{x}}{\unicode[STIX]{x2202}z}=\left(\frac{\unicode[STIX]{x2202}^{2}}{\unicode[STIX]{x2202}y^{2}}-\frac{\unicode[STIX]{x2202}^{2}}{\unicode[STIX]{x2202}z^{2}}\right)(-\langle \overline{v^{\prime }w^{\prime }}\rangle )+\frac{\unicode[STIX]{x2202}^{2}}{\unicode[STIX]{x2202}y\unicode[STIX]{x2202}z}(\overline{v^{\prime 2}}-\overline{w^{\prime 2}})+\unicode[STIX]{x1D708}\left(\frac{\unicode[STIX]{x2202}^{2}\unicode[STIX]{x1D6FA}_{x}}{\unicode[STIX]{x2202}z^{2}}+\frac{\unicode[STIX]{x2202}^{2}\unicode[STIX]{x1D6FA}_{x}}{\unicode[STIX]{x2202}z^{2}}\right),\end{eqnarray}$$
where  $\overline{\unicode[STIX]{x1D719}}$ denotes a temporal and streamwise average,
 $\unicode[STIX]{x1D719}^{\prime }$ are fluctuations around that mean and
 $\overline{\unicode[STIX]{x1D714}}_{x}$ is simply
 $\unicode[STIX]{x1D6FA}_{x}$. The various terms in this equation are associated with the effect of mean cross-stream convection (left-hand side), secondary turbulent shear stress (first term on right-hand side), normal stress anisotropy (second term) and viscous diffusion (third term). If the convective terms vanish, the convective transport of average streamwise vorticity is zero. If this holds, it should be possible to write a streamfunction for the cross-flow secondary motions which has a strict functional relationship to the vorticity (Pirozzoli et al. Reference Pirozzoli, Modesti, Orlandi and Grasso2018).
The streamfunction is evaluated by solving
 $$\begin{eqnarray}\unicode[STIX]{x1D6FB}^{2}\unicode[STIX]{x1D713}=-\unicode[STIX]{x1D6FA}_{x},\end{eqnarray}$$
with a constant Dirichlet boundary conditions at the walls, because the stress-free walls behave like a streamline. We take this free constant to be zero.
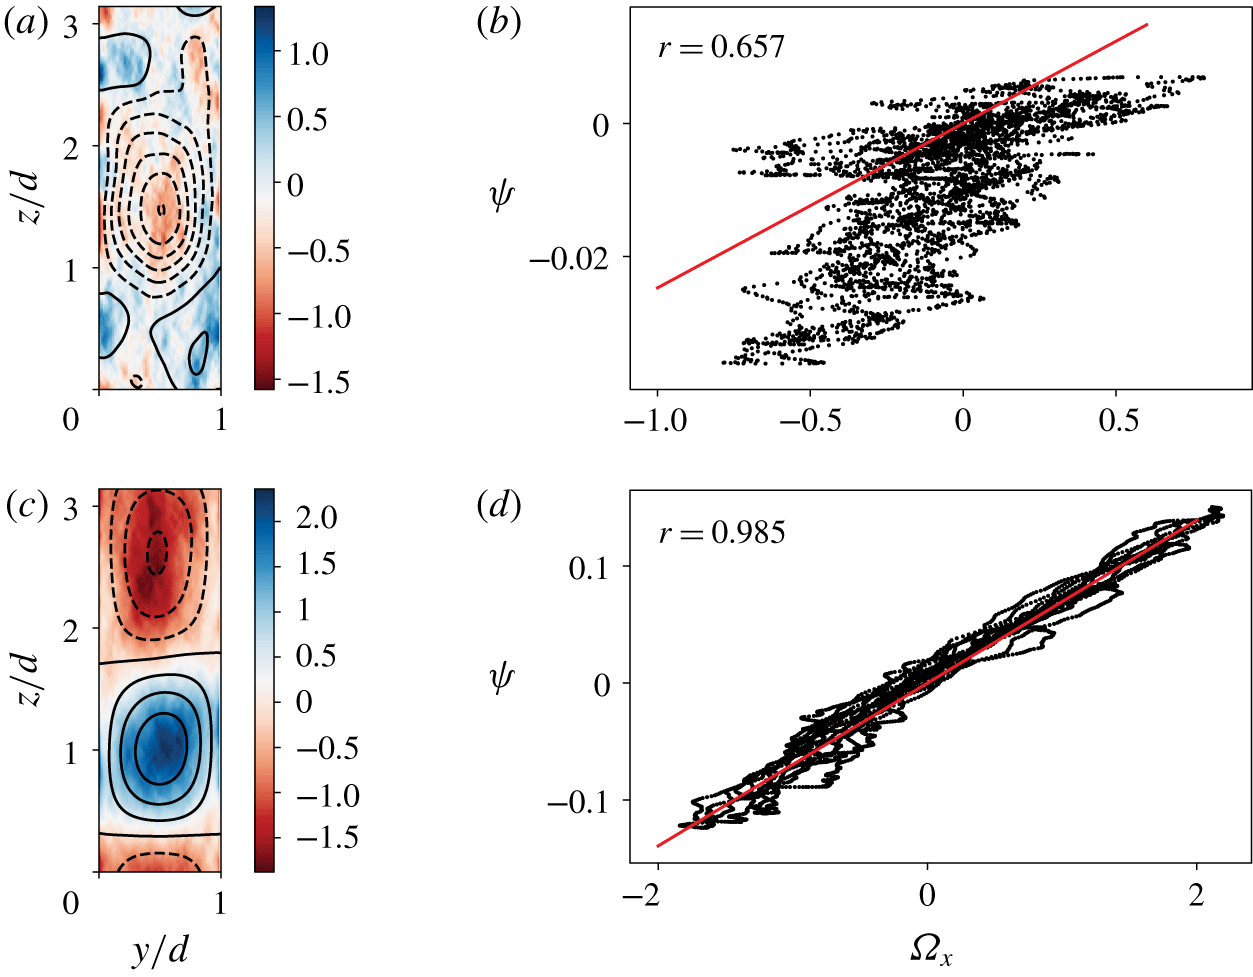
In figure 12(a,b), we superimpose contours of constant  $\unicode[STIX]{x1D713}$ onto a pseudo-colour plot of
 $\unicode[STIX]{x1D6FA}_{x}$. No clear relationship can be seen for
 $R_{\unicode[STIX]{x1D6FA}}=0$, but the circular contours of
 $\unicode[STIX]{x1D713}$ at
 $R_{\unicode[STIX]{x1D6FA}}=0.63$ overlap onto the large-scale structures of
 $\unicode[STIX]{x1D6FA}_{x}$, making evident the relationship between
 $\unicode[STIX]{x1D713}$ and
 $\unicode[STIX]{x1D6FA}_{x}$. The functional relationship between
 $\unicode[STIX]{x1D713}$ and
 $\unicode[STIX]{x1D6FA}_{x}$ is shown more prominently in figure 12(d), where a scatterplot of
 $\unicode[STIX]{x1D713}$ and
 $\unicode[STIX]{x1D6FA}_{x}$ for
 $0.1<y/d<0.9$ is shown. A quasi-linear relationship between them can be seen in the regions far away from the wall.
(a,c) Pseudo-colour plot showing  $\unicode[STIX]{x1D6FA}_{x}$ at
 $R_{\unicode[STIX]{x1D6FA}}=0$ (a,b) and
 $R_{\unicode[STIX]{x1D6FA}}=0.63$ (c,d) with contours of constant
 $\unicode[STIX]{x1D713}$ superimposed. The contours on the plot in (a) are spaced 0.012 units of
 $\unicode[STIX]{x1D713}$, while on the plot in (b) they are spaced 0.04 units of
 $\unicode[STIX]{x1D713}$, with dashed contours indicating negative values of
 $\unicode[STIX]{x1D713}$. (b,d) Scatterplots of
 $\unicode[STIX]{x1D713}$ against
 $\unicode[STIX]{x1D6FA}_{x}$ corresponding to the plots on the left. The best linear fit is plotted in red.

This can be understood following Pirozzoli et al. (Reference Pirozzoli, Modesti, Orlandi and Grasso2018), who decomposed  $\unicode[STIX]{x1D6FA}_{x}$ as eigenfunctions of the Laplace operator:
 $$\begin{eqnarray}(\unicode[STIX]{x1D6FB}^{2}+k^{2})\unicode[STIX]{x1D713}=0.\end{eqnarray}$$
The admissible values of  $k$ give us the different eigenfunctions of the Laplacian. A linear regression, fitted to data at
 $y/d\in [0.1,0.9]$, shows the best-fitting line coefficient (
 $k^{2}$) at
 $6.96\times 10^{-2}$, giving the value of
 $\unicode[STIX]{x1D6FA}_{x}=k^{2}\unicode[STIX]{x1D713}$. This indicates that the fixed secondary motions in Waleffe flow correspond very well to a single eigenmode of the Laplacian operator. Overall, these results differ little from those obtained in plane Couette flow, showing that the behaviour of the large scales is barely affected by the no-slip condition.
4 Summary and conclusions
We performed DNS of rotating Waleffe flow at a fixed  $Re=3.61\times 10^{3}$. Once adequate resolution was determined, a study of the effect of domain size was performed. The decorrelation lengths in the spanwise and streamwise directions were shown to have a strong dependence on the domain size. They further revealed that rotation does not substantially affect the velocity autocorrelations in the streamwise direction, but that it has a strong effect on the spanwise direction, as it modifies the large-scale structures.
Anticyclonic spanwise rotation modifies the shear transport, and an ‘optimal’ shear transport appears at approximately  $R_{\unicode[STIX]{x1D6FA}}\approx 0.63$, inasmuch as the mean streamwise energy is reduced to a minimum for a fixed shear transport. This is because the transported shear has to equal the underlying forcing. Anticyclonic rotation also modifies the underlying velocity fluctuation profiles, heavily decreasing streamwise fluctuations and enhancing wall-normal fluctuations.
Owing to the absence of boundary layers, we linked optimal transport in rotating Waleffe flow to the broad peak of optimal shear transport in plane Couette flow found by Brauckmann et al. (Reference Brauckmann, Salewski and Eckhardt2016). In a similar manner as discussed in Brauckmann & Eckhardt (Reference Brauckmann and Eckhardt2013) and Brauckmann et al. (Reference Brauckmann, Salewski and Eckhardt2016), this ‘peak’ is linked to the appearance and strengthening of pinned large-scale structures. Once the energy was corrected to account for the varying strength of the mean flow, these structures were found to be strongest at approximately the same values of  $R_{\unicode[STIX]{x1D6FA}}\in (0.4,1)$, which corresponds to the value of
 $R_{\unicode[STIX]{x1D6FA}}$ that achieves optimal transport. The structures were found to periodically take energy from the mean flow to energize, and were also linked to eigenvalues of a streamfunction for secondary flows, following Pirozzoli et al. (Reference Pirozzoli, Modesti, Orlandi and Grasso2018).
With these simulations we have shown that the appearance of streamwise-invariant, spanwise-pinned structures that increase transport are a generic characteristic of anticyclonic shear flows, appearing in both rotating Waleffe and rotating plane Couette flows. We note that these structures appear to be invariant in a direction normal to rotation, unlike those which could be expected from the Taylor–Proudman problem. An avenue for further research, aside from increasing the Reynolds number, is probing homogeneous shear turbulence to search for these structures. This system removes the last confinement on the structures, the no-penetration top and bottom walls.
Acknowledgements
We thank B. Eckhardt, S. Pirozzolli, F. Sacco and R. Verzicco for fruitful discussions. We thank the Center for Advanced Computing and Data Science (CACDS) at the University of Houston for providing computing resources.